Fig. 5
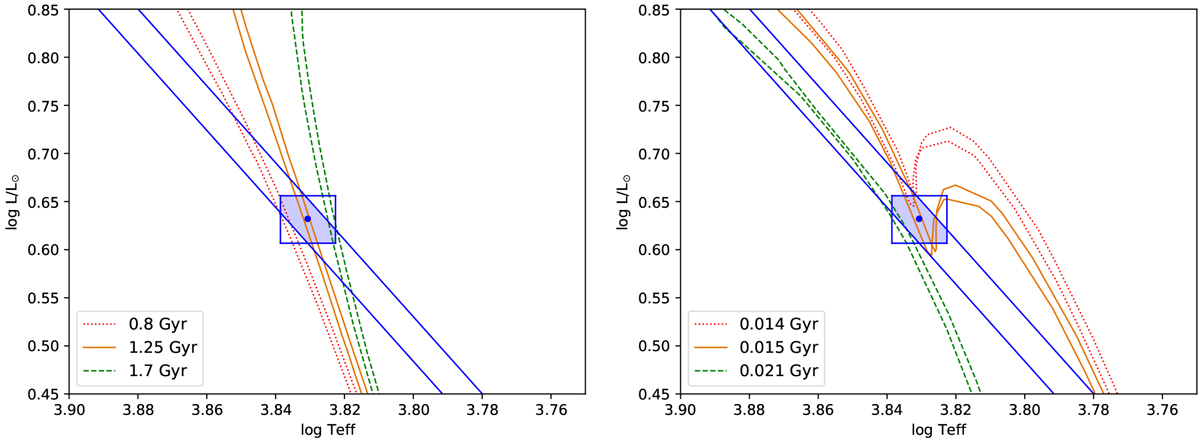
Position of HD 113337 in the Hertzprung-Russell diagram. Left plot: old solution; right plot: young solution. On both plots, the blue dot and blue box represent the [ log (Teff), log (L⋆ ∕L⊙)] values and 1σ uncertainties (respectively) deduced from our analysis. The blue solid straight lines represent the constraints (1σ uncertainties) on R⋆. On both plots, evolutionary tracks for Z in the range 0.0169–0.0185 are shown for three cases: best age solution (solid orange curves), lower age limit (dotted red curves), andupper age limit (dashed green curves).
Current usage metrics show cumulative count of Article Views (full-text article views including HTML views, PDF and ePub downloads, according to the available data) and Abstracts Views on Vision4Press platform.
Data correspond to usage on the plateform after 2015. The current usage metrics is available 48-96 hours after online publication and is updated daily on week days.
Initial download of the metrics may take a while.