| Issue |
A&A
Volume 624, April 2019
|
|
|---|---|---|
| Article Number | A110 | |
| Number of page(s) | 21 | |
| Section | Planets and planetary systems | |
| DOI | https://doi.org/10.1051/0004-6361/201834677 | |
| Published online | 19 April 2019 | |
Survival rates of planets in open clusters: the Pleiades, Hyades, and Praesepe clusters
1
Department of Astronomy, Graduate School of Science, The University of Tokyo,
7-3-1 Hongo,
Bunkyo-ku,
Tokyo 1130033, Japan
e-mail: fujii@astron.s.u-tokyo.ac.jp
2
Astrobiology Center,
2-21-1 Osawa,
Mitaka,
Tokyo 1818588, Japan
3
National Astronomical Observatory of Japan,
2-21-1 Osawa,
Mitaka,
Tokyo 1818588, Japan
e-mail: yasunori.hori@nao.ac.jp
Received:
18
November
2018
Accepted:
11
March
2019
Context. In clustered environments, stellar encounters can liberate planets from their host stars via close encounters. Although the detection probability of planets suggests that the planet population in open clusters resembles that in the field, only a few dozen planet-hosting stars have been discovered in open clusters.
Aims. We explore the survival rates of planets against stellar encounters in open clusters similar to the Pleiades, Hyades, and Praesepe and embedded clusters.
Methods. We performed a series of N-body simulations of high-density and low-density open clusters, open clusters that grow via mergers of subclusters, and embedded clusters. We semi-analytically calculated the survival rate of planets in star clusters up to ~1 Gyr using relative velocities, masses, and impact parameters of intruding stars.
Results. Less than 1.5% of close-in planets within 1 AU and at most 7% of planets with 1–10 AU are ejected by stellar encounters in clustered environments after the dynamical evolution of star clusters. If a planet population from 0.01–100 AU in an open cluster initially follows the probability distribution function of exoplanets with semi-major axis (ap) between 0.03 and 3 AU in the field discovered by RV surveys (∝ ap−0.6), the PDF of surviving planets beyond ~10 AU in open clusters can be slightly modified to ∝ ap−0.76. The production rate of free-floating planets (FFPs) per star is 0.0096–0.18, where we have assumed that all the stars initially have one giant planet with a mass of 1–13 MJup in a circular orbit. The expected frequency of FFPs is compatible with the upper limit on that of FFPs indicated by recent microlensing surveys. Our survival rates of planets in open clusters suggest that planets within 10 AU around FGKM-type stars are rich in relatively-young (≲10–100 Myr for open clusters and ~1–10 Myr for embedded clusters), less massive open clusters, which are promising targets for planet searches.
Key words: planets and satellites: formation / open clusters and associations: general / globular clusters: individual: Pleiades / globular clusters: individual: Prasepe / globular clusters: individual: Hyades
© ESO 2019
1 Introduction
Advances in optical and infrared detection capabilities over the past 20 yr have allowed us to find small planets with masses or radii comparable to the Earth and directly image giant planets in wide orbits beyond 10 AU. Since the first discovery of an exoplanet in 1995, the existence of nearly 4000 exoplanets has been reported1.
Most stars are believed to be born in clustering environment (e.g., Lada et al. 1993; Carpenter 2000; Lada & Lada 2003). Except for some open clusters, such clustering stars would become field stars. Are there any differences in the fraction of planet-harboring stars between the field and open clusters? A number of surveys have monitored stars in young, metal-rich open clusters in order to explore the planet population in star clusters. However, the discovery of only approximately ten planets in four open clusters, the Hyades (Sato et al. 2007; Quinn et al. 2014; Mann et al. 2016), Praesepe (Beehive; Quinn et al. 2012; Malavolta et al. 2016), M67 (Brucalassi et al. 2014, 2016, 2017), and IC 4651 (Delgado Mena et al. 2018), has been disclosed by RV surveys. A planetary candidate previously reported in NGC 2423 (Lovis & Mayor 2007) may be a false positive (Delgado Mena et al. 2018). RV surveys in other open clusters, NGC 2516, NGC 2422 (Bailey et al. 2016), and NGC 6253 (Montalto et al. 2011), ended in the non-detection of planet signals.
Except for possible transiting planets in the Praesepe (Pepper et al. 2008), transit photometry surveys in other thirteen open clusters below failed to find convincing dips produced by planets in light curves: NGC 6819 (Street et al. 2003), NGC 7789 (Bramich et al. 2005), NGC 6940 (Hood et al. 2005), NGC 6633 (Hidas et al. 2005), NGC 6791 (Bruntt et al. 2003; Mochejska et al. 2005; Montalto et al. 2007), NGC 7086 (Rosvick & Robb 2006), NGC 2158 (Mochejska et al. 2006), NGC 1245 (Burke et al. 2006), NGC 2660, NGC 6208 (e.g., von Braun et al. 2005), NGC 2362 (Miller et al. 2008), M37 (Hartman et al. 2009), and Trumpler 37 (Errmann et al. 2014a,b).
With Kepler and K2 missions, a handful of planets were newly detected in four star clusters: Kepler-66b and 67b in NGC 6811 (Meibom et al. 2013), five planets (K2-25 b, K2-136 b,c,d, and HD 283869 b) in the Hyades (Mann et al. 2016, 2018; Livingston et al. 2018; Ciardi et al. 2018), eight planets (K2-95 b, K2-100 b,101 b,102 b,103 b,104 b, and K2-264 b,c) and one planetary candidate (EPIC 211901114 b) in the Preasepe (Obermeier et al. 2016; Mann et al. 2017; Pepper et al. 2017; Rizzuto et al. 2018; Livingston et al. 2019), and K2-231 b in Ruprecht 147 (Curtis et al. 2018).
The current status of planet searches in open clusters is suggestive of the rarity of planets orbiting stars that reside in open clusters. In contrast, van Saders & Gaudi (2011) indicated that low detection probabilities of planets in distant open clusters cause the apparent lack of hot Jupiters, compared to the field. Meibom et al. (2013) suggested that both the orbital properties and the frequency of planets in open clusters are consistent with those in the field of the Milky Way. Brucalassi et al. (2017) also found that the occurrence rate of hot Jupiters in open clusters is slightly higher than that in the field. Previous planet searches indicated that planets discovered in open clusters appear to have properties in common with those found around the field stars.
It is interesting to investigate whether stellar encounters can destroy planetary systems in open clusters. The stellar encounter rate with a distance of d in a star cluster is approximately written as the inverse the time interval between encounters (tenc):
![\begin{eqnarray*} \frac{1}{t_{\textrm{enc}}} &=& 4\sqrt{\pi} n v d^2 \left(1 + \frac{GM_{\star}}{v^2 d} \right),\\[2pt]&&\sim\, 1.7 \times 10^{-6} \left(\frac{n}{10^2\,\textrm{star\,pc}^{-3}}\right) \left(\frac{v}{1\,\textrm{km\,s}^{-1}}\right) \left(\frac{d}{{10\,\rm AU}}\right)^2 \nonumber\\[2pt] &&\times\, \bigg[ 1 + 89 \left(\frac{M_{\star}}{1\,M_{\odot}}\right) \left(\frac{v}{1\,\textrm{km\,s}^{-1}}\right)^{-2} \left(\frac{d}{{10\,\rm AU}}\right)^{-1} \bigg]\,\,\,\textrm{Myr}^{-1}, \vspace*{-2pt}\end{eqnarray*}](/articles/aa/full_html/2019/04/aa34677-18/aa34677-18-eq3.png)
where n is the number density of stars, v is the velocity dispersion of stars, and M⋆ is the mass of individual stars in the star cluster (Binney & Tremaine 2008). Here, we assume a single-component cluster and therefore all star has the same mass. Open clusters have typically central densities of 1–102 M⊙ pc−3, ages of 1–103 Myr (see Fig. 1), and a low velocity dispersion of ≤ 1 km s−1. For open clusters, close encounters within 10 AU from a host star are expected to occur on timescales of > 100 Myr. With a stellar mass function and structure of star clusters, however, it is difficult to estimate the close encounter rate precisely using only such an analytic calculation.
Dynamical studies on planetary systems in open clusters started from the origin of Jovian planets with high eccentricities; for example, 16 Cygni Bb in a hierarchical triple star system. Stellar encounters in young clusters can rearrange the orbital configuration of gas giants. de La Fuente Marcos & de La Fuente Marcos (1997) applied N-body simulations to study the dynamical evolution of planetary systems including Jupiter-like planets in open clusters. Few Jovian planets on an initially circular obit have eccentric orbits after a four-body interaction between two singles stars and a planetary system. Laughlin & Adams (1998) also found that even though encounters of binary stars is taken into account, ejection of planets from the systems rarely happens in open clusters.
In fact, ejection rates of planets depend on properties of star clusters. Production rates of free floaters in star clusterschange in response to the velocity dispersion and initial stellar density for dense clusters (Smith & Bonnell 2001). More massive clusters with larger velocity dispersion enhance orbital disruption of gas giant planets. In globular clusters, a high ejection rate of planets was obtained from simulations (Hurley & Shara 2002). Using N-body and Monte-Carlo simulations, Spurzem et al. (2009) showed that disturbing encounters are rare for planets in open clusters such as the Hyades, whereas Pacucci et al. (2013) claimed that ~ 26% of stars lose their planets in the Pleiades due to tidal interactions. In more recent studies, Hao et al. (2013) and Cai et al. (2017) investigated the ejection of planets from multiplanet systems in open clusters. These results also suggested inner planets (< 10 AU), which RV surveys can detect, tend to survive. Especially, short-period gas giants with semi-major axes of < 0.1 AU such as hot Jupiters are unlikely to be stirred up in both young open and globular clusters (Davies & Sigurdsson 2001; Bonnell et al. 2001). In addition, Shara et al. (2016) claimed that a mutli-giant planet system in star clusters may have a higher frequency of hot Jupiters as a result of dynamical encounter of stars2.
Another possibility for the lack of planets is the failure of planet formation. Disk stripping induced by stellar encounters removes building blocks for gas giant formation. Bonnell et al. (2001) suggested that stellar encounters within 10 AU that truncate tidally a planet-forming disk should occur in globular clusters with > 105 stars pc−3. Breslau et al. (2014) derived a relation between the encounter distance and final disk size, following the results of their test particle simulations, and examined the disk truncation due to stellar encounters (Vincke et al. 2015; Vincke & Pfalzner 2016, 2018; Portegies Zwart 2016). These results suggested that in dense clusters, a significant number of protoplanetary disks can be disrupted by stellar encounters.
Not only the dynamical effect but far-ultraviolet (FUV) and extreme ultraviolet (EUV) radiation from massive stars can disrupt protoplanetary disks in a dense environment of star clusters (Adams et al. 2004; Ercolano & Clarke 2010; Yasui et al. 2010). Adams et al. (2006) suggested that the effect of photoevaporation is relatively small in small clusters with members of 100–1000. Winter et al. (2018) also estimated the disruption of protoplanetary disks in dense clusters with a number density of 104 pc−3 and found that in such a dense environment, photoevaporation due to FUV irradiations works stronger than dynamical encounters. In addition, there is a well-known positive correlation between the frequency of giant planets and stellar metallicity in the field (Fischer & Valenti 2005; Johnson et al. 2010a). Planet formation might have been quenched there in the globular clusters under extremely metal-poor environments rather than open clusters.
We investigate whether stellar encounters on planetary systems in a clustered environment can influence dynamical stability and detectability of exoplanets in open clusters, using N-body simulations. Most of previous studies assumed a spherical star cluster under virial equilibrium with a central density similar to those of observed open clusters and modeled thecluster as an equal-mass system (Spurzem et al. 2009; Pacucci et al. 2013). The initial state of open clusters, however, may be neither spherical nor virial equilibrium (Allison et al. 2010). For example, Parker & Quanz (2012) considered a fractal initial distribution of stars that mimics star-forming regions. They found that ~ 10% of planets at 30 AU were liberated from their host stars in such substructured clusters. Zheng et al. (2015) also performed N-body simulations starting from fractal distributions of stars and found that at most ~ 30% of planets at 100 AU are ejected from their host planets. Similarly, Fujii et al. (2012) suggested that the merger scenario of a subclusteredinitial condition is preferable for the observed young massive clusters. We therefore consider three types of cluster models (single open clusters, embedded clusters, and merged clusters). For single open cluster models, we adopt classical low-density models similar to Spurzem et al. (2009), high-density, and subclustered models that reproduce present-day properties of our target clusters.
In this paper, we perform a series of N-body simulations of star clusters, including stellar evolution, and examine survival rates of planetary systems against stellar encounters in the Pleiades, Hyades, and Praesepe-type clusters. This work extends previous studies on the fate of planetary systems in a star cluster by long-term N-body simulations of open clusters and estimate the survival fraction of planets for each spectral type of stars in open clusters. We focus on three known clusters because a large amount of data such as stellar positions for individual stars are available for them. We consider planetary systems with semi-major axes of 0.1–1000 AU under three types of cluster models, which have a stellar population based on the initial mass function: single open clusters, embedded clusters, and merged subclusters. In the next section, we describe each cluster model and the treatment of stellar close encounters with planetary systems. In Sect. 3, we present the dynamical evolution of the star clusters during 600 Myr and evaluate stellar encounter rates that cause orbital disruption of planetary systems. We also show ejection rates of planets from the system as functions of the orbital separation of planets and stellar types. Based on a realistic distribution of planets derived from RV and direct-imaging surveys, we discuss the occurrence rates of free-floating planets and the survival rates of planetary systems in star clusters. In Sect. 4. We also discuss prospects for Doppler and photometric surveys of planet-hosting stars in nearby open clusters, including the Pleiades. We summarize our results in the last section.
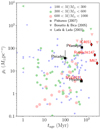 |
Fig. 1 Relationship between central densities of open clusters (ρc) and their ages (tage). The data are from Lada & Lada (2003) for left-pointing triangles, Bonatto & Bica (2005) for down-pointing triangles, and Piskunov et al. (2007) and Meibom et al. (2002) for circles and red diamonds (planet-harboring clusters). Each color represents the total mass of each open cluster: blue (100–300 M⊙), green (300–600 M⊙), and pink (600–1000 M⊙). Our target clusters and planet-harboring clusters are shown by filled black squares and red diamonds, respectively. |
2 Methods
We perform a series of N-body simulations of single and multiple star clusters in order to investigate effects of close encounters on the orbital configuration of planetary systems in star clusters. Specifically, we focus on typical open clusters, which have characteristics similar to those of the present-day Pleiades, Hyades, and Praesepe (see Table 1 for their physical properties), and embedded clusters (Lada & Lada 2003).
We summarize our models and methods in this study.
- 1.
We consider open clusters with two initial central densities (16 and 1.6 × 10⁴ M⊙ pc−3) and a growing cluster via the merger of subclusters. All these models dynamically evolve to a surface density distribution similar to observed open clusters. We also consider an embedded cluster which has the mass enclosed within ~1 pc of ~100 M⊙ (Lada & Lada 2003).
- 2.
Following the initial mass function (IMF) of stars (Kroupa 2001), we randomly assign stellar masses to individual objects in a star cluster. The IMF extends from 0.08 M⊙ to 15, 10, and 8 M⊙ for open-cluster, merger, and embedded-cluster models, respectively.
- 3.
We numerically calculate the position and velocity of an individual star in a clustered environment. The retention or ejection of a planet orbiting a host star is evaluated semi-analytically based on relative velocities, masses, and impact parameters of intruding stars.
- 4.
We estimate the semi-major axis distribution of planets that survived stellar encounters and the number of produced free-floating planets, where we assume that each star initially has a single planet following the mass-semi-major axis distribution of exoplanets derived from both RV and direct-imaging surveys.
In order to test our methods, we also performed simulations for a Plummer model (Plummer 1911) with a single-mass component of 1 M⊙, which is a model adopted in previous work by Spurzem et al. (2009). In this study, the orbital evolution of both planets and stars were calculated in N-body simulations. We compared our result with theirs and confirm that the results are consistent (see Appendix A for the details).
2.1 Models
We adopt initial conditions which evolve to star clusters similar to Pleiades at 100 Myr and Hyades and Praesepe at 600 Myr. We also model embedded clusters in accordance with a recent hypothesis that open clusters are merger remnants of smaller clusters (Fujii et al. 2012; Sabbi et al. 2012; Fujii & Portegies Zwart 2015; Fujii 2015) in which most of stars were born (Lada & Lada 2003).
2.1.1 Open cluster models
For open cluster models, we adopt King’s model (King 1966) with W0 = 3. We consider two models with different initial core densities: ρc = 1.6 × 10⁴ and 16 M⊙ pc−3 which we hereafter call the two models “w3-hd” (high density) and “w3-ld” (low density), respectively. The core density of open clusters, including three clusters of our interest, is typically 1− 102 M⊙ pc−3 (see Fig. 1). However, some recent studies suggested that open clusters once had a higher core density and then, their core densities decreased to the level as low as those in well-known open clusters via the dynamical evolution (Marks & Kroupa 2012; Fujii & Portegies Zwart 2016). We therefore adopt an initially dense model (model w3-hd) as well as the low density model (model w3-ld). The total mass of these models is 1015 M⊙. We assume that the clusters are initially in virial equilibrium.
The initial density of model w3-hd is comparable to that of young massive clusters such as NGC 3606 with > 6 × 10⁴ M⊙ pc−3 (Harayama et al. 2008). The known densest open cluster in the Milky Way, the Arches cluster, has ~ 105 M⊙ pc−3 (Stolte et al. 2002; Portegies Zwart et al. 2010). Theoretically, Marks & Kroupa (2012) suggested that open clusters initially had a high density, while Parker (2014) claimed that such a high density is not necessary for all open clusters and that subclustered initial conditions fit to the observed open clusters better. In Fig. 2, we present the initial profiles of the surface number density in our open cluster models. For comparison with observations, we show the surface number density rather than the volume density. The core surface density of models w3-hd and w3-ld are 104 and 100 M⊙ pc−2, respectively.
Data from observations.
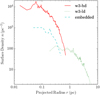 |
Fig. 2 Radial profiles of the initial surface number density in our cluster models. |
2.1.2 Merger models
Recent studies on star cluster formation suggested that open clusters may have grown via mergers of subclusters (Fujii et al. 2012; Sabbi et al. 2012; Fujii & Portegies Zwart 2015) or fractal distribution of stars (Parker et al. 2014; Parker 2014). The existence of multiple clumps has been observed in star forming regions (Cartwright & Whitworth 2004; González & Alfaro 2017). For example, ρ Oph main cloud has six identified clumps, in which pre-stellar cores with dozens of solar masses are included (Motte et al. 1998; Stamatellos et al. 2007). The typical size of the clumps is ~ 0.3 pc and the distance among themis <1 pc. If stars successfully form in each clump, the cluster system likely evolves to the ensemble of embedded clusters. We therefore set up merger models (merger-r1 and -r2) from multiple subclusters (embedded clusters).
We model an embedded cluster with the total mass of 122 M⊙ using a King’s model (King 1966)with W0 = 3. The half-mass and tidal radius are 0.27 and 1 pc, respectively. The initial central density of our embedded cluster model is 2.3 × 10³ M⊙ pc−3. This value is equivalent to the highest density of observed embedded clusters (see Appendix B). The embedded cluster model is also initially in virial equilibrium. Our embedded cluster model is named “embedded” hereafter. All parameters are summarized in Table 2, and the initial surface density profile of model embedded is presented in Fig. 2.
We deploy randomly eight subclusters (model embedded) with zero relative velocity within a sphere with radius of 1 pc or 2 pc for models merger-r1 and merger-r2, respectively. Since merger events occur after the core collapse is triggered inside individual subclusters, both models resemble the so-called “late-merger” ones (Fujii & Portegies Zwart 2013). These merger models have a total mass comparable to those of open-cluster models.
2.1.3 Initial mass function
We randomly assign masses to individual stars irrespective of their initial positions. The stellar population in our cluster models follows Kroupa IMF with a lower mass cut-off of 0.08 M⊙ (Kroupa 2001). The IMF has an upper mass cut-off of 8, 15, and 10 M⊙ for embedded cluster, open cluster, and merger models, respectively. This mass spectrum yields a mean stellar mass of ~ 0.5 M⊙, which is slightly higher than that estimated in observed clusters, 0.36 M⊙ (Weidner & Kroupa 2006).
Weidner & Kroupa (2006) suggested that mmax ~ 30 M⊙ in a star cluster with mass of 103 M⊙. Since the number of star with mass of ~10 M⊙ is expected to be at most unity in open cluster models with N = 2048, we adopt half or one third of their value (10 or 15 M⊙) as the upper cut-off of stellar mass. For embedded cluster model with mass of 102 M⊙, we use a smaller value (8 M⊙) as the upper cut-off of stellar mass. The resulting number of stars for each spectral type (M, K, G, F, A, and B stars) is NM = 1493, NK = 293, NG = 28, NF = 60, NA = 53, and NB = 71 for open cluster models, respectively. The embedded cluster model has NM = 187, NK = 37, NG = 9, NF = 8, NA = 7, and NB = 8. Here, we classify stellar spectral types based on stellar masses: M: 0.08 < m < 0.45, K: 0.45 < m < 0.8, G: 0.8 < m < 1.04, F: 1.04 < m < 1.4, A: 1.4 < m < 2.1, and B: 2.1 < m < 16, where m is the mass of stars in units of M⊙. We note that there is no O-type star in our simulations.
Although we adopted the upper-mass limit for the IMF based on Weidner & Kroupa (2006) in order to avoid the uncertainty of stellar evolution models for massive stars, this assumption may be vulnerable, if more massive stars statistically can form in small clusters. Actually, observations have found low-mass clusters including O-type stars (Lamb et al. 2010) and relatively isolated O-type stars in star forming regions (Bressert et al. 2012). Massive O-type stars can form stellar-mass black holes (Hurley et al. 2000), and they can eject planets from their surrounding stars. While such massive stars and stellar-mass black holes usually stay in the cluster core due to the mass segregation, most of low-mass stars, which mainly host planets, are located in cluster halo. Therefore, the lack of O-type stars in our simulation would not affect much the ejection of planets from low-mass stars.
We assume that the primordial binary population is null, because the planet formation around stars with a companion strongly depends on the orbital parameters and mass ratios of the binary system rather than stellar encounter in star clusters. Observationally, companion frequencies in open clusters are estimated to be ~ 65% for FGK-type stars and ~35% for 0.1–0.5 M⊙ stars (Duchêne & Kraus 2013). Since the typical orbital separation of observed FGK-type binaries is 45 AU (Duchêne & Kraus 2013), it is smaller than typical distances of stellar encounters which are expected to occur in open clusters. Around such binaries, formation processes of circum-binary planets would be suppressed rather than dynamically disrupted. In addition, gravitational binding of these binaries is so strong (i.e., hard binary) that they dynamically behave as a single star with the binary mass to the other stars (Tanikawa & Fukushige 2009). In such a case, the dynamical evolution of star clusters seems not to be much different from that without primordial binaries. Thus, we consider cluster models with no primordial binaries for simplicity.
Simulation models.
2.1.4 Relaxation time
The dynamical evolution of star clusters such as core collapse proceeds on a timescale of the two-body relaxation. The half-mass relaxation time is given as
 (3)
(3)
where N is the number of stars, rh is the half-mass radius, and M is the total mass of the cluster. The Coulomb logarithm is written as ln Λ = ln γN, and γ ~ 0.1 for the cluster with single-mass components (Spitzer 1987).
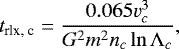
The core-collapse time (tcc) is known to be characterized by the relaxation timescale, specifically, tcc ~ 15–20 trh for single-component clusters (Spitzer 1987). However, mass segregation in multiple mass-component systems accelerates the core collapse. Gürkan et al. (2004) suggested that the relaxation time of the cluster core (trlx, c) rather than the half-mass one can be a good indicator that characterizes the dynamical evolution of star clusters. The core relaxation time is given by
 (4)
(4)
where v is the velocity dispersion, m is the mean stellar mass, n is the number density of stars. The subscript c indicates the value in the core and Λc = γcN. Following the description in Gürkan et al. (2004), we find that γc = 0.015, mnc = ρ0, and vc = σ0, where σ0 follows 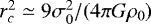 (Giersz & Heggie 1996). Gürkan et al. (2004) suggested that tcc is also scaled by
  , where μ is the mean stellar mass and mmax is the maximum stellar mass. For our models, μ ≃ 2–30. Fujii & Portegies Zwart (2014) found a similar relation that
  . These results give the expected core collapse time 80, 2.5, and 1 Myr for models w3-ld, w3-hd, and embedded, respectively. Models w3-hd and embedded collapse are expected to collapse before the supernova explosion which causes a significant mass loss of the cluster (see Appendix B). The core and the half-mass relaxation times of our models are summarized in Table 2.
2.2 N-body simulations
We perform N-body simulations of stellar dynamics in open clusters, using a sixth-order Hermite scheme with individual time-steps (Nitadori & Makino 2008). We adopt an accuracy parameter η (Nitadori & Makino 2008) of 0.13–0.2, maintaining less than ~0.1% of the energy error of the system throughout the entire simulations, that is 600 Myr for the open cluster models and 170 Myr for the embedded cluster model. Since small clusters are expected to be tidally disrupted within 100 Myr and most of the encounter occurred in the first a few Myr, the dynamical evolution of the embedded cluster is no longer simulated after 170 Myr.
We takeinto account collisions between stars and effects of stellar evolution in the same way as Hurley et al. (2000), assuming the solar metallicity. We adopt a sticky-sphere approach to describe collision events between stars using the zero-age main-sequence (ZAMS) radii of stars (Hurley et al. 2000). We found that collision events between stars rarely happen in our simulations, specifically, a few collisions only in the high-density model. We assume that stars lose their masses at the end of their main-sequence (MS) stages and evolve into compact objects (neutron stars or white dwarfs) with their core masses (see also Appendix B for the details). Most of stars in our cluster models are low-mass objects (M, F, G-type stars) whose lifetimes during the MS stage are over 1 Gyr, and B-type and A-type stars occupy only ~ 6% of stellar components in our cluster models. Consequently, the choice of the stellar metallicity has a minor impact on the dynamical evolution of open clusters discussed in this study.
We ignore the orbital decay and expansion and ejection of planets associated with stellar evolution. As a star evolves from a MS stage to a giant phase, it loses its angular momentum via mass loss driven by a stellar wind. A ram pressure of the stellar wind, however, has little effect on the orbital evolution of planets (e.g., Duncan & Lissauer 1998). Stars with masses of ≲ 2.3 M⊙ undergo thehelium flash at the red-giant branch and their outer envelope expand rapidly. The strong tidal force acted on planets orbiting such evolved stars causes the engulfment of short-period planets by their host stars. Meanwhile, the reduced gravity of an inflated star pushes outer planet outward (e.g., Villaver & Livio 2009; Kunitomo et al. 2011). In fact, the lack of short-period planets, the so-called the period valley, is seen around evolved A-type stars in the field (Johnson et al. 2007; Sato et al. 2008). However, the lifetimes of stars with masses of ≲ 2.3 M⊙ are comparable to or longer than 1 Gyr, namely, our simulation time. Furthermore, the stellar mass loss has non-negligible effects on the stabilityof planetary systems around more massive stars (e.g., Veras et al. 2011; Voyatzis et al. 2013) and multiple star systems (Veras & Tout 2012) in this study. If supernova explosions occur in the aftermath of dying stars, planets can be readily ejected under the severe circumstances (Veras et al. 2011). However, such desperate events can rarely happen in our open cluster models because of the scarcity of O, B-type stars. Any velocity kick is not taken in account during the stellar evolution either.
Since our modeled clusters stay within the Jacobi radius in the Milky Way galaxy, the tidal field of the background galaxy in our simulations is not included. Here, we consider a star cluster with the orbital velocity of Vc = 220 km s−1 near the location of the Sun (~8 kpc) away from the Galactic center. The density within the Jacobi radius in an isothermal halo with a constant circular velocity Vc is written as a function of distance from the Galactic center RG (see Appendix B in Gieles et al. 2011 for the details),
 (5)
(5)
where rJ is the Jacobi radius. Using Eq. (5) and  , we obtain rJ = 14 pc for RG = 8 kpc and M = 103 M⊙ (rJ = 6.6 pc for M = 100 M⊙), where M is the mass enclosed within rJ. Our clusters are initially confined within this Jacobi radius. As the halo of a star cluster expands with time, the outskirts of a cluster halo overflow the Jacobi radii. The stars beyond the Jacobi radius are tidally stripped from the cluster. In our simulations, the fraction of such escaping stars is expected to be less than 10% (see Appendix E for the details).
2.3 Ejection of planets
We identify the ejection of planets in a semi-analytically way, based on the relative velocity, mass, and impact parameter of nearby passing stars. Since it is too computationally expensive to simultaneously simulate the orbital evolution of planets in a dynamically-evolving cluster, we did not integrate the orbits of planets in this study.
We examine the maximum distance at which a planet can dwell in its original habitat after the encounter. Gravitational interactions between a star-planet system and passing objects are approximated by the impulse force, if the separation between a planet and its host star is small enough as compared to the impact parameters of passing stars. This distant-tide approximation is valid for close encounters seen in open clusters.
Analytic approaches given in Binney & Tremaine (2008) allow us to estimate the change in the energy of an individual planetary system per close encounter. The change in the velocity of a star-planet system due to one close encounter of a passing star is givenby
 (6)
(6)
where G is the gravitational constant, Δv is the change in the velocity of the planetary system, M⋆ is the mass of the passing star, V is the relative velocity between the passing star and the planetary system, and b is the impact parameter. The change in the energy per unit mass of the star-planet system, ΔE, due to a close encounter is given by
 (7)
(7)
where ap is the semi-major axis of the planet. Also, the relative energy change of the planetary system is written as
 (8)
(8)
where |E| is the energy of an individual planetary system per unit mass, E = −GMtot∕2ap and Mtot is the total mass of a planetary system, that is the sum of the planet’s and its host star’s mass. Mass ratios of observed planets to their host stars as small as ≲0.01, except for the case of planetary systems around brown dwarfs. The effect of stellar encounters in this study is insensitive to the mass of a planet, that is to say, Mtot ≈ Ms, where Ms is the mass of a planet-hosting star.
We assume that ΔE∕|E| = 1 leads to the orbital disruption of planetary systems. From Eq. (8), we obtain
 (9)
(9)
We measure b and V for each close encounter of the nearest neighbor star. We record the minimum value of  , which is defined as amin. Planetary systems continuously undergo the passage of stars beyond the closest distance. However, the cumulative energy change of an individual planetary system due to weaker encounters is smaller than the energy change caused by the closest encounter. Thus, we consider that planets within amin can survive.
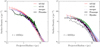 |
Fig. 3 Surface number density profiles as a function of projected radius of open-cluster models at t = 100 Myr (left) and t = 600 Myr (right). Black curves show radial profiles of the surface number of density derived from two-dimensional observational data of stellar positions in the Pleiades (left; solid), Praesepe (right; solid), and Hyades (right; dashed). Error bars indicate the run-to-run variations. |
3 Results
We simulated the dynamical evolution of our open cluster models during ~ 1 Gyr. The embedded cluster model was not calculated after 170 Myr, because it has evolved to a low-density cluster at 170 Myr and then it is expected to be tidally disrupted. We carried out several runs for each cluster model with different random seeds for the positions and velocities of individual particles in order to achieve better statistics: Nrun = 56 for the embedded cluster, Nrun = 20 for open cluster models, and Nrun = 5–6 for the merger models because of their higher calculation costs, in terms of CPU time. Hereafter, errors denote standard deviations of a full set of runs (Nrun).
3.1 Structure of star clusters after dynamical evolution
While model w3-hd experienced core-collapse at a few Myr and the cluster density decreases with time, the core density of model w3-ld did not change much during 1 Gyr (see Appendix D for the time evolution of the core radius and density). The outer region of model w3-ld, however, extended as well as model w3-hd. In merger models, subclusters merged within a few Myr and formed a cluster (see Appendix C for the snapshots). This merger timescale is consistent with previous N-body simulations modeling the formation of open clusters starting from a fractal distribution of stars (Parker et al. 2014).
We calculated the surface density profile of the models using the method of Casertano & Hut (1985), in which the local densities arecalculated from the six nearest neighbors. We estimated the core densities and the core radii of the simulated clusters and observed open clusters; the Pleiades, Hyades, and Praesepe. Figure 3 shows these results at t = 100 and 600 Myr as old as theages of the Pleiades, Hyades, and Praesepe (see Table 1). We also show the surface density profiles of the planet-hosting open clusters in Fig. 3. We measured the core radii of the Pleiades, Hyades, and Praesepe using the stellar positions in the three open clusters from open catalogs provided by VizieR; Stauffer et al. (2007, 2009) for the Pleiades, Kraus & Hillenbrand (2007) for the Hyades, and Röser et al. (2011) and Roeser et al. (2011) for the Praesepe. We obtained the core radius of 1.7, 2.6, and 2.4 pc for the Pleiades, Hyades, and Praesepe, respectively. We note that these values are comparable to those derived from King’s model fitting in previous studies, 1.3–2.1, 3.1, and 0.8–3.5 pc (see Table 1). Thus, we confirmed that the surface density profiles of our cluster models are similar to those of the Pleiades, Hyades, and Praesepe regardless of the initial stellar distributions of the cluster models.
3.2 Ejection rates of planets in star clusters
During each simulation, we recorded the minimum value of  (see Eq. (9)) for each star. We define this value as amin. We assume that planets inside amin can survive, otherwise they are immediately ejected by stellar encounters. Thus, we obtain the rates of stellar encounters as a function of time and the semi-major axis of planets (ap).
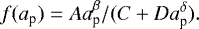
The ejection rates of planets depend on, (1) the semi-major axis of planets, (2) mass of the host star, and (3) elapsed time. Figure 4 shows the ejection rates of planets orbiting each spectral type of star (fejc(ap)) as a function of ap at t = 170 Myr for the embedded cluster and at 600 Myr for the open cluster models. The ejection rate of planets with ap is the cumulative fraction of planets further than amin that are expected to be ejected due to the stellar encounters. As seen in the Fig. 4, the ejection rates of planets within 10 AU is only a few percent for all the models. This fact means that most of exoplanets observed by both RV and transit surveys can survive even in high-density clusters.
We found a power-law function that reproduces the ejection rates of planets around each spectral type of star in each cluster model:
 (10)
(10)
The best-fit parameters for models w3-hd, w3-ld, and embedded are summarized in Table 3. We note that the survival fraction of planets as a function of ap is defined as Fs(ap) = 1 − f(ap) (see Fig. 5 for Fs). Stars in a low-density environment lose only a few percent of their planets, whereas planets at ~ 10 AU (~ 100 AU) are lost around ~10% (the half) of stars in the densest environment. The fraction of surviving planets becomes significantly smaller as the stellar mass increases.
As seen in Fig. 4, the ejection rates of planets depend on the stellar mass. One possible reason for that is the mass segregation. Since individual stars in a star cluster attempt to equalize their kinetic energy with surrounding objects, massive stars lose their energy and sink to the dense cluster center due to the mass segregation. As a result, massive stars such as B- and A-type stars experience close encounters more frequently than low-mass stars do. However, Parker et al. (2016) showed that in open clusters formed from subclusterd initial conditions, massive stars have a velocity dispersion similar to that of low-mass stars. This suggests that mass segregation may not be the only reason for the high ejection rates of planets from massive stars. Another possibility is gravitational focusing. If we assume that the velocity dispersion does not depend on the stellar mass, the encounter timescale for a certain distance is roughly anticorrelated with the planet-hosing star’s mass in the gravitational focusing regime. As is shown in Eq. (2), the close encounter timescale depends on the mass of a planet-hosting star. Thus, stellar encounters closer than ~ 10 AU in typical open clusters should be gravitationally focused (see Eq. (2)).
Figure 6 presents the ejection rates of planets at 10, 100, and 1000 AU around each spectral type of stars at t = 600 Myr for the open cluster models and t = 170 Myr for the embedded cluster model. The ejection rate of planets within 10 AU for B-stars (> 2 M⊙) is roughly an order of magnitude higher than that for M-stars (0.08–0.45 M⊙). This is consistent with the expectation from the gravitational focusing effect. However, the frequency of orbital disruption of planets with ap < 10 AU even aroundB-type stars ends in at most 10%. Planetary systems around low-mass stars such as M dwarfs are stirred up less frequently even in dense open clusters. We confirm that close-in planets within 1 AU can rarely be ejected from any types of stars in open clusters (Davies & Sigurdsson 2001; Bonnell et al. 2001).
The ejection rate of planets increases as the core collapse proceeds in a star cluster. Once the cluster density decreases after the core collapse, the ejection rate of planets saturates. Figure 7 presents the time evolution of the ejection rates of planets with ap > 10, 100, and 1000 AU. Stellar encounter rates initially increase rapidly on the time-scale of their core relaxation time (trlx,c); in the merger case, trlx,c of subclusters. In all the models, most of encounters occur by 10 trlx,c (the verticaldotted lines in Fig. 7). Although our criteria for disruptive encounters of passing stars are simplified, we confirmed that the results are consistent with previous simulations in which both stars and planets are treated as N-body systems (Parker & Quanz 2012); after 10 Myr, 10% of the planets originally orbiting at 30 AU from their host stars became unbound.
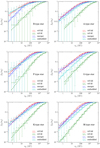 |
Fig. 4 Ejection rates of planet as a function of the semi-major axis of the planet (ap) orbiting each spectral type of star at t = 170 Myr for the embedded-cluster model and at t = 600 Myr for the other models. Error bars indicate run-to-run variations (standard deviations). Dashed curves are the fitting function given by Eq. (10). We classify stellar spectral types according to stellar mass as follows: M: 0.08 < m < 0.45, K: 0.45 < m < 0.8, G: 0.8 < m < 1.04, F: 1.04 < m < 1.4 A: 1.4 < m < 2.1, and B: 2.1 < m < 16, where m is the mass of the (planet-hosting) star in units of M⊙. |
Best-fit parameters for ejection rates of planets
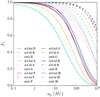 |
Fig. 5 Survival fraction of planets around each spectral type of star as a function of ap (Fs = 1 − f(ap); see Eq. (10)) for w3-hd and w3-ld models at t = 600 Myr and the embedded cluster model at t = 170 Myr. |
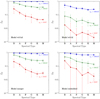 |
Fig. 6 Ejection rates of planets with ap > 10, 100, and 1000 AU around each spectral type of star at t = 600 Myr (170 Myr for embedded clusters). Error bars indicate run-to-run variations (standard deviations). Large error bars in ejection rates of planets around massive stars are attributed to the rarity of massive stars, as seen in the IMF. |
3.3 Planet frequency in open clusters
As shown inthe previous section, the survival rate of planets in open clusters is sufficiently high. On the other hand, a significant fraction of outer planets can be lost by stellar encounters in open clusters, especially in initially dense star clusters. Here, we investigate how the expected planet-semi-major axis distribution in open clusters can be different from the observed one in the field.
Based on the observed planet distribution in the field, we estimate fractions of potentially-surviving planets at 1–10 AU around each spectral type of star in open clusters. Populations of low-mass planets beyond 1 AU are not currently available because of observational difficulties in detecting them. We focus on giant planets with 0.1−13 MJup between 1–10 AU in a single-planet system. We note that this assumption is prone to underestimate occurrence rates of planets. We consider planets orbiting FGKM-type stars because our cluster models contain only one or two A- and B-type stars. We adopt a fitting formula of period distributions of planets with mass in the range of 0.3–10 MJup at 2–2000 days around FGK-type stars published in Cumming et al. (2008):
 (11)
(11)
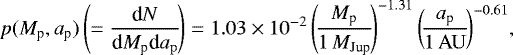
where p is the probability distribution function (PDF), N is the number of planets, and Mp and ap are the planetary mass and semi-major axis. We assume that the mass-period distribution of planets orbiting M-dwarfs are the same power-law function for FGK-type stars as well as Cumming et al. (2008). Following the fact that 10.5% of solar-type stars have a planet with mass of 0.3–10 MJup at 0.03–3 AU (Cumming et al. 2008), we determine a normalization constant of the PDF of inner planets with 0.1 to 13 MJup. Extrapolating Eq. (11) from 0.1 to 13 MJup, we obtain
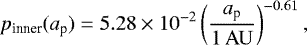 (12)
(12)
for inner planets at 0.03–3 AU. The PDF of the inner planets is shown by the blue line in Fig. 8.
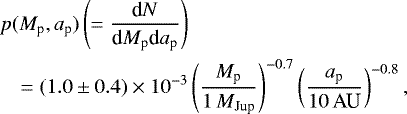
Planets frequency beyond 10 AU is observationally less completed. Recent results of direct-imaging surveys suggest a low frequency of wide-orbit gas planets (Brandt et al. 2014; Galicher et al. 2016; Bowler 2016). Compiling the data of direct imaging surveys by Subaru/HiCIAO (SEEDS), Gemini North/NIRI, and Gemini South/NICI, Brandt et al. (2014) derived a probability distribution of substellar companions (>5 MJup) within ~10–100 AU as a power-law function of semi-major axis and planetary mass whose indices are in agreement with RV results within 1σ (Cumming et al. 2008):
 (13)
(13)
where p is the PDF, and Mp and ap are the planetary mass and semi-major axis, respectively. This PDF indicates that the frequency of distant planets decreases with increasing planetary mass and semi-major-axis. Integrating Eq. (13) from 1 to 13 MJup, we obtain
 (14)
(14)
for planets outer than 10 AU. Note that the observed radial frequencies of inner- and outer-planets are not connected.
In orderto obtain the planet frequency after stellar encounters in star clusters, we assume that, (i) all FGKM-type stars initially has planets between 0.01–100 AU following the planet frequency of Eq. (12) and that (ii) planets can escape at the ejection rates of planets given by Eq. (10). We use the best-fit parameters for ejection rates of planets given in Table 3.
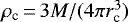
The PDF of planets after stellar encounters in models w3-ld, w3-hd, merger, and embedded, and the results are shown in Fig. 8. We found that stellar encounters change the planet distribution beyond ~ 10 AU; the planet frequency between 10–100 AU after stellar encounters follows  for model w3-hd, which is close to the observed distribution of wide-orbit planets (see Eq. (14)), and
  and
and  for models w3-ld and embedded, respectively. Thus, the planets frequency beyond 10 AU in star clusters can be shaped by stellar encounters.
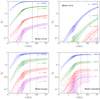 |
Fig. 7 Time evolution of ejection rates (fejc) of planets with ap > 1, 10, 100, and1000 AU. Error bars indicate run-to-run variations (standard deviations). Vertical dotted and dashed lines indicate 100 trlx,c and 10 trlx, respectively. For the merger model, we adopt trlx,c and trlx of the subcluster. |
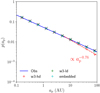 |
Fig. 8 Probability distribution function (PDF) of planets in star clusters (red, green, and cyan crosses are results of models w3-hd, w3-ld, and embedded, respectively. The blue line shows the PDF obtained from observed planets between 0.03 and 3 AU (see Eq. (12)). The red dashed line indicates a power-law distribution following
|

3.4 Occurrence rate of free-floating planets
Recent planet surveys revealed the existence of unbound or free-floating planetary-mass objects (e.g., Zapatero Osorio et al. 2000; Sumi et al. 2011; Delorme et al. 2012; Liu et al. 2013; Mróz et al. 2017). The results obtained by microlensing surveys toward the Galactic Bulge suggest that the frequency of free-floating Jovian planets are ≲ 0.25 planets per main-sequence star (Mróz et al. 2017). Several dynamical processes have been proposed in order to explain the origin of free-floating planets (FFPs) in our Galaxy: planet–planet scattering (Veras & Raymond 2012), direct formation in grobulettes (Gahm et al. 2007; Haworth et al. 2015), and the aftermath of evolved stars such as supernova explosions (Veras & Tout 2012).
In this study, we have shown that stellar encounters in a star cluster can make wide-orbit planets beyond 10 AU gravitationally unbound (see Figs. 6 and 7). We estimate the production rates of free-floating gas giants in star clusters from the ejection rate of planets given by Eq. (10). We suppose gas giants with masses of 1–13 MJup at semi-major axes of 0.01–100 AU. Directly-imaged planets on wide orbits tend to have no sibling, except for HR 8799. Therefore, we do not consider any multiple giant planet systems. We also assume that all FGKM-type stars initially harbor one gas giant planet between 0.01 and 100 AU following  (blue line in Fig. 8). We generate a population of FGKM-type stars following a Kroupa IMF with an upper- and lower-mass cut-off of 0.08 and 2.1 M⊙. We calculated the ejection fraction of planets using the initial distribution of planets given by Eq. (12). We found the production rates of FFPs per FGKM-type star to be 0.184, 0.00960, and 0.0677 for models w3-hd, w3-ld, and embedded.
If most of stars are born in star clusters and the initial core density of the clusters are relatively high, ~ 0.1 FFPs per main-sequence star are produced by stellar encounters. Since the expected frequency of FFPs is compatible with the upper limit on the frequency of FFPs indicated by microlensing surveys (Mróz et al. 2017), stellar encounters in star clusters can be one of promising sources for FFPs in the field. We also estimated the case when planets are distributed between 0.01 and 30 AU. In any cases, the production rate of FFPs per FGKM-star becomes less (see Table 4 for more details).
4 Discussion
4.1 Is the Pleiades a barren land for planets?
A nearby young open cluster, the Pleiades (70–125 Myr, 136 pc; Melis et al. 2014), has the mass, size, and [Fe/H] similar to those of M67 withfive known gas giants (Brucalassi et al. 2017). However, no planet orbiting stars is seen so far in the Pleiades (Yamamoto et al. 2013) with exception for that free-floating planetary-mass candidates (Zapatero Osorio et al. 2014) and a substellar companion to the dusty Pleiades star, HD 23514, were reported (Rodriguez et al. 2012). Light-curve analyses of 1014 Pleiades candidate stars in the Campaign 4 field observed by the Kepler spacecraft in the two-wheel mode, the so-called K2 mission, have recently reported the absence of the planet candidates (Gaidos et al. 2016). These facts invoke three possibilities to explain the deficiency of stars harboring planets in the Pleiades: (i) the Pleiades is a real desert island of planets, (ii) the incompleteness of planet surveys, for example, a short-monitoring time of the K2 mission, and (iii) planets were ejectedfrom host stars in a hostile environment at the early stage or planet-hosting stars ran away from the Pleiades.
We revisit non-detection of planets in the Pleiades open cluster. The Pleiades has a core radius and central density similar to our open cluster models (see also Fig. D.1). Our cluster models suggest that the Pleiades is dynamically mature enough that destructive events of planetary system due to close encounters ceases (see Fig. 7). Distant planets beyond 100 AU are expected to be ejected from their host stars in the Pleiades, while inner planets can survive against frequent stellar encounters. Compared to two planet-hosting clusters, the Hyades and Praesepe, the Pleiades may used to have an initially high stellar density, and therefore the wide-orbit planets in the Pleiades may be depleted more severely than those in the other two clusters. However, there should be no significant differences in the survival rates of close-in planets between the Pleiades and two planet-hosting clusters, even though we assume a high-density cluster model as the initial condition of the Pleiades. Different initial states at the formation stage of open clusters have little effect on the detectability of close-in planets. In addition, since the Pleiades is not a metal-poor environment but a slightly super-solar metallicity. The Pleiades is a favorable site for planet formation, albeit its [Fe/H] is lower than those of the planet-hosting stars in the Hyades and Praesepe (Soderblom et al. 2009). Thus, our results suggest that the Pleiades is a fertile land for planets and that non-detection of planets orbiting stars in the Pleiades could be due to the incompleteness of planet surveys. Nevertheless, if intensive planet surveys in the future failed to find any planets in the Pleiades, planet formation might have been inhibited via some mechanism, which would not have happened in the Hyades and Praesepe.
Production rate of free-floating planets per FGKM-type star.
4.2 Toward planet surveys: detectability of planets in star clusters
Planets within 10 AU around their host stars likely survive over the typical lifetimes of star clusters. In general, massive planets around massive stars are hardly ejected from the system because of their strong gravitational binding. However, massive stars such as B- and A-type stars are not dominant members in both an embedded and an open clusters according to the IMF. Planetary systems around massive stars which fall into dense regions due to the mass segregation also undergo violent encounters with passing stars (see Fig. 6). Provided that production rates of planets in clustered environments are comparable to those in the field, short-period massive planets around Sun-like stars and low-mass stars rather than massive ones are promising targets for planet searches by RV measurements and transit photometry.
Detection efficiency of planets depends on physical properties of a star cluster (mass, age, and [Fe/H]) and the distance from the Earth. A positive correlation between the frequency of giant planets and stellar metallicity indicates that metal-rich clusters are suitable to planet surveys. Star clusters older than the relaxation time (trlx) is dynamically mature and therefore no more close encounters are expected: trlx is typically ~10–100 Myr for low-density open clusters, ~1–10 Myr for high-density open clusters, and ~1 Myr for embedded clusters. Stars in star clusters younger than trlx are in the midst of experiencing close encounters, in other words, a fraction of the planets that are candidates to be free-floaters are still gravitationally bound to their host stars in young clusters. As a result, younger open clusters show higher sensitivity for the detection of planets.
Open clusters may have evolved from denser clusters such as young massive clusters, as shown in Fig. D.1. In the central region of such dense clusters, stars are exposed to violent circumstances in which the detectability of planets should decreases because of enhanced stellar encounters, a strong gas expulsion, intense XUV irradiations from massive stars, frequent and subsequent collisions of stars, and effects of binary systems. In addition, a densely-packed region in a star cluster is often hardly resolved to individual stars within the field of view. Contamination of light from nearby stars obscures signals of planets imprinted in RVs and/or lightcurves of their host stars. High-density, massive clusters would have low priority for planet searches.
The observed occurrence rate of wide-orbit planets beyond 10–100 AU in the field is extremely low, as mentioned before. Such distant planets are supposed to be readily liberated from their host stars (see Fig. 7). Planets are difficult to form (in situ) beyond 10 AU in the core-accretion model because of the slow growth of cores in the outer region. On the other hand, disk instability may happenin a protoplanetary disk around metal-poor (e.g., Cai et al. 2006) and massive stars, and then planets are born beyond ~10 AU from their host stars. In fact, many distant planets are found around metal-poor and/or massive stars3, except for the metal-rich GJ 504 (Kuzuhara et al. 2013). Since massive stars are rarely seen in open clusters, the frequency of planets moving on wide orbits in open clusters is expected to be lower than that in the field.
5 Conclusions
We have performed a series of N-body simulations of star clusters, modeling three open clusters (the Pleiades, Praesepe, and Hyades) and embedded clusters. Stellar encounter rates increase on the core relaxation timescale (trlx, c) in the initial state of a star cluster. Eventually, the close encounters cease at ~ 10 trlx, c: ~ 1 Gyr for initially low-density open clusters and <100 Myr for open clusters which initially had a density higher than those of present-day open clusters. We also considered a merger model in which open clusters form via hierarchical merger of subclusters. In the merger case, stellar encounters increase on a relaxation timescale of the subclusters, and the cumulative encounter rate was comparable to those of the single high-density cluster model.
Using the results of N-body simulations, we semi-analytically estimated the ejection rates of planets due to stellar close encounters in star clusters as a function of the semi-major axis of planets. The results are summarized as follows:
(1) Close-in planets inside 1 AU can be rarely liberated from any types of host stars in open clusters; the ejection fraction of such short-period planets is less than 1.5%. We expect no significant difference between the frequency of short-period planets in open clusters and that in the field. This implies that non-detection of close-in planets in open cluster such as the Pleiades may be due to the incompleteness of planet surveys or suppression of planet formation in clustered environments.
(2) The ejection rate of planets with semi-major axes (ap) of 1–10 AU is at most 7% in our high-density cluster models which initially has a core density higher than typical values of observed open clusters. The ejection rates of planets orbiting more massive stars are higher; up to 29% of planets within 10 AU around B-stars experience orbital disruption. On the other hand, the ejection rate of planets around FGKM-type stars is only a few percent.
3) The ejection rate of planets at 10–100 AU around FGKM-type stars reaches a few tens percent. If we extrapolate the probability distribution function (PDF) of observed giants planets within 10 AU ( ; Cumming et al. 2008) to the outer region beyond 10 AU, we found that the PDF of giant planets beyond 10 AU changes due to close encounters in star clusters;
  for our high-density cluster model.
4) If we assume that each star in a star cluster initially has one planet between 0.01–100 AU based on the observed planet distribution ( ), the production rate of free-floating planet per star is 0.184 and 0.00960 for high- and low-density open cluster models and 0.0677 for embedded cluster models. These values are compatible with the observed fraction of free-floating planets, ≲ 0.25 per main-sequence star (Mróz et al. 2017).
5) Distant planets with ap > 100–1000 AU such as directly-imaged ROXs 42B and DH Tau b can be ejected efficiently via stellar encounters in cluster environments. However, the birthplace of planets are expected to be inside several 10 AU both in the core-accretion model (e.g., Pollack et al. 1996)and in the disk instability scenario (e.g., Boss 1997). This implies that most of planets around FGKM-stars are likely to survive against stellar encounters in open clusters.
Acknowledgements
We thank the referee, Richard Parker, for his useful comments. Y.H. was supported by Grant-in-Aid for JSPS Fellows (No. 25000465) from MEXT of Japan. M.F. was supprted by The University of Tokyo Excellent Young Researcher Program. We thank Timothy D. Brandt for providing us with useful information on distributions of wide-orbit substellar companions derived from imaging surveys. Numerical computations were partially carried out on Cray XC30 (ATERUI) at the Center for Computational Astrophysics (CfCA) of the National Astronomical Observatory of Japan.
Appendix A Plummer model: comparison with Spurzem et al. (2009)
Plummer model with single-mass components.
We show our semi-analytical treatment for ejection of planets is consistent with results of fully N-body simulations.We consider a Plummer model with a single-mass component of 1 M⊙ (Plummer 1911) as a star cluster. This is equivalent to the star cluster model adopted in previous work (Spurzem et al. 2009) in which the orbital evolution of planets was numerically integrated as well as the stellar motions in the star cluster. We adopt the N-body unit (G = M = 4|E| = 1) for the gravitational constant and the total mass and energy of a star cluster, respectively (Hénon 1971; Cohn 1979; Heggie & Mathieu 1986). Assuming that the unit length (R = GM∕4|E|) is 1 pc (Spurzem et al. 2009), the core and half-mass radii are 0.417 and 0.769 pc. We assume that the cluster has the total mass of 1.9 × 10⁴ M⊙. With the number of particles of 1.9 × 10⁴, the central density is 2.2 × 10⁴ M⊙ pc−3.
Spurzem et al. (2009) performed a series of direct N-body simulations of a star cluster containing 19 000 stars with mass of 1 M⊙ up to 0.3–0.9 times half-mass relaxation time (trh), 1000 of which initially have a planet: model 1–6 (ap = 3−50 AU, ep = 0.01, 0.1, 0.3, 0.6, 0.9, and 0.99), model E (ap = 3−50 AU, f(e) = 2e), and model EH (ap = 0.03−5 AU, f(e) = 2e), where ap and ep are the initial semi-major axis and eccentricity of a planet and f(e) = 2e means a thermal eccentricity distribution. They also performed hybrid Monte Carlo (HMC) simulations of a star cluster for models E (soft) and EH (hard), but with an order of magnitude larger number of particles (3.0 × 10⁵ single-mass stars, 3.0 × 10⁴ of which are planet-hosting stars).
We integrated the dynamical evolution of the star cluster up to 230 in N-body unit (24.8 Myr in physical unit), which is comparable to the two-body relaxation time (trlx = 234 in N-body unit; see Eq. (3)). We note that the core-collapse occurs at a later stage for single component models, specifically, ~ 20 trlx, (Spitzer & Hart 1971).
We calculated the probability for a planet within a given distance to liberate from its host star (Pff, rlx) after one relaxation time (230 in N-body units) and found that Pff,rlx are 0.0800 ± 0.0034 and 2.43 ± 0.24 × 10⁻³ for a planet at 12.2 AU (soft) and 0.387 AU (hard), which are the median of 3–50 AU and 0.03–5 AU in log-scale, respectively. According to Spurzem et al. (2009), these results are almost independent of the initial eccentricity distribution of planets (see their Table 3). In Spurzem et al. (2009), Pff, rlx for models E (soft) and EH (hard) models are 0.112 and 2.22 × 10⁻³, respectively. Thus, we confirmed that our ejection rates of planets in a star cluster are in agreement with those of direct N-body simulations (Spurzem et al. 2009).
Appendix B Stellar evolution
We adopt the stellar evolution model of Hurley et al. (2000), simplifying their description: (1) mass loss is included when stars evolve to compact objects such as neutron stars and white dwarfs and (2) stellar evolution starts when the main-sequence phase ends. We assume that all the stars have the solar metallicity. The duration of a main-sequence phase as a function of initial mass of a star is shown in the top panel of Fig. B.1. We present the final mass of a star after stellar evolution ends as a function of initial mass of a star in the bottom panel of Fig. B.1. We use the same mass of a white dwarf as Hurley et al. (2000), while we adopt a neutron star’s mass of 1.36 M⊙ derived from Belczynski et al. (2008) whose model gives the same mass of a white dwarf as Hurley et al. (2000). In our simulations, when stars with masses of ≳2.4 M⊙ evolve by t = 600 Myr, ~ 26% of the mass of a star cluster that has initially ~1000 M⊙ is lost.
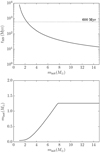 |
Fig. B.1 Duration of a main-sequence phase (top) and the final mass of stars after stellar evolution ends (bottom) in our stellar evolution model. |
Appendix C Evolution of merger models
In this section, we describe the evolution of our merger models. In Figs. C.1 and C.2, we present snapshots for one of models merger-r1 and merger-r2, which initially consist of eight subclusters, at t = 0, 10, 100, and 600 Myr. The subclusters merge within a few Myr and form a cluster. This merger timescale is consistent with that obtained from N-body simulations of star clusters with a similar mass but starting from a fractal initial distribution of stars (Parker et al. 2014). Once the subclusters merged, the cluster density gradually decreases (see Appendix D for the time evolution of the core density). For comparison, we also present the snapshots of one of models w3-hd and w3-ld at 0 and 600 Myr in Figs. C.3 and C.4.
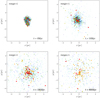 |
Fig. C.1 Snapshots of model merger-r1. Red, orange, yellow, green, blue, and cyan indicate B-, A-, F-, G-, K-, and M-type stars, respectively. |
Appendix D Time evolution of core radius and density
Figure D.1 shows the time evolution of the core radii and central densities of our cluster models as a function of time. We also plot observed open clusters (OC) with mass of 102 < M < 103 M⊙ (Piskunov et al. 2007), embedded clusters (EC; Lada & Lada 2003; Figer 2008; Pfalzner 2009), and young massive clusters (YMC) with ~104 M⊙ (Portegies Zwart et al. 2010). We find that the Pleiades, Praesepe, Hyades clusters, and other planet-hosting star clusters are typical examples of open clusters, as seen in Fig. D.1. The behaviors over a few hundred Myr appear to be similar among all the models, whereas in the earlier phase of dynamical evolution, the central density of the high density model (w3-hd) increases rapidly and monotonously decreases after a few Myr. The central density of model w3-hd is as high as those of YMCs during t ≲ 100 Myr. This impliesthat realtively low-mass YMCs might dynamically evolve to open clusters in the future.
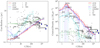 |
Fig. D.1 Time evolution of the core radius (rc) and central density (ρc) for our cluster models. The central density and core radius are averaged over 0.5, 5, 50, and 500 Myr for t < 5 Myr, 5 Myr < t < 50 Myr, 50 Myr < t < 500 Myr, and t > 500 Myr, respectively. The error bars show the run-to-run variations. Each symbol indicates known star clusters near the Solar System: the present-day Pleiades, Praesepe, and Hyades, the other planet-hosting clusters (diamonds: Piskunov et al. 2007), open clusters (OC) with mass of 102 < M < 103 M⊙ (circles: Piskunov et al. 2007), embedded clusters (EC; squares: Lada & Lada 2003; Figer 2008; Pfalzner 2009), and youngmassive clusters (YMC; triangles: Portegies Zwart et al. 2010). Following Pfalzner (2009), we use
|
Our embedded cluster model (embedded) starts from a compact and dense state, evolving quickly to a less dense open cluster at ~ 100 Myr because of the short relaxation time of our embedded cluster This suggests that observed embedded clusters are the ancestors of less massive open clusters.
The merged cluster evolves dynamically in a manner similar to the high-density cluster and achieves a central density higher than those of individual subclusters, which is the embedded cluster model in our study. The merged cluster is therefore dynamicallymore active than single clusters which have a similar initial central density (Fujii & Portegies Zwart 2013). Indeed, the ejection rate of planets in our merger model is as high as that in our high-density single cluster model, although the initial central density of the subclusters is one order of magnitude lower than that of the high-density single model (see Fig. 4).
Appendix E Tidal disruption
In this paper, the tidal disruption of star clusters due to the galactic potential is not included. Stars in the outskirt of a cluster halo are stripped from the cluster due to the tidal effect. In this section, we demonstrate that the tidal effect on dynamical evolution of stars in our star clusters is limited.
For a halo model, we adopt the NFW profile (Navarro et al. 1997) with the concentrate parameter of the halo, c = 10. The mass contained within the virial radius of the halo is 6.0 × 10¹¹ M⊙. The circular speed at 8 kpc away from the Galactic center is 200 km s−1.
We simulated dynamical evolution of stars in a star cluster, including the tidal field of the Galactic halo. Figure E.1 presents projected positions of stars at 600 Myr in a low-density cluster model with the tidal force (w3-ld-tidal: left and middle panels. We see tidal tails of stars along the cluster’s orbit in the left panel of Fig. E.1. Nevertheless, most of stars still stay within the tidal radius (14 pc) denoted by a red circle (see the middle panel in Fig. E.1). For comparison, we also present the snapshot of the same model but without a tidal force (w3-ld: the right panel in Fig. E.1). Although the outskirts of the halo overflow the tidal radius, most of stars remain within the tidal radius.
We compare a radial distribution of stars within the tidal radius between the two models. Figure E.2 shows the surface density profile (left) and cumulative mass (right) as a function of radius for models w3-ld and w3-ld-tidal at 600 Myr. The surface density and the cumulative mass distributions of the cluster halo for the model with the tidal field are slightly lower those for the isolated model, whereas both profiles are similar between the two clusters. We note that about 20% of the initial cluster mass is lost due to the stellar evolution. Although a tidal effect enhances mass loss near the tidal radius, most of the cluster’s mass are still loaded within the tidal radius.
 |
Fig. E.1 Projected positions of stars (black dots) at 600 Myr for models with the tidal force (w3-ld-tidal: left and middle) and without the tidal force (w3-ld: right). The xy ranges for the middle and right panels are the same, while the range for the left panel is larger. Black lines indicate the cluster’s circular orbit at 8 kpc away from the Galactic center, and red circles indicate the tidal radius, 14 pc. |
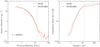 |
Fig. E.2 Surface density profile (left) and cumulative mass distribution form the cluster center (right) for models w3-ld (green dashed curve) and w3-ld-tidal (red solid curve). The cumulative mass distributions are normalized by the initial mass of the cluster. Vertical dotted line indicates the tidal radius (14 pc) at 8 kpc from the Galactic center. The surface density profile are averaged over five snapshots around 600 Myr. |
References
- Adams, J. D., Stauffer, J. R., Skrutskie, M. F., et al. 2002, AJ, 124, 1570 [NASA ADS] [CrossRef] [Google Scholar]
- Adams, F. C., Hollenbach, D., Laughlin, G., & Gorti, U. 2004, ApJ, 611, 360 [NASA ADS] [CrossRef] [Google Scholar]
- Adams, F. C., Proszkow, E. M., Fatuzzo, M., & Myers, P. C. 2006, ApJ, 641, 504 [NASA ADS] [CrossRef] [Google Scholar]
- Allison, R. J., Goodwin, S. P., Parker, R. J., Portegies Zwart, S. F., & de Grijs R. 2010, MNRAS, 407, 1098 [Google Scholar]
- Backer, D. C., Foster, R. S., & Sallmen, S. 1993, Nature, 365, 817 [NASA ADS] [CrossRef] [Google Scholar]
- Bailey, III, J. I., Mateo, M., White, R. J., et al. 2016, AJ, 152, 9 [NASA ADS] [CrossRef] [Google Scholar]
- Belczynski, K., Kalogera, V., Rasio, F. A., et al. 2008, ApJS, 174, 223 [NASA ADS] [CrossRef] [Google Scholar]
- Binney, J., & Tremaine, S. 2008, Galactic Dynamics, 2nd edn. (Princeton: Princeton University Press) [Google Scholar]
- Bonatto, C., & Bica, E. 2005, A&A, 437, 483 [NASA ADS] [CrossRef] [EDP Sciences] [Google Scholar]
- Bonfils, X., Delfosse, X., Udry, S., et al. 2013, A&A, 549, A109 [NASA ADS] [CrossRef] [EDP Sciences] [Google Scholar]
- Bonnell, I. A., Smith, K. W., Davies, M. B., & Horne, K. 2001, MNRAS, 322, 859 [NASA ADS] [CrossRef] [Google Scholar]
- Boss, A. P. 1997, Science, 276, 1836 [NASA ADS] [CrossRef] [Google Scholar]
- Bowler, B. P. 2016, PASP, 128, 102001 [NASA ADS] [CrossRef] [Google Scholar]
- Bramich, D. M., Horne, K., Bond, I. A., et al. 2005, MNRAS, 359, 1096 [NASA ADS] [CrossRef] [Google Scholar]
- Brandt, T. D., Kuzuhara, M., McElwain, M. W., et al. 2014, ApJ, 786, 1 [NASA ADS] [CrossRef] [Google Scholar]
- Breslau, A., Steinhausen, M., Vincke, K., & Pfalzner, S. 2014, A&A, 565, A130 [NASA ADS] [CrossRef] [EDP Sciences] [Google Scholar]
- Bressert, E., Bastian, N., Evans, C. J., et al. 2012, A&A, 542, A49 [NASA ADS] [CrossRef] [EDP Sciences] [Google Scholar]
- Brucalassi, A., Pasquini, L., Saglia, R., et al. 2014, A&A, 561, L9 [NASA ADS] [CrossRef] [EDP Sciences] [Google Scholar]
- Brucalassi, A., Pasquini, L., Saglia, R., et al. 2016, A&A, 592, L1 [NASA ADS] [CrossRef] [EDP Sciences] [Google Scholar]
- Brucalassi, A., Koppenhoefer, J., Saglia, R., et al. 2017, A&A, 603, A85 [NASA ADS] [CrossRef] [EDP Sciences] [Google Scholar]
- Bruntt, H., Grundahl, F., Tingley, B., et al. 2003, A&A, 410, 323 [NASA ADS] [CrossRef] [EDP Sciences] [Google Scholar]
- Burke, C. J., Gaudi, B. S., DePoy, D. L., & Pogge, R. W. 2006, AJ, 132, 210 [NASA ADS] [CrossRef] [Google Scholar]
- Cai, K., Durisen, R. H., Michael, S., et al. 2006, ApJ, 636, L149 [NASA ADS] [CrossRef] [Google Scholar]
- Cai, M. X., Kouwenhoven, M. B. N., Portegies Zwart, S. F., & Spurzem, R. 2017, MNRAS, 470, 4337 [NASA ADS] [CrossRef] [Google Scholar]
- Carpenter, J. M. 2000, AJ, 120, 3139 [NASA ADS] [CrossRef] [Google Scholar]
- Cartwright, A., & Whitworth, A. P. 2004, MNRAS, 348, 589 [NASA ADS] [CrossRef] [Google Scholar]
- Casertano, S., & Hut, P. 1985, ApJ, 298, 80 [Google Scholar]
- Ciardi, D. R., Crossfield, I. J. M., Feinstein, A. D., et al. 2018, AJ, 155, 10 [NASA ADS] [CrossRef] [Google Scholar]
- Cohn, H. 1979, ApJ, 234, 1036 [NASA ADS] [CrossRef] [Google Scholar]
- Converse, J. M., & Stahler, S. W. 2008, ApJ, 678, 431 [NASA ADS] [CrossRef] [Google Scholar]
- Cumming, A., Butler, R. P., Marcy, G. W., et al. 2008, PASP, 120, 531 [CrossRef] [Google Scholar]
- Curtis, J. L., Vanderburg, A., Torres, G., et al. 2018, AJ, 155, 173 [NASA ADS] [CrossRef] [Google Scholar]
- Davies, M. B., & Sigurdsson, S. 2001, MNRAS, 324, 612 [NASA ADS] [CrossRef] [Google Scholar]
- de La Fuente, C., & de La Fuente, R. 1997, A&A, 326, L21 [NASA ADS] [Google Scholar]
- Delgado Mena, E., Lovis, C., Santos, N. C., et al. 2018, A&A, 619, A2 [NASA ADS] [CrossRef] [EDP Sciences] [Google Scholar]
- Delorme, P., Gagné, J., Malo, L., et al. 2012, A&A, 548, A26 [NASA ADS] [CrossRef] [EDP Sciences] [Google Scholar]
- Duchêne, G.,& Kraus, A. 2013, ARA&A, 51, 269 [Google Scholar]
- Duncan, M. J., & Lissauer, J. J. 1998, Icarus, 134, 303 [NASA ADS] [CrossRef] [Google Scholar]
- Ercolano, B., & Clarke, C. J. 2010, MNRAS, 402, 2735 [NASA ADS] [CrossRef] [Google Scholar]
- Errmann, R., Raetz, S., Kitze, M., Neuhäuser, R., & the YETI team. 2014a, ArXiv e-prints [arXiv:1403.6031] [Google Scholar]
- Errmann, R., Torres, G., Schmidt, T. O. B., et al. 2014b, Astron. Nachr., 335, 345 [NASA ADS] [CrossRef] [Google Scholar]
- Figer, D. F. 2008, IAU Symp., 250, 247 [NASA ADS] [Google Scholar]
- Fischer, D. A., & Valenti, J. 2005, ApJ, 622, 1102 [NASA ADS] [CrossRef] [Google Scholar]
- Fujii, M. S. 2015, PASJ, 67, 59 [NASA ADS] [CrossRef] [Google Scholar]
- Fujii, M. S., & Portegies Zwart, S. 2013, MNRAS, 430, 1018 [Google Scholar]
- Fujii, M. S., & Portegies Zwart, S. 2014, MNRAS, 439, 1003 [NASA ADS] [CrossRef] [Google Scholar]
- Fujii, M. S., & Portegies Zwart, S. 2015, MNRAS, 449, 726 [NASA ADS] [CrossRef] [Google Scholar]
- Fujii, M. S., & Portegies Zwart, S. 2016, ApJ, 817, 4 [NASA ADS] [CrossRef] [Google Scholar]
- Fujii, M. S., Saitoh, T. R., & Portegies Zwart, S. F. 2012, ApJ, 753, 85 [NASA ADS] [CrossRef] [Google Scholar]
- Gahm, G. F., Grenman, T., Fredriksson, S., & Kristen, H. 2007, AJ, 133, 1795 [NASA ADS] [CrossRef] [Google Scholar]
- Gaidos, E., Mann, A. W., Kraus, A. L., & Ireland, M. 2016, MNRAS, 457, 2877 [NASA ADS] [CrossRef] [Google Scholar]
- Galicher, R., Marois, C., Macintosh, B., et al. 2016, A&A, 594, A63 [NASA ADS] [CrossRef] [EDP Sciences] [Google Scholar]
- Gieles, M., Heggie, D. C., & Zhao, H. 2011, MNRAS, 413, 2509 [NASA ADS] [CrossRef] [Google Scholar]
- Giersz, M., & Heggie, D. C. 1996, MNRAS, 279, 1037 [NASA ADS] [Google Scholar]
- Gilliland, R. L., Brown, T. M., Guhathakurta, P., et al. 2000, ApJ, 545, L47 [NASA ADS] [CrossRef] [Google Scholar]
- González, M., & Alfaro, E. J. 2017, MNRAS, 465, 1889 [NASA ADS] [CrossRef] [Google Scholar]
- Gürkan, M. A., Freitag, M., & Rasio, F. A. 2004, ApJ, 604, 632 [NASA ADS] [CrossRef] [Google Scholar]
- Hao, W., Kouwenhoven, M. B. N., & Spurzem, R. 2013, MNRAS, 433, 867 [NASA ADS] [CrossRef] [Google Scholar]
- Harayama, Y., Eisenhauer, F., & Martins, F. 2008, ApJ, 675, 1319 [NASA ADS] [CrossRef] [Google Scholar]
- Hartman, J. D., Gaudi, B. S., Holman, M. J., et al. 2009, ApJ, 695, 336 [NASA ADS] [CrossRef] [Google Scholar]
- Haworth, T. J., Facchini, S., & Clarke, C. J. 2015, MNRAS, 446, 1098 [NASA ADS] [CrossRef] [Google Scholar]
- Heggie, D. C., & Mathieu, R. D. 1986, The Use of Supercomputers in Stellar Dynamics, in Lecture Notes in Physics, eds. P. Hut & S. L. W. McMillan, (Berlin: Springer Verlag), 267, 233 [NASA ADS] [CrossRef] [Google Scholar]
- Hénon, M. H. 1971, Ap&SS, 14, 151 [NASA ADS] [CrossRef] [Google Scholar]
- Hidas, M. G., Ashley, M. C. B., Webb, J. K., et al. 2005, MNRAS, 360, 703 [NASA ADS] [CrossRef] [Google Scholar]
- Hood, B., Collier Cameron, A., Kane, S. R., et al. 2005, MNRAS, 360, 791 [NASA ADS] [CrossRef] [Google Scholar]
- Hurley, J. R., & Shara, M. M. 2002, ApJ, 565, 1251 [NASA ADS] [CrossRef] [Google Scholar]
- Hurley, J. R., Pols, O. R., & Tout, C. A. 2000, MNRAS, 315, 543 [NASA ADS] [CrossRef] [Google Scholar]
- Johnson, J. A., Fischer, D. A., Marcy, G. W., et al. 2007, ApJ, 665, 785 [NASA ADS] [CrossRef] [Google Scholar]
- Johnson, J. A., Aller, K. M., Howard, A. W., & Crepp, J. R. 2010a, PASP, 122, 905 [NASA ADS] [CrossRef] [Google Scholar]
- Johnson, J. A., Bowler, B. P., Howard, A. W., et al. 2010b, ApJ, 721, L153 [NASA ADS] [CrossRef] [Google Scholar]
- King, I. R. 1966, AJ, 71, 64 [Google Scholar]
- Kraus, A. L., & Hillenbrand, L. A. 2007, AJ, 134, 2340 [NASA ADS] [CrossRef] [Google Scholar]
- Kroupa, P. 2001, MNRAS, 322, 231 [NASA ADS] [CrossRef] [Google Scholar]
- Kunitomo, M., Ikoma, M., Sato, B., Katsuta, Y., & Ida, S. 2011, ApJ, 737, 66 [NASA ADS] [CrossRef] [Google Scholar]
- Kuzuhara, M., Tamura, M., Kudo, T., et al. 2013, ApJ, 774, 11 [NASA ADS] [CrossRef] [Google Scholar]
- Lada, C. J., & Lada, E. A. 2003, ARA&A, 41, 57 [NASA ADS] [CrossRef] [Google Scholar]
- Lada, E. A., Strom, K. M., & Myers, P. C. 1993, in Protostars and Planets III, eds. E. H. Levy & J. I. Lunine (Tucson: University of Arizona Press), 245 [Google Scholar]
- Lamb, J. B., Oey, M. S., Werk, J. K., & Ingleby, L. D. 2010, ApJ, 725, 1886 [NASA ADS] [CrossRef] [Google Scholar]
- Laughlin, G., & Adams, F. C. 1998, ApJ, 508, L171 [NASA ADS] [CrossRef] [Google Scholar]
- Liu, M. C., Magnier, E. A., Deacon, N. R., et al. 2013, ApJ, 777, L20 [NASA ADS] [CrossRef] [Google Scholar]
- Livingston, J. H., Dai, F., Hirano, T., et al. 2018, AJ, 155, 115 [NASA ADS] [CrossRef] [Google Scholar]
- Livingston, J. H., Dai, F., Hirano, T., et al. 2019, MNRAS, 484, 8 [NASA ADS] [CrossRef] [Google Scholar]
- Lovis, C., & Mayor, M. 2007, A&A, 472, 657 [NASA ADS] [CrossRef] [EDP Sciences] [Google Scholar]
- Malavolta, L., Nascimbeni, V., Piotto, G., et al. 2016, A&A, 588, A118 [NASA ADS] [CrossRef] [EDP Sciences] [Google Scholar]
- Mann, A. W., Gaidos, E., Mace, G. N., et al. 2016, ApJ, 818, 46 [NASA ADS] [CrossRef] [Google Scholar]
- Mann, A. W., Gaidos, E., Vanderburg, A., et al. 2017, AJ, 153, 64 [Google Scholar]
- Mann, A. W., Vanderburg, A., Rizzuto, A. C., et al. 2018, AJ, 155, 4 [NASA ADS] [CrossRef] [Google Scholar]
- Marks, M., & Kroupa, P. 2012, A&A, 543, A8 [NASA ADS] [CrossRef] [EDP Sciences] [Google Scholar]
- Mayor, M., Marmier, M., Lovis, C., et al. 2011, ArXiv e-prints [arXiv:1109.2497] [Google Scholar]
- Meibom, S., Andersen, J., & Nordström, B. 2002, A&A, 386, 187 [NASA ADS] [CrossRef] [EDP Sciences] [Google Scholar]
- Meibom, S., Torres, G., Fressin, F., et al. 2013, Nature, 499, 55 [NASA ADS] [CrossRef] [Google Scholar]
- Melis, C., Reid, M. J., Mioduszewski, A. J., Stauffer, J. R., & Bower, G. C. 2014, Science, 345, 1029 [NASA ADS] [CrossRef] [PubMed] [Google Scholar]
- Miller, A. A., Irwin, J., Aigrain, S., Hodgkin, S., & Hebb, L. 2008, MNRAS, 387, 349 [NASA ADS] [CrossRef] [Google Scholar]
- Mochejska, B. J., Stanek, K. Z., Sasselov, D. D., et al. 2005, AJ, 129, 2856 [NASA ADS] [CrossRef] [Google Scholar]
- Mochejska, B. J., Stanek, K. Z., Sasselov, D. D., et al. 2006, AJ, 131, 1090 [NASA ADS] [CrossRef] [Google Scholar]
- Montalto, M., Piotto, G., Desidera, S., et al. 2007, A&A, 470, 1137 [NASA ADS] [CrossRef] [EDP Sciences] [Google Scholar]
- Montalto, M., Villanova, S., Koppenhoefer, J., et al. 2011, A&A, 535, A39 [NASA ADS] [CrossRef] [EDP Sciences] [Google Scholar]
- Motte, F., Andre, P., & Neri, R. 1998, A&A, 336, 150 [NASA ADS] [Google Scholar]
- Mróz, P., Udalski, A., Skowron, J., et al. 2017, Nature, 548, 183 [NASA ADS] [CrossRef] [Google Scholar]
- Nascimbeni, V., Bedin, L. R., Piotto, G., De Marchi, F., & Rich, R. M. 2012, A&A, 541, A144 [NASA ADS] [CrossRef] [EDP Sciences] [Google Scholar]
- Navarro, J. F., Frenk, C. S., & White, S. D. M. 1997, ApJ, 490, 493 [NASA ADS] [CrossRef] [Google Scholar]
- Nitadori, K., & Makino, J. 2008, New Astron., 13, 498 [NASA ADS] [CrossRef] [Google Scholar]
- Obermeier, C., Henning, T., Schlieder, J. E., et al. 2016, AJ, 152, 223 [NASA ADS] [CrossRef] [Google Scholar]
- Pacucci, F., Ferrara, A., & D’Onghia, E. 2013, ApJ, 778, L42 [NASA ADS] [CrossRef] [Google Scholar]
- Parker, R. J. 2014, MNRAS, 445, 4037 [NASA ADS] [CrossRef] [Google Scholar]
- Parker, R. J., & Quanz, S. P. 2012, MNRAS, 419, 2448 [NASA ADS] [CrossRef] [Google Scholar]
- Parker, R. J., Wright, N. J., Goodwin, S. P., & Meyer, M. R. 2014, MNRAS, 438, 620 [NASA ADS] [CrossRef] [Google Scholar]
- Parker, R. J., Goodwin, S. P., Wright, N. J., Meyer, M. R., & Quanz, S. P. 2016, MNRAS, 459, L119 [NASA ADS] [CrossRef] [EDP Sciences] [Google Scholar]
- Pepper, J., Stanek, K. Z., Pogge, R. W., et al. 2008, AJ, 135, 907 [NASA ADS] [CrossRef] [Google Scholar]
- Pepper, J., Gillen, E., Parviainen, H., et al. 2017, AJ, 153, 177 [NASA ADS] [CrossRef] [Google Scholar]
- Pfalzner, S. 2009, A&A, 498, L37 [NASA ADS] [CrossRef] [EDP Sciences] [Google Scholar]
- Piskunov, A. E., Schilbach, E., Kharchenko, N. V., Roeser, S., & Scholz, R.-D. 2007, VizieR Online Data Catalog: J/A+A/346/151 [Google Scholar]
- Plummer, H. C. 1911, MNRAS, 71, 460 [CrossRef] [Google Scholar]
- Pollack, J. B., Hubickyj, O., Bodenheimer, P., et al. 1996, Icarus, 124, 62 [NASA ADS] [CrossRef] [Google Scholar]
- Portegies Zwart S. F. 2016, MNRAS, 457, 313 [NASA ADS] [CrossRef] [Google Scholar]
- Portegies Zwart, S. F., McMillan, S. L. W., & Gieles, M. 2010, ARA&A, 48, 431 [NASA ADS] [CrossRef] [Google Scholar]
- Quinn, S. N., White, R. J., Latham, D. W., et al. 2012, ApJ, 756, L33 [NASA ADS] [CrossRef] [Google Scholar]
- Quinn, S. N., White, R. J., Latham, D. W., et al. 2014, ApJ, 787, 27 [NASA ADS] [CrossRef] [Google Scholar]
- Raboud, D., & Mermilliod, J.-C. 1998, A&A, 329, 101 [NASA ADS] [Google Scholar]
- Rizzuto, A. C., Vanderburg, A., Mann, A. W., et al. 2018, AJ, 156, 195 [NASA ADS] [CrossRef] [Google Scholar]
- Rodriguez, D. R., Marois, C., Zuckerman, B., Macintosh, B., & Melis, C. 2012, ApJ, 748, 30 [NASA ADS] [CrossRef] [Google Scholar]
- Roeser, S., Schilbach, E., Piskunov, A. E., Kharchenko, N. V., & Scholz, R.-D. 2011, VizieR Online Data Catalog: J/A+A/353/092 [Google Scholar]
- Röser, S., Schilbach, E., Piskunov, A. E., Kharchenko, N. V., & Scholz, R.-D. 2011, A&A, 531, A92 [NASA ADS] [CrossRef] [EDP Sciences] [Google Scholar]
- Rosvick, J. M., & Robb, R. 2006, AJ, 132, 2309 [NASA ADS] [CrossRef] [Google Scholar]
- Sabbi, E., Lennon, D. J., Gieles, M., et al. 2012, ApJ, 754, L37 [NASA ADS] [CrossRef] [Google Scholar]
- Sato, B., Izumiura, H., Toyota, E., et al. 2007, ApJ, 661, 527 [NASA ADS] [CrossRef] [Google Scholar]
- Sato, B., Toyota, E., Omiya, M., et al. 2008, PASJ, 60, 1317 [NASA ADS] [Google Scholar]
- Shara, M. M., Hurley, J. R., & Mardling, R. A. 2016, ApJ, 816, 59 [NASA ADS] [CrossRef] [Google Scholar]
- Smith, K. W.,& Bonnell, I. A. 2001, MNRAS, 322, L1 [NASA ADS] [CrossRef] [Google Scholar]
- Soderblom, D. R., Laskar, T., Valenti, J. A., Stauffer, J. R., & Rebull, L. M. 2009, AJ, 138, 1292 [NASA ADS] [CrossRef] [Google Scholar]
- Spitzer, L. 1987, Dynamical Evolution of Globular Clusters (Princeton: Princeton University Press) [Google Scholar]
- Spitzer, L. J., & Hart, M. H. 1971, ApJ, 164, 399 [NASA ADS] [CrossRef] [Google Scholar]
- Spurzem, R., Giersz, M., Heggie, D. C., & Lin, D. N. C. 2009, ApJ, 697, 458 [NASA ADS] [CrossRef] [Google Scholar]
- Stamatellos, D., Whitworth, A. P., & Ward-Thompson, D. 2007, MNRAS, 379, 1390 [NASA ADS] [CrossRef] [Google Scholar]
- Stauffer, J. R., Hartmann, L. W., Fazio, G. G., et al. 2007, ApJS, 172, 663 [NASA ADS] [CrossRef] [Google Scholar]
- Stauffer, J. R., Hartmann, L. W., Fazio, G. G., et al. 2009, VizieR Online Data Catalog: J/A+A/217/663 [Google Scholar]
- Stolte, A., Grebel, E. K., Brandner, W., & Figer, D. F. 2002, A&A, 394, 459 [NASA ADS] [CrossRef] [EDP Sciences] [Google Scholar]
- Street, R. A., Horne, K., Lister, T. A., et al. 2003, MNRAS, 340, 1287 [NASA ADS] [CrossRef] [Google Scholar]
- Sumi, T., Kamiya, K., Bennett, D. P., et al. 2011, Nature, 473, 349 [NASA ADS] [CrossRef] [PubMed] [Google Scholar]
- Tanikawa, A., & Fukushige, T. 2009, PASJ, 61, 721 [NASA ADS] [CrossRef] [Google Scholar]
- van Leeuwen, F. 2009, A&A, 497, 209 [NASA ADS] [CrossRef] [EDP Sciences] [Google Scholar]
- van Saders, J. L., & Gaudi, B. S. 2011, ApJ, 729, 63 [NASA ADS] [CrossRef] [Google Scholar]
- Veras, D., & Raymond, S. N. 2012, MNRAS, 421, L117 [NASA ADS] [CrossRef] [Google Scholar]
- Veras, D., & Tout, C. A. 2012, MNRAS, 422, 1648 [NASA ADS] [CrossRef] [Google Scholar]
- Veras, D., Wyatt, M. C., Mustill, A. J., Bonsor, A., & Eldridge, J. J. 2011, MNRAS, 417, 2104 [Google Scholar]
- Villaver, E., & Livio, M. 2009, ApJ, 705, L81 [NASA ADS] [CrossRef] [Google Scholar]
- Vincke, K., & Pfalzner, S. 2016, ApJ, 828, 48 [NASA ADS] [CrossRef] [Google Scholar]
- Vincke, K., & Pfalzner, S. 2018, ApJ, 868, 1 [NASA ADS] [CrossRef] [Google Scholar]
- Vincke, K., Breslau, A., & Pfalzner, S. 2015, A&A, 577, A115 [NASA ADS] [CrossRef] [EDP Sciences] [Google Scholar]
- von Braun, K., Lee, B. L., Seager, S., et al. 2005, PASP, 117, 141 [NASA ADS] [CrossRef] [Google Scholar]
- Voyatzis, G., Hadjidemetriou, J. D., Veras, D., & Varvoglis, H. 2013, MNRAS, 430, 3383 [NASA ADS] [CrossRef] [Google Scholar]
- Weidner, C., & Kroupa, P. 2006, MNRAS, 365, 1333 [NASA ADS] [CrossRef] [Google Scholar]
- Weldrake, D. T. F., Sackett, P. D., & Bridges, T. J. 2008, ApJ, 674, 1117 [NASA ADS] [CrossRef] [Google Scholar]
- Winter, A. J., Clarke, C. J., Rosotti, G., et al. 2018, MNRAS, 478, 2700 [NASA ADS] [CrossRef] [Google Scholar]
- Yamamoto, K., Matsuo, T., Shibai, H., et al. 2013, PASJ, 65, 90 [NASA ADS] [Google Scholar]
- Yasui, C., Kobayashi, N., Tokunaga, A. T., Saito, M., & Tokoku, C. 2010, ApJ, 723, L113 [NASA ADS] [CrossRef] [Google Scholar]
- Zapatero Osorio, M. R., Béjar, V. J. S., Martín, E. L., et al. 2000, Science, 290, 103 [NASA ADS] [CrossRef] [PubMed] [Google Scholar]
- Zapatero Osorio, M. R., Gálvez Ortiz, M. C., Bihain, G., et al. 2014, A&A, 568, A77 [NASA ADS] [CrossRef] [EDP Sciences] [Google Scholar]
- Zheng, X., Kouwenhoven, M. B. N., & Wang, L. 2015, MNRAS, 453, 2759 [NASA ADS] [CrossRef] [Google Scholar]
With the exception of the pulsar planet, PSR B1620-26b in a globular cluster M4 (Backer et al. 1993), photometric surveys in three mature globular clusters, NGC 6397, ω Centauri, and 47 Tucanae, have failed to find close-in gas giants (Gilliland et al. 2000; Weldrake et al. 2008; Nascimbeni et al. 2012). The frequency of hot Jupiters is less than several percentages around various stars: M-type (Bonfils et al. 2013), F, G, K-type (e.g., Mayor et al. 2011), and (evolved) A-type stars (Johnson et al. 2010b). Non-detection of hot Jupiters that can survive in the three globular clusters might imply that planet formation can be inhibited in a metal-poor environment and/or in the presence of massive stars, for example, due to intense stellar XUV irradiations.
All Tables
All Figures
|
Fig. 1 Relationship between central densities of open clusters (ρc) and their ages (tage). The data are from Lada & Lada (2003) for left-pointing triangles, Bonatto & Bica (2005) for down-pointing triangles, and Piskunov et al. (2007) and Meibom et al. (2002) for circles and red diamonds (planet-harboring clusters). Each color represents the total mass of each open cluster: blue (100–300 M⊙), green (300–600 M⊙), and pink (600–1000 M⊙). Our target clusters and planet-harboring clusters are shown by filled black squares and red diamonds, respectively. |
| In the text | |
|
Fig. 2 Radial profiles of the initial surface number density in our cluster models. |
| In the text | |
|
Fig. 3 Surface number density profiles as a function of projected radius of open-cluster models at t = 100 Myr (left) and t = 600 Myr (right). Black curves show radial profiles of the surface number of density derived from two-dimensional observational data of stellar positions in the Pleiades (left; solid), Praesepe (right; solid), and Hyades (right; dashed). Error bars indicate the run-to-run variations. |
| In the text | |
|
Fig. 4 Ejection rates of planet as a function of the semi-major axis of the planet (ap) orbiting each spectral type of star at t = 170 Myr for the embedded-cluster model and at t = 600 Myr for the other models. Error bars indicate run-to-run variations (standard deviations). Dashed curves are the fitting function given by Eq. (10). We classify stellar spectral types according to stellar mass as follows: M: 0.08 < m < 0.45, K: 0.45 < m < 0.8, G: 0.8 < m < 1.04, F: 1.04 < m < 1.4 A: 1.4 < m < 2.1, and B: 2.1 < m < 16, where m is the mass of the (planet-hosting) star in units of M⊙. |
| In the text | |
|
Fig. 5 Survival fraction of planets around each spectral type of star as a function of ap (Fs = 1 − f(ap); see Eq. (10)) for w3-hd and w3-ld models at t = 600 Myr and the embedded cluster model at t = 170 Myr. |
| In the text | |
|
Fig. 6 Ejection rates of planets with ap > 10, 100, and 1000 AU around each spectral type of star at t = 600 Myr (170 Myr for embedded clusters). Error bars indicate run-to-run variations (standard deviations). Large error bars in ejection rates of planets around massive stars are attributed to the rarity of massive stars, as seen in the IMF. |
| In the text | |
|
Fig. 7 Time evolution of ejection rates (fejc) of planets with ap > 1, 10, 100, and1000 AU. Error bars indicate run-to-run variations (standard deviations). Vertical dotted and dashed lines indicate 100 trlx,c and 10 trlx, respectively. For the merger model, we adopt trlx,c and trlx of the subcluster. |
| In the text | |
|
Fig. 8 Probability distribution function (PDF) of planets in star clusters (red, green, and cyan crosses are results of models w3-hd, w3-ld, and embedded, respectively. The blue line shows the PDF obtained from observed planets between 0.03 and 3 AU (see Eq. (12)). The red dashed line indicates a power-law distribution following
|
| In the text | |
|
Fig. B.1 Duration of a main-sequence phase (top) and the final mass of stars after stellar evolution ends (bottom) in our stellar evolution model. |
| In the text | |
|
Fig. C.1 Snapshots of model merger-r1. Red, orange, yellow, green, blue, and cyan indicate B-, A-, F-, G-, K-, and M-type stars, respectively. |
| In the text | |
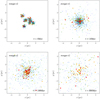 |
Fig. C.2 Same as Fig. C.1 but for model merger-r2. |
| In the text | |
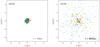 |
Fig. C.3 Same as Fig. C.1 but for model w3-hd at 0 and 600 Myr. |
| In the text | |
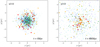 |
Fig. C.4 Same as Fig. C.3 but for model w3-ld. |
| In the text | |
|
Fig. D.1 Time evolution of the core radius (rc) and central density (ρc) for our cluster models. The central density and core radius are averaged over 0.5, 5, 50, and 500 Myr for t < 5 Myr, 5 Myr < t < 50 Myr, 50 Myr < t < 500 Myr, and t > 500 Myr, respectively. The error bars show the run-to-run variations. Each symbol indicates known star clusters near the Solar System: the present-day Pleiades, Praesepe, and Hyades, the other planet-hosting clusters (diamonds: Piskunov et al. 2007), open clusters (OC) with mass of 102 < M < 103 M⊙ (circles: Piskunov et al. 2007), embedded clusters (EC; squares: Lada & Lada 2003; Figer 2008; Pfalzner 2009), and youngmassive clusters (YMC; triangles: Portegies Zwart et al. 2010). Following Pfalzner (2009), we use
|
| In the text | |
|
Fig. E.1 Projected positions of stars (black dots) at 600 Myr for models with the tidal force (w3-ld-tidal: left and middle) and without the tidal force (w3-ld: right). The xy ranges for the middle and right panels are the same, while the range for the left panel is larger. Black lines indicate the cluster’s circular orbit at 8 kpc away from the Galactic center, and red circles indicate the tidal radius, 14 pc. |
| In the text | |
|
Fig. E.2 Surface density profile (left) and cumulative mass distribution form the cluster center (right) for models w3-ld (green dashed curve) and w3-ld-tidal (red solid curve). The cumulative mass distributions are normalized by the initial mass of the cluster. Vertical dotted line indicates the tidal radius (14 pc) at 8 kpc from the Galactic center. The surface density profile are averaged over five snapshots around 600 Myr. |
| In the text | |
Current usage metrics show cumulative count of Article Views (full-text article views including HTML views, PDF and ePub downloads, according to the available data) and Abstracts Views on Vision4Press platform.
Data correspond to usage on the plateform after 2015. The current usage metrics is available 48-96 hours after online publication and is updated daily on week days.
Initial download of the metrics may take a while.