Fig. 8
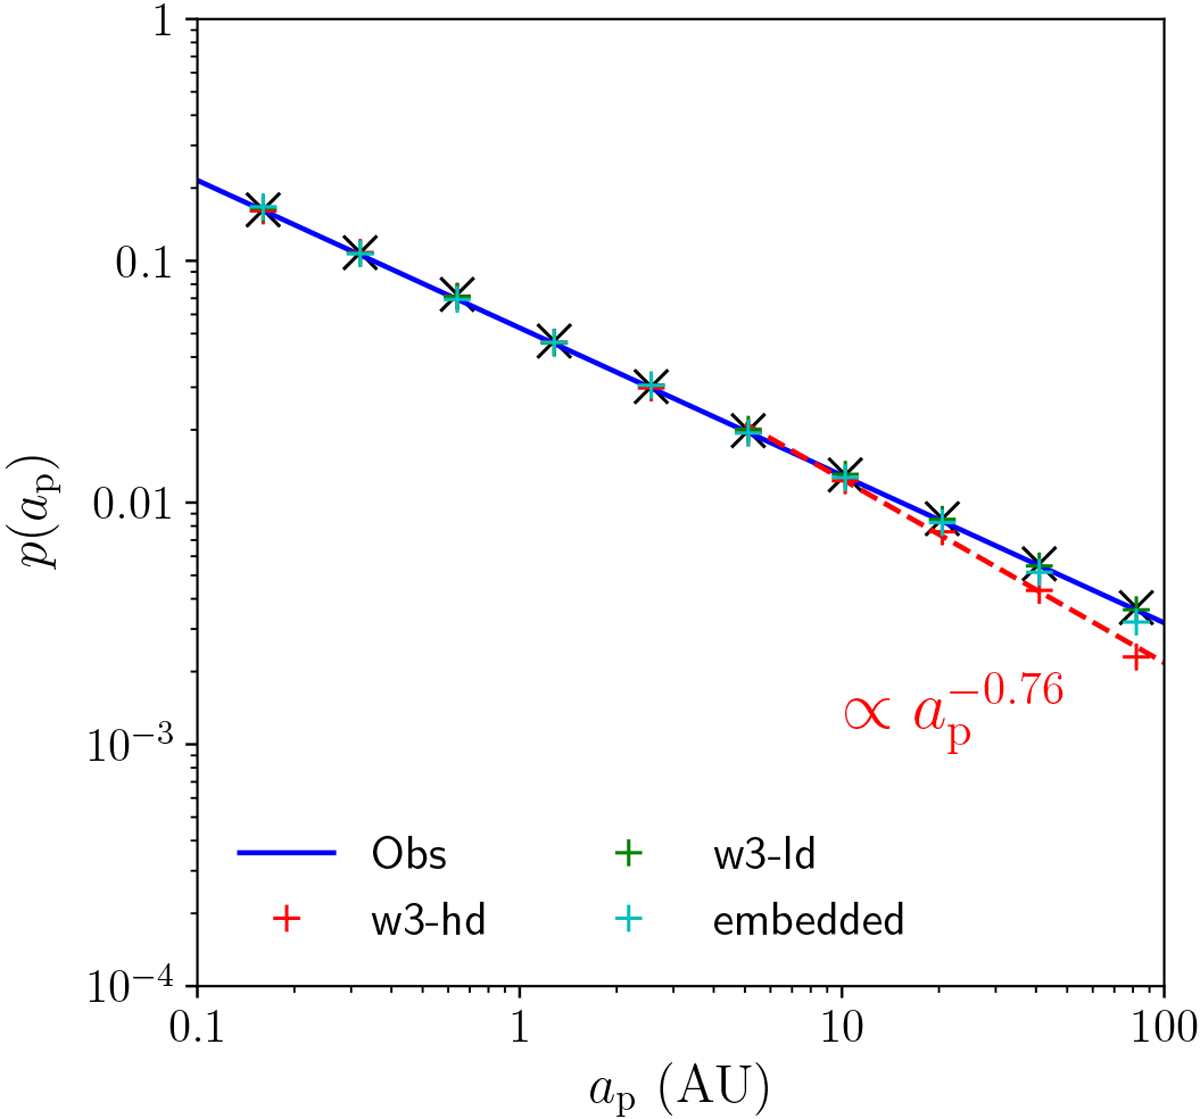
Probability distribution function (PDF) of planets in star clusters (red, green, and cyan crosses are results of models w3-hd, w3-ld, and embedded, respectively. The blue line shows the PDF obtained from observed planets between 0.03 and 3 AU (see Eq. (12)). The red dashed line indicates a power-law distribution following
![]() , which is obtained from a fitting to model w3-hd for 10–100 AU.
, which is obtained from a fitting to model w3-hd for 10–100 AU.
Current usage metrics show cumulative count of Article Views (full-text article views including HTML views, PDF and ePub downloads, according to the available data) and Abstracts Views on Vision4Press platform.
Data correspond to usage on the plateform after 2015. The current usage metrics is available 48-96 hours after online publication and is updated daily on week days.
Initial download of the metrics may take a while.