Fig. 4
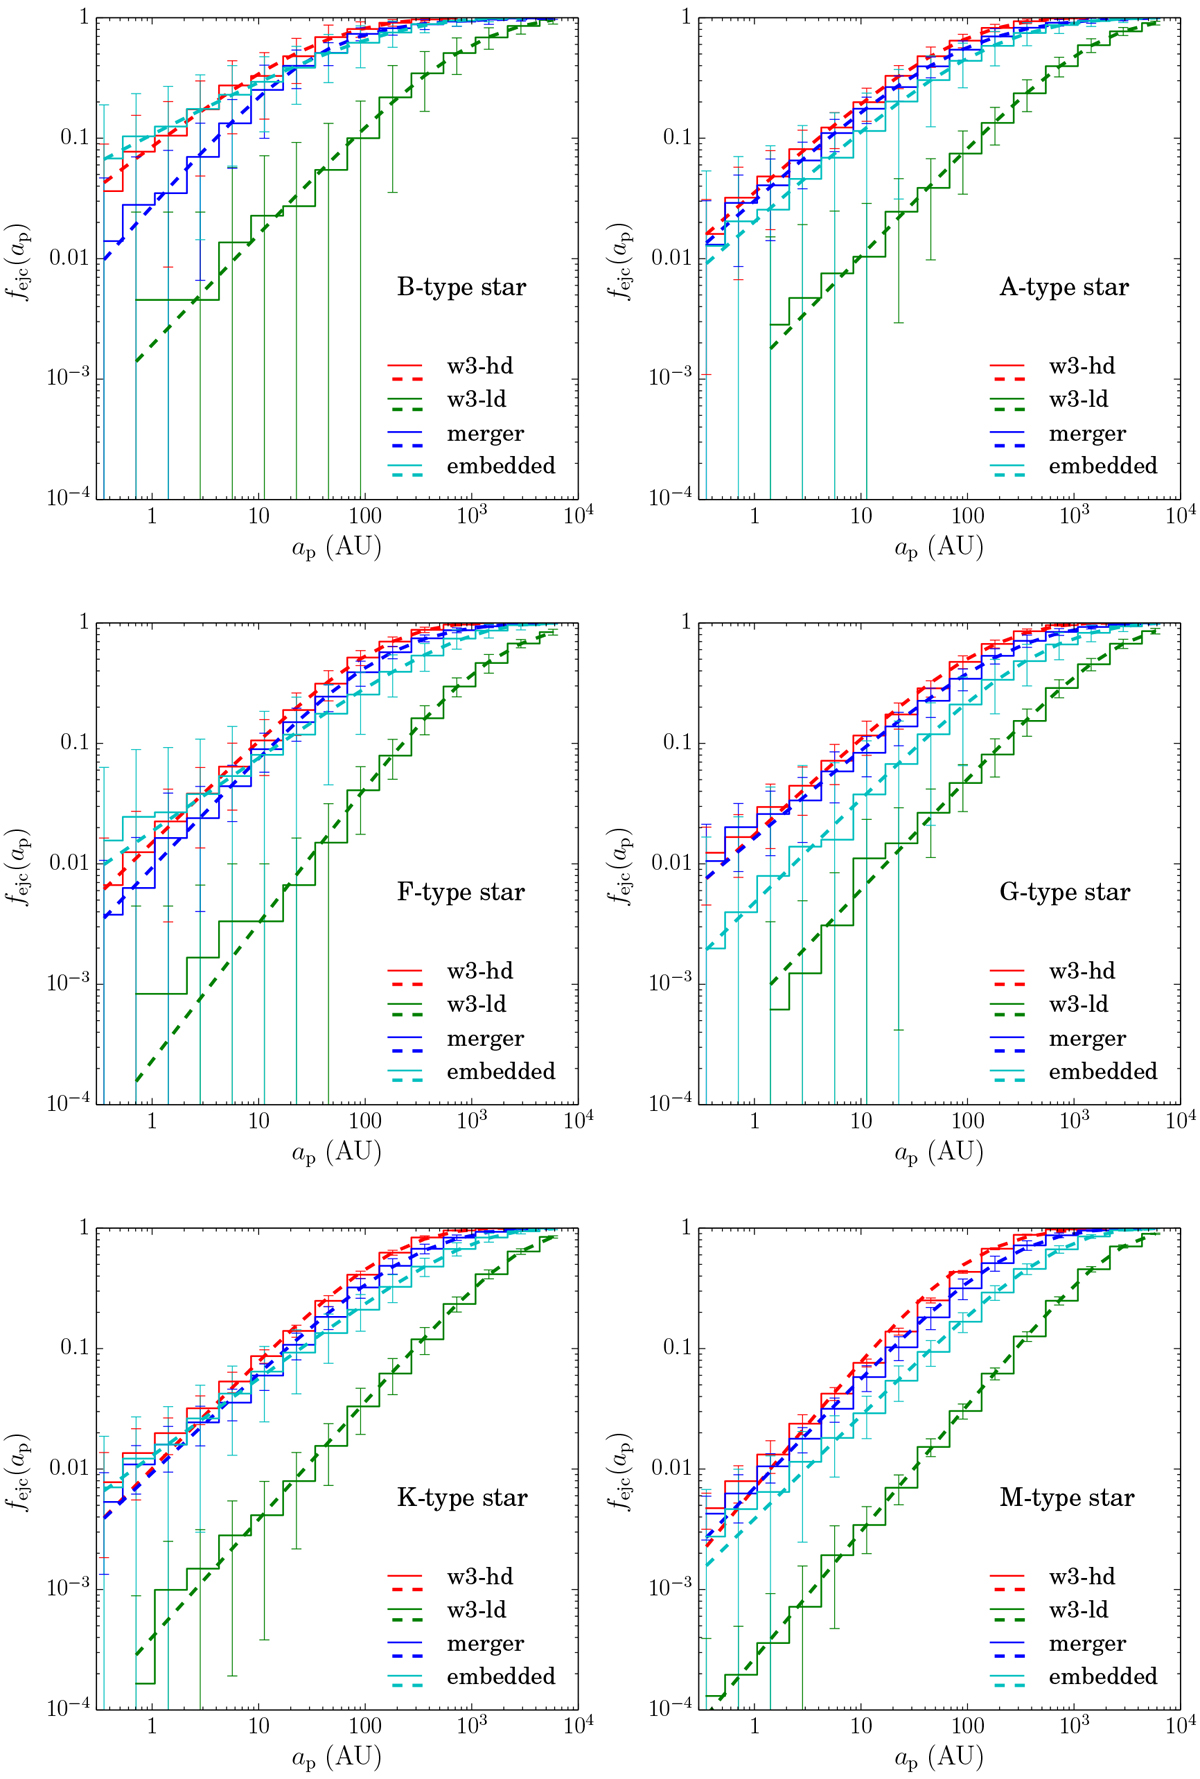
Ejection rates of planet as a function of the semi-major axis of the planet (ap) orbiting each spectral type of star at t = 170 Myr for the embedded-cluster model and at t = 600 Myr for the other models. Error bars indicate run-to-run variations (standard deviations). Dashed curves are the fitting function given by Eq. (10). We classify stellar spectral types according to stellar mass as follows: M: 0.08 < m < 0.45, K: 0.45 < m < 0.8, G: 0.8 < m < 1.04, F: 1.04 < m < 1.4 A: 1.4 < m < 2.1, and B: 2.1 < m < 16, where m is the mass of the (planet-hosting) star in units of M⊙.
Current usage metrics show cumulative count of Article Views (full-text article views including HTML views, PDF and ePub downloads, according to the available data) and Abstracts Views on Vision4Press platform.
Data correspond to usage on the plateform after 2015. The current usage metrics is available 48-96 hours after online publication and is updated daily on week days.
Initial download of the metrics may take a while.