Fig. E.2
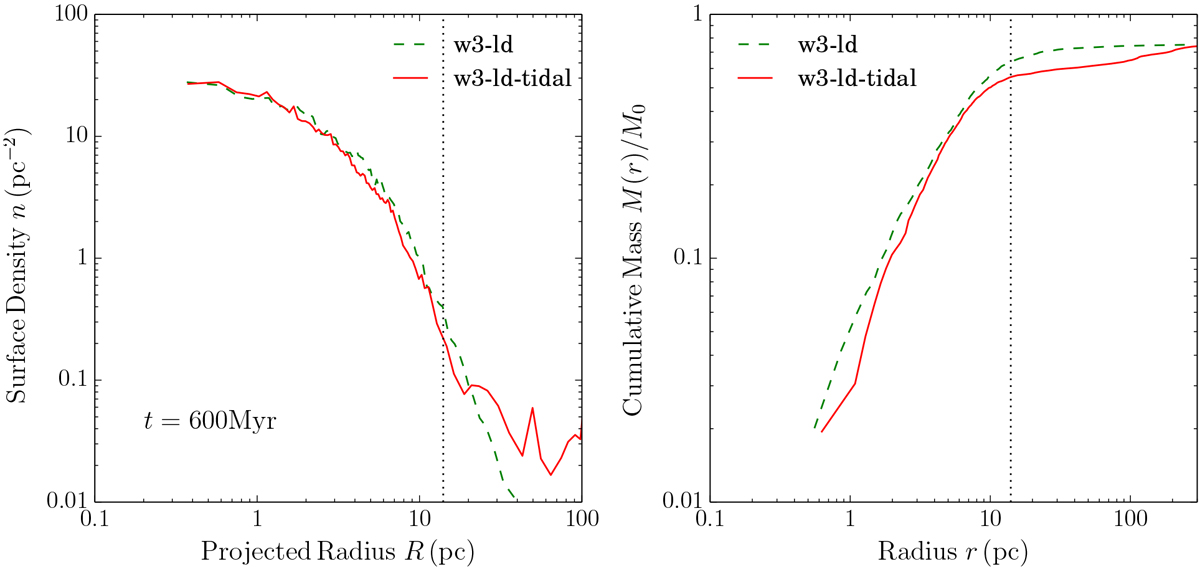
Surface density profile (left) and cumulative mass distribution form the cluster center (right) for models w3-ld (green dashed curve) and w3-ld-tidal (red solid curve). The cumulative mass distributions are normalized by the initial mass of the cluster. Vertical dotted line indicates the tidal radius (14 pc) at 8 kpc from the Galactic center. The surface density profile are averaged over five snapshots around 600 Myr.
Current usage metrics show cumulative count of Article Views (full-text article views including HTML views, PDF and ePub downloads, according to the available data) and Abstracts Views on Vision4Press platform.
Data correspond to usage on the plateform after 2015. The current usage metrics is available 48-96 hours after online publication and is updated daily on week days.
Initial download of the metrics may take a while.