Fig. 1
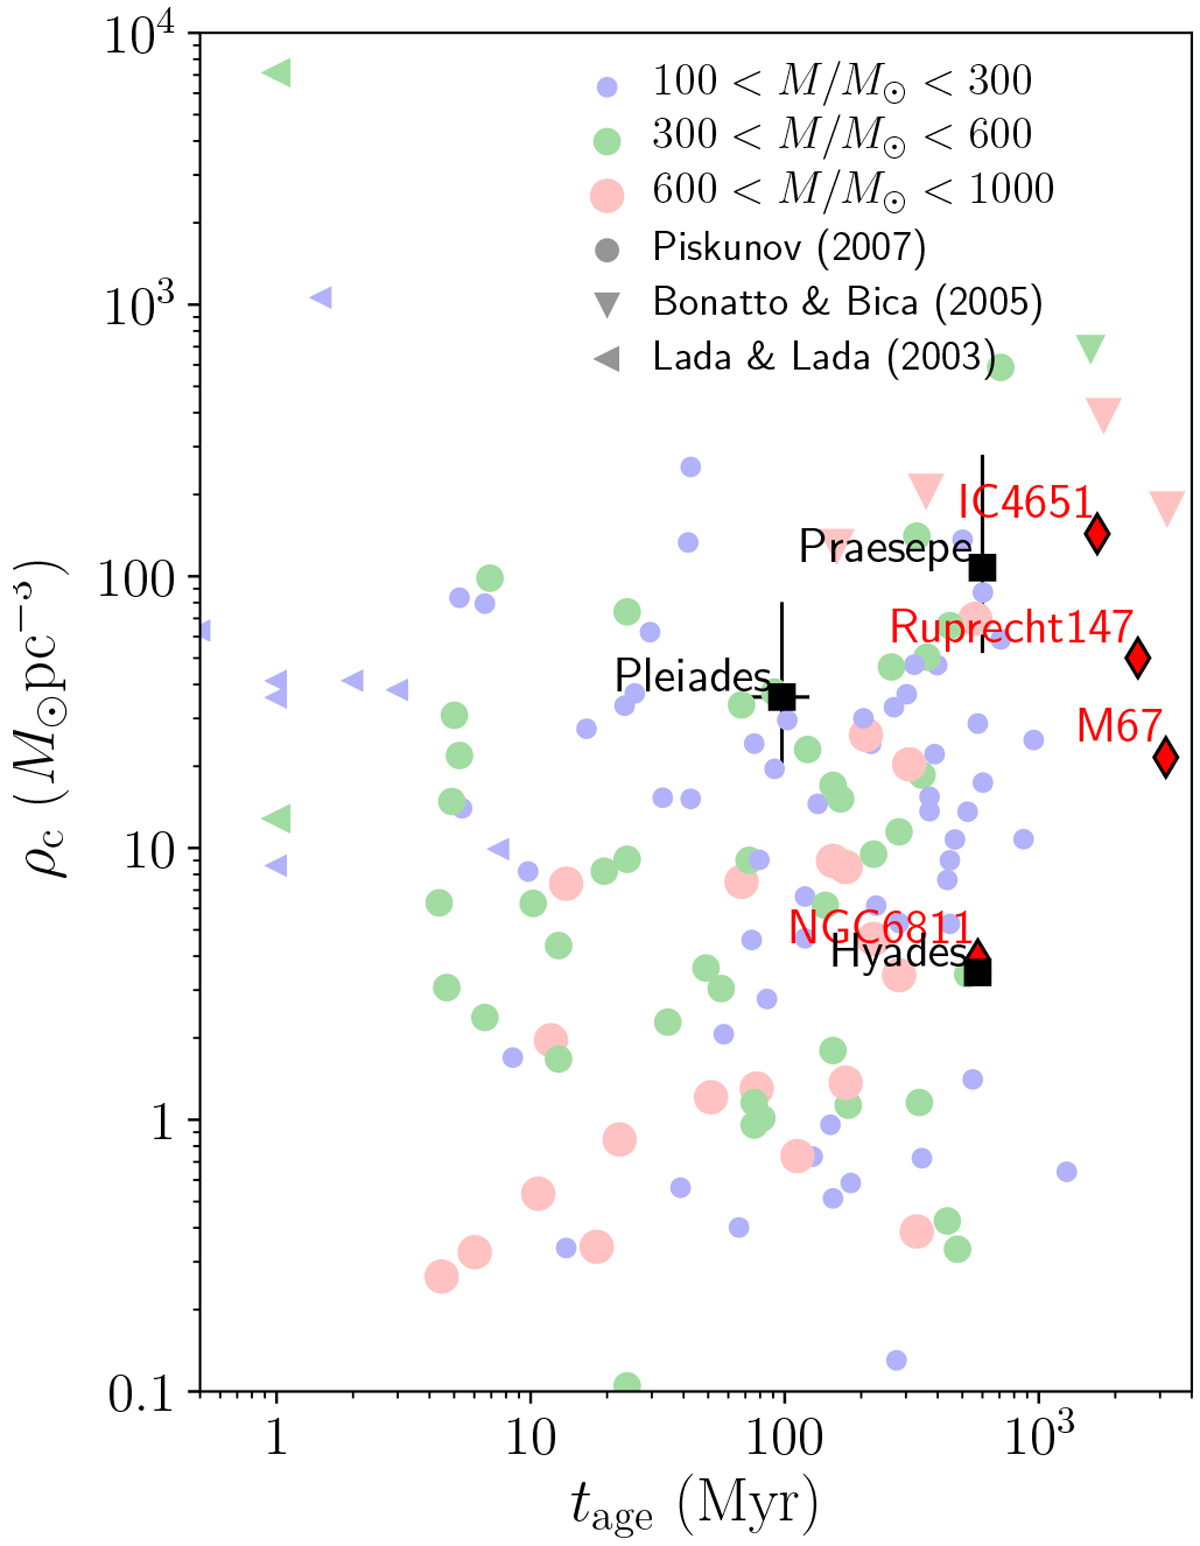
Relationship between central densities of open clusters (ρc) and their ages (tage). The data are from Lada & Lada (2003) for left-pointing triangles, Bonatto & Bica (2005) for down-pointing triangles, and Piskunov et al. (2007) and Meibom et al. (2002) for circles and red diamonds (planet-harboring clusters). Each color represents the total mass of each open cluster: blue (100–300 M⊙), green (300–600 M⊙), and pink (600–1000 M⊙). Our target clusters and planet-harboring clusters are shown by filled black squares and red diamonds, respectively.
Current usage metrics show cumulative count of Article Views (full-text article views including HTML views, PDF and ePub downloads, according to the available data) and Abstracts Views on Vision4Press platform.
Data correspond to usage on the plateform after 2015. The current usage metrics is available 48-96 hours after online publication and is updated daily on week days.
Initial download of the metrics may take a while.