Free Access
Fig. 7
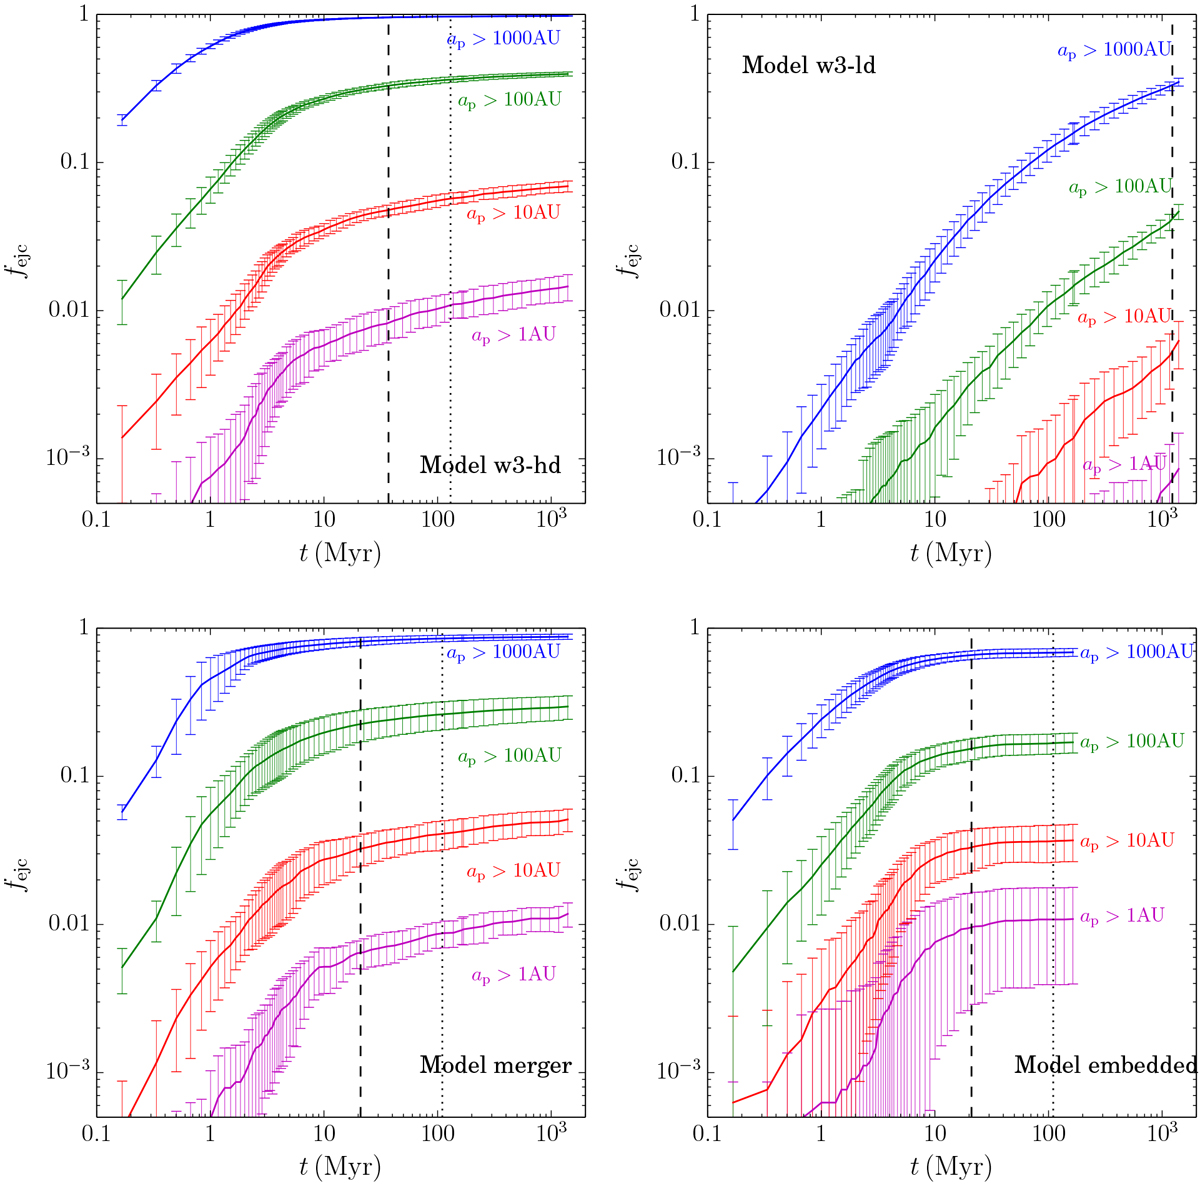
Time evolution of ejection rates (fejc) of planets with ap > 1, 10, 100, and1000 AU. Error bars indicate run-to-run variations (standard deviations). Vertical dotted and dashed lines indicate 100 trlx,c and 10 trlx, respectively. For the merger model, we adopt trlx,c and trlx of the subcluster.
Current usage metrics show cumulative count of Article Views (full-text article views including HTML views, PDF and ePub downloads, according to the available data) and Abstracts Views on Vision4Press platform.
Data correspond to usage on the plateform after 2015. The current usage metrics is available 48-96 hours after online publication and is updated daily on week days.
Initial download of the metrics may take a while.