| Issue |
A&A
Volume 622, February 2019
|
|
|---|---|---|
| Article Number | A211 | |
| Number of page(s) | 21 | |
| Section | Stellar structure and evolution | |
| DOI | https://doi.org/10.1051/0004-6361/201834835 | |
| Published online | 21 February 2019 | |
Prolonged sub-luminous state of the new transitional pulsar candidate CXOU J110926.4−650224
1
Institute of Space Sciences (ICE, CSIC), Campus UAB, Carrer de Can Magrans s/n, 08193 Barcelona, Spain
e-mail: This email address is being protected from spambots. You need JavaScript enabled to view it.
2
Institut d’Estudis Espacials de Catalunya (IEEC), 08034 Barcelona, Spain
3
INAF – Osservatorio Astronomico di Roma, via Frascati 33, 00040 Monte Porzio Catone (Roma), Italy
4
INAF – Osservatorio Astronomico di Capodimonte, Salita Moiariello 16, 80131 Napoli, Italy
5
Southern African Large Telescope Foundation, PO Box 9 7935 Observatory, Cape Town
South Africa
6
Department of Physics, University of the Free State, PO Box 339 9300 Bloemfontein, South Africa
7
Deutsches Elektronen-Synchrotron (DESY), 15738 Zeuthen, Germany
8
Anton Pannekoek Institute for Astronomy, University of Amsterdam, Science Park 904, 1098 XH Amsterdam, The Netherlands
9
Institució Catalana de Recerca i Estudis Avançats (ICREA), 08010 Barcelona, Spain
10
Dipartimento di Fisica e Chimica, Università di Palermo, Via Archirafi 36, 90123 Palermo, Italy
11
Department of Astronomy, University of Geneva, Chemin d’Ecogia 16, 1290 Versoix, Switzerland
12
Warsaw University Astronomical Observatory, Al. Ujazdowskie 4, 00-478 Warszawa, Poland
13
INAF – Osservatorio Astronomico di Brera, via Emilio Bianchi 46, 23807 Merate (LC), Italy
14
XMM-Newton Science Operations Centre, ESAC/ESA, Camino Bajo del Castillo s/n, Urb. Villafranca del Castillo, 28691 Villanueva de la Cañada, Madrid, Spain
15
Department of Quantum Physics and Astrophysics & Institute of Cosmos Sciences, University of Barcelona, Martí i Franquès 1, 08028 Barcelona, Spain
Received:
12
December
2018
Accepted:
26
December
2018
Abstract
We report on a multi-wavelength study of the unclassified X-ray source CXOU J110926.4−650224 (J1109). We identified the optical counterpart as a blue star with a magnitude of ∼20.1 (3300–10500 Å). The optical emission was variable on timescales from hundreds to thousands of seconds. The spectrum showed prominent emission lines with variable profiles at different epochs. Simultaneous XMM-Newton and NuSTAR observations revealed a bimodal distribution of the X-ray count rates on timescales as short as tens of seconds, as well as sporadic flaring activity. The average broad-band (0.3–79 keV) spectrum was adequately described by an absorbed power law model with photon index of Γ = 1.63 ± 0.01 (at 1σ c.l.), and the X-ray luminosity was (2.16 ± 0.04) × 1034 erg s−1 for a distance of 4 kpc. Based on observations with different instruments, the X-ray luminosity has remained relatively steady over the past ∼15 years. J1109 is spatially associated with the gamma-ray source FL8Y J1109.8−6500, which was detected with Fermi at an average luminosity of (1.5 ± 0.2) × 1034 erg s−1 (assuming the distance of J1109) over the 0.1–300 GeV energy band between 2008 and 2016. The source was undetected during ATCA radio observations that were simultaneous with NuSTAR, down to a 3σ flux upper limit of 18 μJy beam−1 (at 7.25 GHz). We show that the phenomenological properties of J1109 point to a binary transitional pulsar candidate currently in a sub-luminous accretion disk state, and that the upper limits derived for the radio emission are consistent with the expected radio luminosity for accreting neutron stars at similar X-ray luminosities.
Key words: accretion, accretion disks / methods: data analysis / stars: neutron / methods: observational / X-rays: binaries / X-rays: individuals: CXOU J110926.4−650224
© ESO 2019
1. Introduction
Radio millisecond pulsars (MSPs) are believed to be old, weakly magnetised pulsars that have been spun up after a Gyr-long phase of angular momentum transfer through mass accretion from a sub-solar (M ≲ 1 M⊙) companion star in a low-mass X-ray binary system (LMXB; e.g. Alpar et al. 1982). Swings between a rotation-powered MSP state and an accretion-powered LMXB state were observed recently over a few weeks in the transient system IGR J18245−2452 (Papitto et al. 2015), proving that the evolutionary path towards a radio MSP is not smooth, but encompasses transitions on timescales compatible with changes of the mass accretion rate onto the neutron star (NS). State transitions have also been observed recently in the systems PSR J1023+0038 (Archibald et al. 2009; Stappers et al. 2014) and XSS J12270−4859 (Bassa et al. 2014), although these have never been observed to undergo a fully-fledged accretion outburst (see Campana & Di Salvo 2018, for a review).
The three “transitional” MSPs (tMSPs) share an enigmatic intermediate sub-luminous accretion disk state where the X-ray luminosity is orders of magnitude lower than that measured during the typical accretion outbursts of NS LMXBs. The X-ray emission shows a peculiar bimodal distribution in the count rates over a broad energy range (up to at least 80 keV; e.g. Tendulkar et al. 2014). The switches between the two different intensity levels (henceforth dubbed “modes”) occur on timescales as short as tens of seconds. Sporadic flaring activity is also observed (e.g. de Martino et al. 2013; Coti Zelati et al. 2018). tMSPs in the sub-luminous accretion disk state are observed to emit in the gamma-ray band, with a luminosity comparable to that in the X-ray band (e.g. Torres et al. 2017), as well as in the radio band. In particular, the radio emission is characterised by a flat to slightly inverted spectrum, and is rapidly variable, a factor of approximately two to three on timescales of minutes (e.g. Deller et al. 2015). Coherent X-ray pulsations at the NS spin period have been observed only in the high mode, and were initially interpreted in terms of intermittent mass accretion onto the NS surface (Archibald et al. 2015; Papitto et al. 2015). However, the radio flaring activity associated with the X-ray low mode (Bogdanov et al. 2018) and the detection of optical pulses during the X-ray high and flare modes (Ambrosino et al. 2017; Papitto et al., in prep.) in the prototypical tMSP, PSR J1023+0038, challenge this interpretation, and suggest instead an active rotation-powered MSP in the sub-luminous accretion disk state.
In search for X-ray counterparts to the 2131 unclassified gamma-ray sources in the recent preliminary release of the Fermi Large Area Telescope (LAT) eight-year point source list1, we pinpointed CXOU J110926.4−650224 (J1109) as the only X-ray counterpart to FL8Y J1109.8−6500. J1109 was discovered during a ∼5 ks observation with Chandra in 2008, and singled out as the soft X-ray counterpart of the unidentified persistent hard X-ray source IGR J11098−6457 (Tomsick et al. 2009). It is also listed in the Palermo Neil Gehrels Swift Observatory (Swift) Burst Alert Telescope (BAT) source catalogue as 4PBC J1109.3−65012 (Cusumano et al. 2014; see Fig. 1). However, its nature has so far remained elusive. The spatial coincidence with the hard X-/gamma-ray source, as well as the dramatic time variability of the soft X-ray emission on timescales of tens of seconds that we revealed from a preliminary analysis of the Chandra data (see Sect. 6.2 for more details), represent phenomenological properties shared by all three tMSPs in the sub-luminous accretion disk state. We hence suspected that J1109 could be a tMSP in the same state.
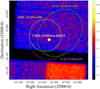 |
Fig. 1. Exposure-corrected image of the field around J1109 (labelled in white) extracted from Chandra ACIS-I data over the 0.3–8 keV energy band. The image was smoothed with a Gaussian filter with a kernel radius of 3 pixels (one ACIS pixel corresponds to 0.492 arcsec), and a logarithmic scale was adopted for better visualization. North is up, east to the right. The green ellipse has semi-major and semi-minor axes of 5.5 and 4.3 arcmin, respectively, at a position angle of 39.2° (measured from north towards east), and represents the error region (at 95% c.l.) for the position of the gamma-ray source FL8Y J1109.8−6500 obtained using 8 years of Fermi/LAT data. The magenta circle represents the error region for the position of the hard X-ray source IGR J11098−6457, obtained using 2995 ks of INTEGRAL IBIS data between 2002 and 2010 (see the 8 yr INTEGRAL IBIS soft gamma-ray survey catalogue by Bird et al. 2016 for more details). The yellow circle represents the error region for the position of the hard X-ray source 4PBC J1109.3−6501, obtained using 32.8 Ms of Swift BAT data between 2004 December and 2013 March (see the 100-month Palermo Swift BAT catalogue by Cusumano et al. 2014 for more details). The colour code on the right indicates the S/N at the different positions in the image. |
This paper reports on a multi-wavelength study of J1109 aimed at ascertaining its nature. The manuscript is structured as follows: we report details on the associated optical and gamma-ray sources in Sect. 2; we present the optical, X-ray, and radio observations and the corresponding data analysis in Sects. 3–5, respectively; we report on the results in Sect. 6; discussion of our results and conclusions follow in Sects. 7 and 8, respectively.
2. The optical and gamma-ray counterparts
The X-ray source is located at  ,
,  (J2000.0 equinox), with a positional uncertainty of 0.55 arcsec at a 1σ confidence level (c.l.)3. The error circle includes an optical source listed in the second Gaia data release (Gaia Collaboration 2018) at
  ,
,  (J2015.5 Barycentric Coordinate Time; 1σ uncertainties on the last digits are reported in parentheses). Its average observed magnitudes are G ∼ 20.1, Bp ∼ 20.2 and Rp ∼ 19.2 over the 3300–10 500 Å, 3300–6800 Å and 6400–10 500 Å wavelength ranges, respectively4. Its absolute trigonometric parallax, ϖ = 0.73 ± 1.06 mas, can be converted into a distance by means of a Bayesian method, assuming an exponentially decreasing volume density prior of the form P(D | L)=(2L3)−1D2 exp(−D/L) (see Bailer-Jones et al. 2018). For such an uncertain measurement, the distance estimate is dominated by the choice of the prior length scale. On the one hand, a value of D = 4.0 kpc with 16th and 84th percentiles of 1.7 and 7.9 kpc, respectively, is obtained when adopting a length scale of L = 2.1 kpc, based on a three-dimensional model of the Galaxy as seen by Gaia (Rybizki et al. 2018). On the other hand, a larger value of D = 6.5 kpc with 16th and 84th percentiles of 4.4 and 15.5 kpc, respectively, is derived when considering a length scale of L = 3.4 kpc, based on the three-dimensional model of the space distribution of LMXBs detected in the X-ray band in the Galaxy (Grimm et al. 2002; Gandhi et al. 2018). The posterior probability distribution function for the former case is shown in Fig. 2.
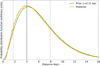 |
Fig. 2. Posterior probability distribution function (PDF; yellow curve) for the distance of J1109 for an exponentially decreasing volume density prior with length scale of L = 2.11 kpc (green curve). The mode of the PDF is indicated by the vertical black solid line. The lower and upper boundaries of the highest density interval containing 68.27% of the posterior probability (i.e., the 16th and 84th percentiles) are indicated by the two vertical black dotted lines. The known systematic zero-point offset of −29 μas in the Gaia parallaxes determined from Gaia observations of quasars (Lindegren et al. 2018) was taken into account in the computation. The plot was produced using the code publicly available at https://github.com/Alymantara/gaia_distance_calculator/blob/master/gaia_distance_calculator.ipynb. |
The gamma-ray source was detected with the Fermi/LAT (Atwood et al. 2009) at an energy flux of Fγ = (6 ± 1) × 10−12 erg cm−2 s−1 over the 0.1–100 GeV energy band between 2008 August and 2016 August. Its spectrum was well described by a power law model with photon index of Γγ = 2.58 ± 0.15. No information at higher energy is available, as the region around J1109 was not covered by the H.E.S.S. survey of the Galactic plane (H.E.S.S. Collaboration 20185).
In the following, we will adopt the position of the optical counterpart as a reference for all datasets, assume for simplicity a distance of D = 4 kpc, and quote all uncertainties at the 1σ c.l. (unless otherwise explicitly stated). The gamma-ray flux measured with Fermi/LAT translates into a luminosity of  erg s−1 over the 100 MeV–300 GeV energy band, where d4 is the distance in units of 4 kpc. We stress, however, that the assumed value for the distance should be taken with caution, owing to the very large uncertainty on the parallax measurement.
3. Optical observations
3.1. SALT
We obtained a set of six consecutive 100-s images of the field around J1109 in the g′, r′ and i′ SDSS filters with the SALTICAM imaging camera (O’Donoghue et al. 2006) mounted on the 10 m Southern African Large Telescope (SALT; Buckley et al. 2006) at the Sutherland plateau of the South African Astronomical Observatory. The observations started on 2018 March 4 at 00:52:29.33 Coordinated Universal Time (UTC).
We also obtained optical spectra of J1109 using the Robert Stobie Spectrograph (RSS) on SALT in long-slit mode (Burgh et al. 2003; Kobulnicky et al. 2003). Two spectra each with exposure times of 1000 s were recorded on 2018 March 4 (starting at 01:25:05 and 01:41:58 UTC, respectively), and one with exposure time of 1800 s on 2018 July 6 (starting at 17:19:17 UTC). The PG0300 grating was used at grating angles of 5.375° and 5°, respectively for the two dates, yielding a usable wavelength range of ∼3700–9000 Å and a resolving power of 350 at 6200 Å. We used a 1.5 arcsec slit placed at a position angle of PA = 20° (measured from north towards east) for all the observations.
The reductions of the photometric and spectroscopic data were performed with PYSALT version 0.47, the official PYRAF-based software package for SALT data reductions (Crawford et al. 2010)6, and included gain correction, correction for cross-talk between the amplifiers, bias subtraction and amplifier mosaicking. Absolute flux calibration of SALT data is not feasible, owing to the moving pupil of the telescope (the effective area of the telescope constantly changes during the tracks and exposures; see Buckley et al. 2008).
The cleaned images of the field around J1109 in the three filters are shown in Fig. 3. We performed differential photometry of J1109 against three relatively bright close-by (< 30 arcsec) stars listed in the Two Micron All Sky Survey (2MASS; Skrutskie et al. 2006) all-sky point source catalogue, using the DAOPHOT task (Stetson 2000) within the IRAF (Image Reduction and Analysis Facility) package7 (Tody 1986, 1993). We derived the g′, r′ and i′ magnitudes of the three stars using their G, Bp and Rp-band magnitudes quoted in the second Gaia data release and the magnitude colour conversion formulas reported by Evans et al. (2018; see their Table A.2), after having verified consistency in the conversion between the 2MASS and Gaia magnitudes. This approach allowed us to minimise any systematic effect related to flat-fielding, vignetting and atmospheric turbulence. For each acquired image, we then averaged the values for the magnitudes obtained using the three stars.
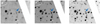 |
Fig. 3. Zoom of the optical images of the field around J1109 obtained on 2018 March 4 using SALTICAM. North is up, east to the left. Images acquired in the same filter were co-added, yielding total net exposures of 300 s, 200 s and 100 s in the g′, r′ and i′ filters, respectively. The white strip is due to the gap between the two CCD chips. The blue arrowhead in each panel indicates the position of the source in the second Gaia data release located within the error circle of J1109 (as determined using Chandra data). See the text for details. |
We performed further processing on the spectroscopic data through standard spectral calibration procedures with IRAF. Wavelength calibration was performed using an Argon arc lamp spectrum acquired immediately after the science exposures. Background subtraction was done by fitting and subtracting a cubic spline function along every constant-wavelength column in the two-dimensional spectral image, fitting only the background and ignoring stellar spectra and cosmic rays in the image. During the spectral extraction from a tilted rectangular aperture, a cleaning algorithm was applied to remove cosmic rays from the resulting spectrum. Relative flux calibration was performed for all the spectra, using observations of spectrophotometric standard stars at exactly the same RSS configurations as the J1109 observations. The 2018 March 4 target spectra were calibrated using a spectrum of HILT600 obtained on 2018 February 28, while the 2018 July 6 target spectrum was calibrated with a spectrum of LTT1020 obtained on 2018 November 11.
3.2. XMM-Newton optical monitor
The Optical/UV Monitor Telescope (OM; Mason et al. 2001) on board XMM-Newton (Jansen et al. 2001) observed J1109 starting on 2018 June 20 at 20:05:09 UTC (observation ID: 0764344301; PI: A. Papitto). It collected the data both in the “Image” and “Fast Window” modes using the B filter (3975–5025 Å). Only seven exposures were acquired in the image mode (each lasting 4.3–4.5 ks), owing to an instrument anomaly during the observation (Ballo, priv. comm.).
We reduced the data using the OMICHAIN and OMFCHAIN processing pipelines of the XMM-Newton Science Analysis System (SAS v. 17.0.0). We corrected residual boresight errors in each image by cross-matching the positions of the sources detected with those appearing in the second Gaia data release.
4. X-ray observations
4.1. XMM-Newton EPIC and RGS
J1109 was observed with the European Photon Imaging Cameras (EPIC) and the Reflection Grating Spectrometer (RGS) arrays on board XMM-Newton for about 68 ks on 2018 Jun 20–21 (see Table 1). The pn camera (Strüder et al. 2001) was set in fast timing (FT) mode (time resolution Δtres ∼ 29.52 μs) using the thin filter. The MOS1 and MOS2 cameras (Turner et al. 2001) were operated in large (Δtres ∼ 0.9 s) and small (Δtres ∼ 0.3 s) window modes, respectively, using the thin filter. The RGSs (den Herder et al. 2001) were operated in the standard spectroscopy mode (Δtres ∼ 5.7 s) throughout the observation. However, the RGS data were discarded from our analysis, as the low signal-to-noise ratio (S/N) precluded any meaningful study of the source X-ray emission properties.
Journal of all X-ray pointed observations of J1109.
We processed the raw EPIC observation data files within SAS, using the most up to date calibration files available. We extracted a light curve of single-pixel events (PATTERN = 0) for the whole field of view (FoV) and for each EPIC instrument, and filtered out the datasets corresponding to the initial ∼3 ks of the observation, as these were affected by a slightly enhanced background flaring activity. For the pn camera we extracted the source counts within a ten-pixel-wide strip orientated along the readout direction of the CCD and centred on the brightest column of CCD pixels (RAW-X = 37; one EPIC pn pixel corresponds to 4.1 arcsec). Background events were accumulated within a 3-pixel-wide region far from the position of the source (3≤ RAW-X ≤5). For the two MOSs, source counts were collected within a circle with a radius of 30 arcsec, and the background from a circle of the same size located on the same CCD. The average source net count rate over the 0.3–10 keV energy band was 0.584 ± 0.004 counts s−1 for the pn, 0.172 ± 0.002 counts s−1 for the MOS1 and 0.199 ± 0.002 counts s−1 for the MOS2. For the timing analysis, we referred the photons’ arrival times of all event lists to the Solar System barycentre reference frame using the DE-200 Solar System ephemeris (which we adopt in the following for all data sets). We extracted the light curve of J1109 over the 0.3–10 keV energy range by combining the background-subtracted and exposure-corrected time series from each camera during the periods when all three instruments acquired data simultaneously. For the spectral analysis, we retained only single and double pixel events optimally calibrated (PATTERN ≤4, FLAG = 0). We produced the redistribution matrices and effective area files for each spectrum, and grouped the background-subtracted spectra following the optimal binning prescription of Kaastra & Bleeker (2016). We restricted the spectral analysis of the pn data to energies above 0.7 keV, owing to known calibration issues of this instrument at low energy when operating in the FT mode.
4.2. NuSTAR
The Nuclear Spectroscopic Telescope Array mission (NuSTAR; Harrison et al. 2013) observed J1109 on 2018 June 20–21 (obs. ID: 80101101002; PI: A. Papitto) for an elapsed time of 115.2 ks and an effective net on-source exposure time of about 67.5 ks. The observation began ∼10 h before and ended ∼3.5 h after the XMM-Newton pointing, thus yielding complete simultaneity with the XMM-Newton observation (see Table 1). We processed the data using the script NUPIPELINE (v. 0.4.6) under the NuSTAR Data Analysis Software (NUSTARDAS v. 1.9.38), and adopted the most recent instrumental calibration files (v20180419). We also filtered the data excluding time intervals related to passages of the satellite through the South Atlantic Anomaly (SAA), and corrected for drifts of the spacecraft clock adopting the NuSTAR clock file v. 82. The combined image of the field around J1109 extracted using both focal plane modules (FPMA, FPMB) is shown in the inset of Fig. 4. For each FPM, we collected the source counts within a circular region of radius 50 arcsec, and background photons from a circle of radius 135 arcsec located on the same detector chip far away from the source. The average source net count rate over the 3–79 keV energy band was 0.065 ± 0.001 counts s−1 for the FPMA and 0.060 ± 0.001 counts s−1 for the FPMB. We referred the photons’ times of arrival to the Solar System reference frame. Background-subtracted and exposure corrected light curves, source and background spectra, response matrices and ancillary files were created separately for each FPM using NUPRODUCTS (v. 0.3.0). The light curves were combined to increase the S/N, and to probe the variability pattern of the source more in detail in the hard X-ray band. The spectra were grouped using the scheme of Kaastra & Bleeker (2016), as for the XMM-Newton data sets.
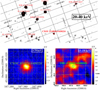 |
Fig. 4. Images of the sky region around J1109 in different broad X-ray energy ranges obtained using different instruments. Top panel: INTEGRAL IBIS/ISGRI 20–40 keV mosaicked image. Galactic coordinates are reported. The grey scale is proportional to the X-ray flux. All sources detected in the field are labelled (J1109 is labelled in bold). Lower panels, left: NuSTAR FPMA+FPMB 3–79 keV image with sub-pixel binning. The 50 arcsec circle adopted to extract the source photons is overlaid. The colour code indicates the S/N at the different positions in the image. Lower panels, right: Swift BAT 15–150 keV image. The colour code indicates the S/N at the different positions in the image (negative values are in logarithmic scale). Different scales have been adopted for the images in the lower panels (more enlarged from left to right). |
4.3. ROSAT
J1109 entered the FoV of the Position-Sensitive Proportional Counter (Pfeffermann et al. 1987) on board the Roentgen Satellite (ROSAT) for ∼430 s on 1991 January 18–21, during the satellite all-sky survey (sequence ID: RS932816N00). The source was detected at a count rate of (27 ± 9) ks−1 in the 0.1–2.4 keV energy band, computed applying the SOSTA tool of XIMAGE (v. 4.5.1) on the processed image.
4.4. Swift XRT
J1109 was observed three times with the X-ray Telescope (XRT; Burrows et al. 2005) on board Swift (Gehrels et al. 2004) in 2008 and 2009. We requested two additional pointings more recently, on 2018 February 23 and 28, to assess the source flux after a decade-long gap of X-ray observations of the field, and to unveil possible long-term spectral and flux variations of the soft X-ray emission. In all cases, the XRT was configured in the photon counting (PC) mode, yielding a readout time of ∼2.5 s (see Table 1).
We processed all data with standard screening criteria and generated exposure maps with the task XRTPIPELINE (v. 0.13.4) from the FTOOLS package. We extracted the source and background event lists and spectra using a circular region with a radius of 20 pixels (corresponding to 90% of the XRT encircled energy fraction at 1.5 keV) and an annulus with inner and outer radius of 40 and 80 pixels, respectively (one XRT pixel corresponds to about 2.36 arcsec). For all the observations we extracted exposure-corrected and background-subtracted light curves using XRTLCCORR and LCMATH (the latter accounting also for different areas of the source and background extraction regions). We created the observation-specific ancillary response files, assigned the appropriate redistribution matrix available in the HEASARC calibration data base, and filtered out photons with energy below 0.3 keV. Because some of the spectra were characterised by too few counts for the χ2-fitting, we decided to group each dataset so as to contain at least 5 counts in each spectral bin, and used the Cash statistics (Cash 1979).
4.5. Chandra
The Chandra X-ray Observatory observed the field of J1109 with the imaging array of the Advanced CCD Imaging Spectrometer (ACIS-I; Garmire et al. 2003) for ≃5 ks on 2008 September 12, as part of a programme aimed at localising and characterising the soft X-ray counterparts of unclassified INTEGRAL sources (Tomsick et al. 2009). The ACIS-I was set in full-imaging timed-exposure mode (frame time of 3.24 s) with faint telemetry format.
We re-analysed the data following the standard analysis threads for a point-like source with the Chandra Interactive Analysis of Observations software (CIAO, v. 4.10; Fruscione et al. 2006) and the calibration files stored in the Chandra CALDB (v. 4.8.1). First, we reprocessed the data using the CHANDRA−REPRO script. The exposure-corrected image of the sky region around J1109 is shown in Fig. 1. J1109 was located far off-axis, about 5.8 arcmin away from the position of the aim point. Because the shape and size of the ACIS point spread function are known to change significantly as a function of the off-axis angle, we decided to apply the PSFSIZE−SRCS tool to estimate the radius of the 90% encircled counts fraction in the 0.5–7.0 keV energy band at a similar offset angle. Source photons were hence collected within a circular region with a radius of 5 arcsec. The background was extracted from an annulus centred on the source location, with inner and outer radius of 6 and 12 arcsec, respectively. We visually inspected the time series of the background emission, and did not find any flaring episode during the whole duration of the observation, regardless of the adopted time bin. We hence retained all datasets in the following analysis. We then restricted the analysis to the 0.3–8 keV energy interval, where the calibration of the spectral responses is best known. The average source net count rate in this energy band was 0.182 ± 0.006 counts s−1. The times of arrival of the source photons were referred to the Solar System reference frame. The source and background spectra, the associated redistribution matrix and ancillary response file were generated by means of the SPECEXTRACT script. The background-subtracted spectrum was rebinned as explained by Kaastra & Bleeker (2016).
4.6. XMM-Newton slew observations
The field of J1109 was covered by XMM-Newton slew observations on 2012 February 4, 2014 February 11 and 2017 January 5, when the spacecraft was moving between scheduled pointing positions during revolutions 2226, 2596 and 3127, respectively (see Table 2 for a journal of the observations). The slew observations are based on data from the pn camera alone, with the medium optical blocking filter in place. The in-orbit slew speed of 90° h−1 translates into exposure times in the 1–11 s range, yielding a sensitivity limit on the observed flux of ∼1.2 × 10⁻¹² erg cm−2 s−1 over the 0.2–12 keV energy interval (see Saxton et al. 2008). We ran the ESLEWCHAIN and ESLEWSEARCH tasks of SAS to process the data and compile a list of detected sources, respectively9. J1109 was detected at a count rate of 0.7 ± 0.3 counts s−1, 0.6 ± 0.3 counts s−1 and 0.9 ± 0.4 counts s−1 over the 0.2–12 keV energy band in 2012, 2014 and 2017, respectively (see Table 2). Hence, the count rate was consistent with being the same within the uncertainties along the three epochs.
Log of the XMM-Newton EPIC pn slew observations of J1109.
4.7. INTEGRAL
The field around J1109 was observed with the International Gamma-Ray Astrophysics Laboratory (INTEGRAL; Winkler et al. 2003) from 2003 January 29 to 2018 February 28, covering the satellite revolutions 36–1916. We processed and analysed all the publicly available data using the Off-line Scientific Analysis software (OSA v. 10.2) distributed by the INTEGRAL Science Data Centre (Courvoisier et al. 2003).
The INTEGRAL observations are divided into “science windows” (SCWs), i.e. pointings with typical durations of ∼2–3 ks. For the analysis we retained all SCWs for which the source was located within an off-axis angle from the centre of the instrument FoV of 12° for the ISGRI detector (Lebrun et al. 2003) on the IBIS instrument (Ubertini et al. 2003) and 3.5° for the JEM-X (Lund et al. 2003). These choices allowed us to minimise the instruments calibration uncertainties10, and led to a selection of a total of 4078 SCWs.
We extracted the IBIS/ISGRI and JEM-X mosaic images by combining the images acquired in the single SCWs. J1109 was detected in the IBIS/ISGRI 20–40 keV mosaic (effective exposure of 6962 ks) at a significance of 6.9σ and average count rate of 0.07 ± 0.01 counts s−1 (this corresponds to 0.5 ± 0.1 mCrab, i.e. roughly 4 × 10⁻¹² erg cm−2 s−1). The source was instead not detected by JEM-X, and we estimated a 3σ upper limit on its 3–20 keV flux of 0.6 mCrab (roughly 1.4 × 10⁻¹¹ erg cm−2 s−1) from the mosaic. Figure 4 shows a zoom of the IBIS/ISGRI mosaic of the region around the source.
Given the relatively low detection significance in the IBIS/ISGRI mosaic, we extracted for this instrument a single spectrum integrating over the entire exposure time available. A power-law fit to the 20–50 keV spectrum yielded a photon index of Γ = 3.3 ± 1.9 and a flux ∼6 × 10⁻¹² erg cm−2 s−1 (reduced chi-squared  for 3 degrees of freedom, d.o.f. hereafter). In Sect. 6.2.3 we will fit again the spectrum by fixing the photon index to the better constrained value measured by the joint spectral fits of the XMM-Newton and NuSTAR datasets.
We also inspected all IBIS/ISGRI SCWs to search for possible few ks-long flares from the source. We extracted the light curves with a time resolution of 1 SCW over the 20–40 keV, 40–80 keV and 20–100 keV energy bands, but found no significant detections.
4.8. Swift BAT
The field has been continuously monitored in the hard X-ray range also by the BAT (Barthelmy et al. 2005) on board Swift, since the satellite launch. The hard X-ray counterpart of J1109, also listed in the fourth Palermo BAT catalogue with the name of 4PBC J1109.3−6501, was detected at an average count rate of (1.4 ± 0.2) × 10−5 counts s−1 over the 15–150 keV energy interval between 2004 December and 2017 October, at a S/N of 7.3 (see the inset in Fig. 4). We downloaded the eight-channel average spectrum, the response matrix file and the light curve binned at 360 d from the archive publicly available at the Palermo BAT survey website.
The spectrum is well described by a power law with photon index of Γ = 1.6 ± 0.3 ( for 6 d.o.f.), yielding a flux of ∼7.8 × 10⁻¹² erg cm−2 s−1 over the 15–150 keV energy interval. The value for the photon index is compatible within the uncertainties with that derived from the spectral fit of the INTEGRAL data over a narrower energy interval (see Sect. 4.7). In Sect. 6.2.3 we will fit again the spectrum by fixing the photon index to the value measured with the joint XMM-Newton and NuSTAR spectral fits.
5. Radio observations
We observed the field around J1109 with the Australia Telescope Compact Array (ATCA; Frater et al. 1992) on 2018 June 20 between 10:16:12 UTC and 15:42:36 UTC simultaneously at central frequencies of 5.5 and 9.0 GHz. The data were recorded utilising the Compact Array broad-band Backend (CABB; Wilson et al. 2011), comprised of 2048 1 MHz channels. The total on-source integration time was ∼4.8 h, entirely overlapping with the NuSTAR observation.
Data were processed and imaged following standard procedures within the Common Astronomy Software Applications package (CASA version 4.7.2; McMullin et al. 2007). We used 1934-658 as the primary bandpass and flux calibrator, and 1059-63 (∼1.8° away) as the phase calibrator. Images were produced using a Briggs robustness parameter of 2 (natural weighting) to maximise sensitivity. With the array in the 1.5A array configuration, this choice provided angular resolutions of 6.0 arcsec × 2.5 arcsec at 5.5 GHz and 3.6 arcsec × 1.4 arcsec at 9.0 GHz, with a position angle of 68° (measured from north towards east).
6. Results
6.1. The optical emission
The optical counterpart was detected in all the SALTICAM frames (see Table 3). The emission was highly and rapidly variable, increasing by ∼0.3 mag and ∼0.4 mag in the g′ and r′ filters, respectively, on timescales of hundreds of seconds. J1109 was also only detected in two consecutive XMM-Newton OM images (out of seven exposures), at a magnitude B = 20.47 ± 0.09 and B = 20.45 ± 0.09 in the Vega system. This shows that the optical variability extends to longer timescales, of the order of a few ks. Interestingly, these two detections correspond to time intervals when flaring activity was registered in the X-ray band during the last part of the observation (see Sect. 6.2.1), possibly suggesting a correlated variability pattern. However, the low S/N in the two OM images precluded any meaningful characterization of the optical variability and of a possible correlation between the optical and X-ray emissions.
Journal of the photometric observations of J1109 performed with SALTICAM on 2018 March 4.
All three spectra showed prominent, broad Balmer emission lines with variable profiles in time (see Fig. 5 and Table 4). On the other hand, the low-resolution spectra did not allow us to identify possible absorption features of the donor star.
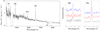 |
Fig. 5. Left-hand panel: low-resolution optical spectrum of J1109 obtained from the average of the two spectra acquired on 2018 March 4 using SALT RSS (total exposure of 2000 s), and restricted to the 4100–8600 Å wavelength range. The gaps over the 4530–4630 Å and 7790–7860 Å wavelength ranges are due to the gaps between the CCD chips in the RSS. The most prominent emission features as well as the telluric (atmospheric) O2 absorption feature are labelled. Right-hand panel: zoom on the wavelength ranges around the Hβ and Hα emission lines for the three spectra (in black, red and blue following the chronological order of spectra acquisition). Spectra were normalised to the continuum, and shifted along the vertical axis for better visualization. |
Properties of the Balmer emission lines of J1109 measured for the three spectra acquired with SALT RSS (see the text for details).
6.2. The X-ray emission
6.2.1. Timing properties
The light curve extracted from XMM-Newton EPIC data is reported in Fig. 6. It shows unpredictable, substantial, rapid changes in the net count rate on timescales as short as 30 s. A bimodal trend of the net count rates was particularly evident over the first ∼49 ks of the observation: during a few time instances, the net count rate dropped sharply to zero for elapsed times ranging from a minimum of a few tens of seconds up to about half a hour (e.g. during the time intervals 3.8–4.5 ks, 35.0–36.2 ks and 47–49 ks in Fig. 6). These flat-bottomed dips showed asymmetric profiles with a variety of timescales for the changes of the net count rates at the beginning and at the end of the dips, between tens of seconds and about ten minutes. Following a prolonged dipping episode lasting about half a hour, the source underwent a rather powerful flare (during the time interval 49.0–49.8 ks in Fig. 6) with a peak count rate of ∼2.8 counts s−1. It then entered a period of erratic (i.e. no more bimodal) variability characterised by a lower average count rate and sporadic flaring episodes superposed. These episodes exhibited different profiles (e.g. saw-toothed, triangular, flat-top, mono- and double-peaked) and variable duration in the range ∼1 − 10 min, and reached slightly different peak intensities.
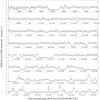 |
Fig. 6. 0.3–10 keV background-subtracted and exposure-corrected light curve of J1109 obtained with XMM-Newton EPIC with a time bin of 30 s. |
This change in the emission pattern can be visualised more clearly in the top-left panel of Fig. 7, where we report the distribution of the count rates separately for the first and second part of the observation. The morphologies of the two distributions are clearly different. The former (black colour in the figure) displays a double-peaked profile, which is adequately described by the superposition of two log-normal distributions with centroids at  counts s−1 and at 1.077 ± 0.008 counts s−1 for the secondary peak and the more prominent peak, respectively (
 for 9 d.o.f.). Based on the F-test, the inclusion of a second log-normal distribution component yielded a null-hypothesis probability of ≃3 × 10⁻⁵. The latter (red colour in the figure) is instead characterised by a single peak that is located in between the two peaks recorded during the first part of the observation, at a value of ≃0.6 counts s−1. The distribution decays smoothly with increasing count rate, and an additional, separate tail appears at ≳2.2 counts s−1. It is related to the above-mentioned flaring activity (no flares were instead registered over the first 49 ks of the observation).
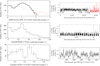 |
Fig. 7. Distribution of the count rates (left-hand panels) obtained from the binned background-subtracted and exposure-corrected light curves of J1109 extracted using different X-ray instruments (right-hand panels). The vertical error bars in the distributions are evaluated as the square root of the number of time bins measured in the corresponding count rate interval (i.e. as the standard deviation of a Poisson distribution). Top panel: from the XMM-Newton EPIC 30-s binned light curve, separately for the first 49 ks (in black) and the last 16 ks (in red) of the observation. The black solid line represents the best-fitting model for the former distribution, i.e. the superposition of two log-normal distributions (see the text for details). A logarithmic scale was adopted for the vertical axis, for better visualization. Middle panel: from the NuSTAR FPMA+FPMB 40-s binned light curve. The ∼3-ks long gaps in the light curve are due to Earth occultation. Bottom panel: from the Chandra ACIS-I 40-s binned light curve. |
A very similar variability pattern on the same timescales was observed at higher energy in the nearly simultaneous NuSTAR datasets, as well as in archival Chandra datasets. In particular, the NuSTAR data showed that J1109 maintained the state of erratic variability (and underwent a few more flares) at least until the end of the observation, hence for at least ∼12.7 ks after the end of the XMM-Newton pointing. We show the distribution of count rates derived from the NuSTAR and Chandra data and the corresponding light curves in the middle and bottom panels of Fig. 7, respectively. The histograms display a bimodal shape, although the relatively scarce photon counting statistics precludes a detailed sampling of the count rate distribution as for the XMM-Newton EPIC data.
We did not find any evidence for the presence of a recurrence time between consecutive dips or flares. Moreover, we did not observe any (anti-)correlation between the dip duration and the time elapsed before the occurrence of the following dip, or between the peak intensity reached during flares and their fluence, rise and/or decay time or overall duration.
To investigate correlations and lags between the soft and hard X-ray emissions, we extracted the light curves separately over the 0.3–2 keV and 2–10 keV energy ranges for the XMM-Newton EPIC data sets, and over the 3–7.5 keV and 7.5–79 keV energy intervals for the NuSTAR data. These energy ranges were selected so as to achieve a comparable number of source net counts in both bands. We computed the z-transformed discrete correlation function (zDCF) between the light curves adopting the algorithm developed by Alexander (1997), which is based upon the DCF method of Edelson & Krolik (1988). It is particularly effective for unevenly sampled datasets, as those acquired by NuSTAR. The zDCFs are reported in Fig. 8, and display a symmetric shape with a prominent peak at zero lag. We calculated the uncertainty on the peak width using the maximum likelihood method by Alexander (2013), and found the peak location to be consistent with absence of time lag (at 1σ c.l.)11.
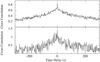 |
Fig. 8. z-transformed discrete correlation functions (zDCFs) between the light curves of J1109 extracted in the soft and hard X-ray energy bands from XMM-Newton EPIC pn (top panel) and NuSTAR FPMA+FPMB (bottom panel) data using a time step of 2 s (see Sect. 6.2.1 for the definitions adopted for the energy bands). The zDCFs have been normalised so as to account for Poisson noise. Positive time delays correspond to higher energy photons lagging lower energy photons. For plotting purpose, an extended range of time delays is shown, and uncertainties on the values have been omitted. |
Hereafter we define three different flux modes taking the EPIC 0.3–10 keV light curve as a baseline. We adopted the following selections for the count rate ranges: > 2.2 counts s−1 over the whole duration of the observation for the flare mode (leading to a total of eight distinct flaring episodes); [0.8–1.8] counts s−1 and < 0.4 counts s−1 during the first 49 ks of the observation for the high and low modes, respectively (see again Fig. 7). We checked that slightly different choices for the count rate thresholds yielded very similar results in the following analyses. Based on these choices, we estimated that J1109 spent fractional times of ∼2, ∼63 and ∼12% in the flare, high and low modes, respectively, during the XMM-Newton observation. The source spent also a non-negligible amount of time in a “transition” region, during which it switched back and forth across the different modes and hence attained values for the count rate outside the boundaries defined above. The lack of time delays between the soft and hard X-ray emissions (see above) led us to apply the good time interval files associated to the three modes in the EPIC data directly to the strictly simultaneous NuSTAR event files, and single out the flux modes over a broader energy interval. The resulting exposure times and count rates for the X-ray modes and the different X-ray instruments are listed in Table 5.
Journal of the X-ray modes of J1109 from the simultaneous XMM-Newton EPIC and NuSTAR data sets, and results of the spectral fits.
We computed a power density spectrum (PDS) over the whole EPIC pn observation length to search for periodicities having a probability smaller than p = 2.7 × 10⁻³ (corresponding to a 3σ c.l.) of being compatible with counting noise. No signal was detected over the 0.3–10 keV energy range, and we set an upper limit of A < 4.5% (3σ c.l.) on the root mean squared (rms) amplitude for any coherent signal with frequency lower than 1.5 kHz. We notice, however, that tMSPs in the sub-luminous accretion disk state showed a coherent X-ray signal only during the high mode (Archibald et al. 2015; Papitto et al. 2015). Moreover, we point out that a coherent X-ray signal searched over the whole 17 h-long observation could be easily washed out if the putative pulsar belongs to a tight binary system with an orbital period of a few hours (as for the case of tMSPs), owing to Doppler frequency shifts induced by the motion of the compact object along the orbit. Hence, we carried out a more honed search for periodicities selecting the time intervals corresponding to the high mode, and accounting for the effects of the unknown binary orbital motion as follows. First, we performed a search over time intervals of length Δt = 495 s, which represents the optimal choice for a circular orbit, a sinusoidal signal with a period of 2.5 ms, an orbital period of 12 h, a mass for the donor star of 0.3 M⊙ and a system inclination of i ∼ 45° (see Eq. (21) by Johnston & Kulkarni 1991). We derived a very loose upper limit of A < 67% on the rms pulse amplitude. We obtained a more constraining limit of A < 41% considering time intervals of length 2Δt. Shorter time intervals should be considered to search effectively for a signal from a faster-spinning pulsar in a tighter orbit ( , where P s is the spin period of the pulsar and Porb is the binary orbital period). However, the count rate of J1109 (≃0.5 counts s−1) is so low that a search over time intervals Δt < 495 s would be meaningless, as the amplitude sensitivity would be ≥100%. We then applied a quadratic coherence recovery technique (Wood et al. 1991; Vaughan et al. 1994). This is an acceleration search method that relies on the assumption that the sinusoidal Doppler modulation of the photons’ times of arrival caused by the motion along a circular orbit can be approximated well by a parabola over a restricted time interval. We considered time intervals of length 2Δt, i.e. the most effective for a spin period of 2.5 ms, an orbital period of 2.4 h, a mass for the donor star of 0.3 M⊙ and a system inclination of i ∼ 45° (see Eq. (22) by Johnston & Kulkarni 1991). We corrected the times of arrival in each time interval using the relation t′=αt2, where
 (1)
(1)
a sin(i)/c is the projected semi-major axis of the NS orbit and ϕ0 is the orbital phase at the beginning of the time series. We varied the coefficient of the quadratic term in steps equal to δα = 2.4 × 10⁻¹⁰ s−1 over the range −1.4 × 10⁻⁷ s−1 < α < 1.4 × 10⁻⁷ s−1, i.e. we performed Nα = 2αmax/δα = 1167 quadratic time transformations on each time interval (the step and the range were computed using Eq. (4) by Vaughan et al. 1994, assuming the values for the spin and orbital periods quoted above, as well as masses of 1.4 M⊙ and 0.3 M⊙ for the NS and the donor star, respectively). We extracted a PDS from all the corrected time series, and evaluated the detection level corresponding to a 3σ c.l. taking into account the number of quadratic time transformations in each time interval, the number of time intervals considered, and the number of independent frequencies examined in the PDS. We did not detect any periodic signal above this threshold, and set an upper limit of A < 42% (3σ c.l.) on the rms pulse amplitude.
To study the aperiodic time variability of J1109 more in detail, we extracted the PDS as follows: we first sampled the EPIC pn light curve with a time bin of 2−12 s (∼244 μs), and calculated power spectra into 211 s (2048 s) long consecutive time intervals (each spectrum is thus characterised by a frequency resolution of ≃0.5 mHz and a Nyquist limiting frequency of 2048 Hz). We then normalised each power spectrum following the prescription of Leahy et al. (1983), averaged the 30 spectra so evaluated, and rebinned the resulting spectrum as a geometric series with a step of 0.2. We estimated a counting statistics (Poisson) noise level of 1.9999(2) Hz−1 by fitting a constant term to the PDS above 200 Hz, and subtracted it from each power estimate. The white noise-subtracted PDS was then converted to fractional variance per unit frequency (Belloni & Hasinger 1990; Miyamoto et al. 1991). The stochastic variability of J1109 is characterised by an increasing noise component towards lower frequencies (i.e., red noise), which is adequately described by a power law, P(ν)∝ν−β, with β = 1.3 ± 0.1 ( for 58 d.o.f.; see Fig. 9). We obtained an identical slope when averaging power spectra computed over shorter time lengths (down to 512 s), and/or when applying different geometrical rebinning factors to the averaged spectrum. We did not find any evidence for a turnover in the noise component at low frequencies, not even in the power spectrum extracted using the whole duration of the time series (i.e. down to
  μHz). We integrated the best-fitting model for the PDS over the 0.5 mHz –100 Hz frequency interval, and estimated a fractional rms variability amplitude of ∼47% for the noise component over this frequency band (∼39% over the 0.5–10 mHz band). We also extracted the PDSs separately over the 0.3–2 keV and 2–10 keV energy bands, in the high and low modes, as well as over the first 49 ks and the last 16 ks of the observation (the flaring episodes were excluded from the time series). We did not find any change of the functional shape of the PDS either as a function of energy, flux or time. We repeated the analysis using the NuSTAR FPMs data, accounting for the 19 gaps in the time series due to Earth occultation and passages of the satellite through the SAA. We chose to compute the PDS from the co-added FPM light curves rather than to adopt the real component of the cross spectrum from the two light curves (a.k.a. co-spectrum), as the spurious effects resulting from the instrumental average dead time of ≃2.5 ms are expected to be negligible at the low average count rate of J1109 (≃0.06 counts s−1). Moreover, the PDS provides a better sensitivity to the presence of possible variability features than the co-spectrum, as the uncertainties on the powers computed with the PDS are smaller than those obtained with the co-spectrum by a factor of ≃21/2 (see Bachetti et al. 2015). We derived a best-fitting power law index fully consistent with that inferred from the analysis of the EPIC pn data. On the other hand, a similar analysis could not be performed using the Chandra and Swift XRT data owing to the coarser time resolution of the ACIS-I and the XRT, as well as the scarce number of source photon counts available.
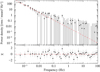 |
Fig. 9. White noise-subtracted power density spectrum of J1109 in the 0.1 mHz–100 Hz frequency range, computed from the EPIC pn data filtered over the 0.3–10 keV energy range. The red dashed line represents the best-fitting power law model (see the text for details). Post-fit residuals in units of standard deviations are shown in the bottom panel. |
6.2.2. Spectral properties
We performed all spectral fits within the XSPEC spectral package (v. 12.10.1; Arnaud 1996). We modelled the photoelectric absorption by the interstellar medium along the line of sight via the Tuebingen-Boulder model (TBABS in XSPEC), adopting the photoionization cross-sections from Verner et al. (1996) and the chemical abundances from Wilms et al. (2000). We fitted an absorbed power law model to the average XMM-Newton and NuSTAR spectra, including a renormalization factor to account for intercalibration uncertainties across the different instruments (these factors were always found consistent with each other within the uncertainties in all subsequent fits). We obtained a satisfactory description of the spectra, with  for 707 d.o.f. The best-fitting parameters were power law photon index of Γ = 1.64 ± 0.01 and absorption column density of NH = (5.3 ± 0.1) × 1021 cm−2. The unabsorbed flux was FX = (1.13 ± 0.02) × 10−11 erg cm−2 s−1 over the 0.3–79 keV energy band, translating into a luminosity of
  erg s−1 over the same band assuming isotropic emission. A thermal bremsstrahlung model was instead rejected by the data (
 for 707 d.o.f.). More physically-motivated models for the continuum emission (e.g. Comptonization models) are beyond the scope of this paper.
The spectra together with the best-fitting absorbed power law model and the post-fit residuals are shown in the left-hand panel of Fig. 10. We did not observe structured residuals over restricted energy intervals across the whole energy range that might hint at the presence of narrow and/or slightly broadened emission/absorption features. We set upper limits on the emission associated with the iron Kα complex by superimposing to the power law component Gaussian models centred either at 6.4 keV (corresponding to the neutral or low-ionised Fe I Kα1 and Kα2 atomic transitions), 6.7 keV (Helium-like Fe XXV), or 6.97 keV (Hydrogen-like Fe XXVI). In all fits, the absorption column density and the power law photon index were fixed to their best-fitting values, whereas the Gaussian width was fixed to zero to mimick lines narrower than the intrinsic spectral energy resolution of the different instruments. We derived 3σ upper limits of 63, 57 and 73 eV for the equivalent width of any Gaussian-like feature at 6.4, 6.7 and 6.97 keV, respectively.
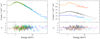 |
Fig. 10. Background-subtracted X-ray spectra of J1109 extracted over the 0.3–79 keV energy range from the simultaneous XMM-Newton and NuSTAR observations on 2018 June 20–21. Left-hand panel: spectra relative to the average emission. Black refers to the pn, red to MOS 1, green to MOS 2, blue to FPMA and cyan to FPMB. Right-hand panel: spectra relative to the flare, high and low X-ray modes separately. Only the XMM-Newton EPIC MOS1 (0.3–10 keV) and NuSTAR FPMA (3–79 keV) spectra are shown for plotting purposes. Orange and red refer to the flare mode, black and grey to the high mode, and blue and cyan to the low mode. In both panels the best-fitting absorbed power law model is indicated by the solid lines, and post-fit residuals in units of standard deviations are shown in the bottom panel. Data were re-binned to better visualise the trend in the spectral residuals. See the text and Table 5 for details. |
To check for possible spectral variations either as a function of time, energy and/or count rate without making any assumption on the spectral shape, we first extracted energy vs. time images by binning the source counts collected by EPIC pn into 80 s-long time bins and 50 eV-wide energy channels, and those collected by NuSTAR FPMs into 2.3 ks-long time bins and 1 keV-wide energy channels. We then normalised these images to the time-averaged energy spectrum and the energy-integrated light curve. Visual inspection of the normalised images did not yield any evidence for the presence of structured excesses or deficits of counts with respect to the time-averaged spectrum, i.e. for the presence of emission or absorption features in the spectrum that vary in time and/or energy. We also tried different binnings, and found the same result. As a second step, we computed a few hardness ratios (HRs) between the time series filtered in the same energy intervals used to compute the cross-correlation functions in the X-ray band (see Sect. 6.2.1). We adopted different time bins between 30 and 60 s (40 and 80 s) for EPIC (FPMs), so as to guarantee sufficient photon counting statistics in the bins corresponding to the low mode, the mode switchings and the shortest flaring episodes. We also evaluated the HRs by employing an adaptive rebinning of the source light curves (see, e.g. Bozzo et al. 2013), so as to achieve a S/N ≥ 10 in each soft time bin. In none of these cases we did find conspicuous variation of the HR. We repeated these analyses using slightly different selections for the energy ranges, and found the same result.
Nevertheless, a comprehensive analysis of several XMM-Newton data sets of the tMSP PSR J1023+0038 over the past 5 years revealed a non-negligible contribution from a soft, thermal component during the X-ray high mode, which was modelled in terms of radiation from both the NS polar caps and the accretion disk (with fractional contributions of ∼7 and ∼3%, respectively; Campana et al. 2016; Coti Zelati et al. 2018). Hence, we extracted the XMM-Newton EPIC and NuSTAR spectra separately for each mode, and carried out a count rate-resolved spectral analysis. We fitted an absorbed power law model to the spectra, fixing NH at the best-fitting average value and allowing the photon index to vary (as for the average spectra, renormalization factors were included to account for intercalibration uncertainties, and turned out to be always consistent with each other within the uncertainties). In all cases we obtained an adequate description of the data, with no need for an additional thermal component – either a blackbody model, a model describing the emission from a NS hydrogen atmosphere12 (NSATMOS; Heinke et al. 2006), or models reproducing the multicolour blackbody emission from an accretion disk (DISKBB, DISKPBB or DISKFBB) – in any of the modes.
The results of the spectral analysis for the three modes are summarised in Table 5, whereas the spectra, best-fitting models and post-fit residuals are shown in the right-hand panel of Fig. 10. The 1, 2 and 3σ contour plots for the power law index and the unabsorbed broad-band flux derived from the spectral fits of each X-ray mode (corresponding to Δχ2 = 2.30, 4.61 and 9.21, respectively) are reported in Fig. 11. They show that the values for the photon index in the different modes are compatible with each other (and with the average value) within 2σ. We also fitted an absorbed power law model to the broad-band X-ray spectra extracted separately for each flaring event and for each of the three longest episodes of low mode. We resorted to the Cash statistics owing to the paucity of counts available, and evaluated the quality of each fit by Monte Carlo simulations using the GOODNESS command within XSPEC. The power law photon indexes and fluxes turned out to be compatible with each other and with the values derived for the corresponding flare and low modes within the large uncertainties.
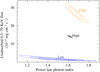 |
Fig. 11. 1, 2 and 3σ confidence regions for the power law photon index as a function of the unabsorbed flux over the 0.3–79 keV energy band for the best-fitting models of the flare (orange), high (black) and low (blue) mode spectra of J1109. The crosses mark the best-fitting values (see Table 5 for details). |
Finally, we fitted an absorbed power law model to the spectrum extracted using the last 16 ks of the XMM-Newton observation and after removal of the time intervals corresponding to the flaring events. We obtained a statistically acceptable result ( for 260 d.o.f.). The best-fitting photon index was Γ = 1.58 ± 0.02, again compatible within the uncertainties with that measured during both the high and low modes. The unabsorbed flux was (8.5 ± 0.4) × 10−12 erg cm−2 s−1 over the 0.3–79 keV energy range (yielding a luminosity
 ![Mathematical equation: $ [1.62 \pm 0.08] \times {10^{34}} d_4^2 $](/articles/aa/full_html/2019/02/aa34835-18/aa34835-18-eq22.gif) erg s−1 in the same band), i.e. a factor of ∼1.7 lower than that maintained in the high mode during the first part of the XMM-Newton observation. We conclude that there are no significant changes in the X-ray spectral shape as a function of the count rate and/or time.
erg s−1 in the same band), i.e. a factor of ∼1.7 lower than that maintained in the high mode during the first part of the XMM-Newton observation. We conclude that there are no significant changes in the X-ray spectral shape as a function of the count rate and/or time.
6.2.3. The long-term light curves
The archival observations of the field allowed us to extract the long-term light curve of J1109 in the soft X-ray band over an almost three-decade-long time span, between 1991 and 2018. We first fit an absorbed power law model to all Swift XRT and Chandra ACIS-I spectra. The absorption column density was fixed at NH = 5.3 × 1021 cm−2, the best-fitting value inferred from the joint fit of the XMM-Newton and NuSTAR spectra. The power law photon index was allowed to vary, and turned out to be consistent with being the same in all cases within the uncertainties. This implies no remarkable changes of the source spectral shape over the time span covered by the observations. On the other hand, the paucity of source counts collected during the ROSAT and XMM-Newton slew observations precluded any meaningful spectral modelling of these data sets. Hence, we converted the measured count rates into fluxes using the Portable, Interactive Multi-Mission Simulator (PIMMS, v. 4.9), assuming the best-fitting absorbed power law model derived from the analysis of the XMM-Newton and NuSTAR data (see Sect. 6.2.2). The time evolution of the unabsorbed flux of J1109 over the 0.3–10 keV energy band is shown in the top panel of Fig. 12. The source has maintained a relatively steady emission level over the time span covered by the observations in the past 10.5 yr, also comparable to that measured in 1991. The slight scatter between the data points, particularly evident for the case of the Swift XRT observations, is likely due to the fact that the short exposures of these pointings presumably sampled different modes (or a blend of different modes) at the different epochs. Fitting a constant term to the data points yields F0.3 − 10 keV = (4.36 ± 0.03) × 10−12 erg cm−2 s−1 ( for 10 d.o.f.).
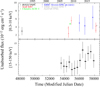 |
Fig. 12. Long-term light curves of J1109 in the X-ray bands. Top panel: over the 0.3–10 keV energy range, obtained from data with different observatories in the time interval from 1991 January 18 to 2018 June 21. Bottom panel: over the 15–150 keV energy range, obtained from data with the Swift BAT in the time interval from 2004 December 8 to 2017 October 1 with a time bin of 360 d. |
We modelled again the cumulative INTEGRAL IBIS/ISGRI and Swift BAT spectra with an absorbed power law model with parameters fixed to those derived from the joint fit of the XMM-Newton and NuSTAR data. We estimated unabsorbed fluxes of (5.2 ± 0.8) × 10−12erg cm−2 s−1 over the 20–50 keV energy range from the IBIS/ISGRI data (over the period 2003–2018; the spectral fit yielded  for 4 d.o.f.) and (8 ± 1) × 10−12 erg cm−2 s−1 over the 15–150 keV energy range from the BAT data (between 2004 and 2017; the spectral fit yielded
  for 7 d.o.f.). We extracted the hard X-ray light curve of J1109 again performing a count rate-to-flux conversion of the light curve downloaded from the Palermo BAT survey website, assuming the XMM-Newton plus NuSTAR spectrum (see the second panel of Fig. 12). J1109 has maintained a relatively steady flux in the hard X-ray band since 2004 (fitting a constant to the light curve yielded
  for 12 d.o.f.).
6.2.4. Upper limits on other persistent point sources compatible with FL8Y J1109.8−6500
We employed the Chandra datasets to set upper limits on the net count rate for any persistent point-like soft X-ray source located within the error ellipse of FL8Y J1109.8−6500 other than J1109 (we did not consider the XMM-Newton EPIC MOS and NuSTAR imaging data because the adopted instrumental setups provided a much smaller coverage of the error ellipse of the Fermi/LAT source compared to Chandra). We derived an upper limit of 8 × 10⁻⁴ counts s−1 over the 0.5–7.0 keV energy band (at the 90% c.l.), by means of the SRCFLUX tool within CIAO. This limit translates into an unabsorbed flux FX < (0.3 − 1.9) × 10−13 erg cm−2 s−1 over the 0.3–10 keV energy band. This value was estimated with PIMMS assuming an absorbed power law spectrum with column density equal to the contribution expected within the Galaxy towards the field (NH ∼ 6.7 × 1021 cm−2; Willingale et al. 2013), and photon index in the range 1 < Γ < 4. This is a factor ≳20 smaller than the average unabsorbed flux of J1109 within the same energy range (see Sect. 6.2.3).
6.3. The radio non-detections
We did not detect any radio counterpart to J1109 in our ATCA observations. We determined 3σ upper-limits on the flux density at the position of J1109 of 27 μJy beam−1 at 5.5 GHz and 24 μJy beam−1 at 9.0 GHz. Stacking the two images provided our deepest limit of 18 μJy beam−1 at a central frequency of 7.25 GHz (see Fig. 13 for the stacked image). Assuming a flat radio spectrum as typically observed in accreting compact objects, this value translates into a 5 GHz luminosity of  erg s−1. The radio counterpart was also not detected at either frequency or in our stacked image when dissecting the observation into the time intervals corresponding to the X-ray high and low modes recorded with NuSTAR (see Sect. 6.2.1). From the stacked images, we measured 3σ upper limits of F7.25 GHz < 24 μJy beam−1 and F7.25 GHz < 57 μJy beam−1 during the periods of high and low X-ray modes, respectively. Assuming again a flat spectrum, these values translate into luminosities of
  erg s−1 and
  erg s−1, respectively. In Sect. 7 we will use these limits and the luminosities over the 1–10 keV energy interval derived from the analysis of the simultaneous X-ray data (see Sect. 6.2.2) to place J1109 on the X-ray vs. radio luminosity plane for accreting compact objects, comparing the source emission properties with those observed in accreting NSs and, in particular, other tMSPs.
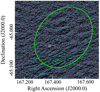 |
Fig. 13. Naturally-weighted 7.25 GHz image of the sky region around J1109, extracted from our 4.8 h long ATCA observation on 2018 June 20. A logarithmic scale was adopted for better visualization. The white circle is centred on the optical position of J1109, with an enlarged radius of 10 arcsec for imaging purposes. The green ellipse denotes the error region for the position of the Fermi/LAT gamma-ray source. |
6.4. The spectral energy distribution
The extensive multi-wavelength datasets collected for J1109 allow us to extract the time-averaged spectral energy distribution (SED) over a broad range spanning 17 orders of magnitudes in photon frequency, from the radio to the gamma-ray band. The SED is shown in Fig. 14.
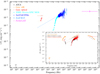 |
Fig. 14. Large panel: time-averaged spectral energy distribution of J1109 from the radio to the gamma-ray band. Vertical bars represent 1σ statistical uncertainties, whereas arrowheads indicate 95% upper limits. The blue dashed line represents the best-fitting power-law model for the average X-ray emission detected with XMM-Newton and NuSTAR, and its extrapolation to the optical and nIR bands. The X-ray spectrum has not been corrected for absorption. Inset: SEDs of J1109, PSR J1023+0038 (taken from Bogdanov et al. 2015), XSS J12270−4859 (from de Martino et al. 2015) and 1RXS J154439.4−112820 (from Bogdanov et al. 2018 for the optical, UV and X-ray data) plotted together to highlight their similarities among these systems in the sub-luminous accretion disk state (we note in particular the virtually identical slope of the power law model in the X-ray band). |
The line-of-sight extinction towards J1109 over the whole Gaia wavelength bandpass has not been determined (see Andrae et al. 2018). To infer the de-reddened optical and nIR brightness of J1109, we substituted the values for its magnitude and its colour quoted in the Gaia catalogue, G = 20.08 and GBp − GRp = 1.06 ± 0.02, into the conversion formulas by Evans et al. (2018). This allowed us to derive the magnitudes in the Johnson-Cousins (Landolt 2009) and 2MASS filters: V ∼ 20.3, R ∼ 19.8, I ∼ 19.4, J ∼ 18.7, H ∼ 18.3 and Ks ∼ 18.2. We did not consider the B-band magnitude measured with the XMM-Newton OM as representative of the average source brightness, as J1109 was detected only in a couple of exposures (see Sect. 6.1). The derived nIR magnitudes should be taken with caution, as these were obtained extrapolating the Gaia magnitude colour outside the nominal Gaia bandpass. The expected line-of-sight extinction in the V band can be estimated as AV = 1.85 ± 0.07, assuming the neutral hydrogen column density derived from the X-ray spectral fits, NH = 5.3 × 1021 cm−2, and the empirical conversion factor NH/AV = (2.87 ± 0.12) × 1021 cm−2 mag−1 (Foight et al. 201613). This value is smaller than the Galactic integrated extinction in the same band at the source position derived using the extinction maps by Schlafly & Finkbeiner (2011), AV ∼ 2.7. Based on the relations between the extinctions at different wavelengths (Schlafly & Finkbeiner 2011), we thus estimated extinction coefficients AR ∼ 1.47, AI ∼ 1.02, AJ ∼ 0.48, AH ∼ 0.30 and AKs ∼ 0.20. The derived de-reddened optical colours V − R ∼ 0.11, R − I ∼ −0.05 and V − I ∼ 0.07 are consistent with a blackbody at a temperature of Teff ∼ 11 000 K.
We attempted to constrain the location of the turnover between the X-ray and gamma-ray power law slopes by fitting a broken power law model to the SED data points over the 3 keV–100 GeV energy range, of the form:
 (2)
(2)
Here νb is the break frequency. The best-fitting value for the cut-off energy was  MeV (
MeV ( for 197 d.o.f.), where h is the Planck’s constant.
The SED of J1109 is shown also together with those obtained for PSR J1023+0038, XSS J12270−4859 and 1RXS J154439.4−112820 in the inset of Fig. 14.
7. Discussion
The results of our multi-wavelength study of the unidentified X-ray source J1109 can be summarised as follows.
The optical counterpart was detected at an average magnitude of ∼20.1 over the 3300–10 500 Å wavelength range. Considerable variability was observed on timescales ranging from hundreds to thousands of seconds. In particular, the optical brightness varied by ∼0.3 − 0.4 mag over an elapsed time of less than a ks (see Table 3). Optical spectra obtained at different epochs showed prominent Balmer emission lines with variable profiles. The de-reddened optical colours are consistent with a blackbody temperature of Teff ∼ 11 000 K, as typically observed in accreting systems. The distance estimated from parallax measurements using different assumptions, the proximity of the source to the Galactic plane (b ≃ −4.3°), and the presence of optical emission lines at a redshift of z ≃ 0, point to a location of J1109 within the Milky Way.
The X-ray spectral shape measured over the 0.3–79 keV energy band with our simultaneous XMM-Newton and NuSTAR observations was described adequately by an absorbed power law model with photon index of Γ ∼ 1.6, with no evidence for any cutoff. The average luminosity at the epoch of these observations was  erg s−1 over the same energy band. The X-ray emission showed dramatic short-term variability: J1109 spent about 60% of its time in a stable high mode, at a luminosity
  erg s−1 over the 0.3–79 keV energy band, which unpredictably alternated on timescales as short as tens of seconds to a stable low mode for about 10% of the time, at a luminosity
  erg s−1 over the same band. Sporadic flaring activity at a luminosity of
  erg s−1 was also observed on top of a more erratic, variable emission. No significant spectral changes were observed across the three modes. No statistically significant periodic signal was found in the power density spectrum. An upper limit of A < 42% (3σ c.l.) was set on the rms amplitude for any coherent signal with frequency lower than 1.5 kHz emitted by a pulsar in a tight orbit (orbital period of a few hours) during the high mode. The X-ray aperiodic time variability of J1109 was characterised by a red flicker noise component extending down to a few 10−5 Hz, which could be well modelled by a power law with index of β ∼ 1.3. Our recent X-ray observations were complemented by archival X-ray datasets with different space-born satellites (ROSAT, Swift, Chandra, INTEGRAL), covering a broad energy range. These again revealed a distinctive bimodal behaviour in the net count rates, and showed that the source has maintained a relatively steady average flux level over the time span covered by the observations.
The spatially associated gamma-ray source was detected by Fermi/LAT at an average luminosity of  erg s−1 over the 100 MeV–300 GeV energy band between 2008 and 2016, comparable to the average X-ray luminosity of J1109. Its integrated spectrum was well described by a power law with photon index of Γγ ∼ 2.6.
Radio continuum observations with ATCA (which were simultaneous with NuSTAR) resulted in a non-detection, with a 3σ upper limit on the 5 GHz luminosity of  erg s−1.
The multiband observational campaign that we conducted on J1109 allows us to compare several phenomenological properties of this source with those already observed in the three confirmed tMSPs (IGR J18245−2452, PSR J1023+0038 and XSS J12270−4859) during their peculiar sub-luminous accretion disk state, as well as in a couple of additional tMSP candidates, 1RXS J154439.4−112820 (Bogdanov & Halpern 2015; Bogdanov et al. 2018) and the eclipsing binary 1SXPS J042749.2−670434 (Strader et al. 2016; see Campana & Di Salvo 2018 for a comprehensive observational review). Before addressing the phenomenological analogies between J1109 and the above-mentioned systems in the next section, we point out that two other X-ray sources have been proposed recently as tMSP candidates: XMM J083850.4−282759 (Rea et al. 2017) and CXOGlb J174804.5−244641 amid the globular cluster Terzan 5 (Bahramian et al. 2018a).
7.1. A phenomenological comparison with confirmed and candidate tMSPs
Optical variability is commonly observed in the sub-luminous accretion disk state of tMSPs on a wide range of timescales, from seconds (e.g. Shahbaz et al. 2018) to weeks (Kennedy et al. 2018; Papitto et al. 2018). While the presence of a stable mode switching (similar to that detected in the X-ray band) is currently debated, tMSPs (and J1109 as well) are certainly observed to flicker and undergo sporadic flaring episodes in the optical with variable duration between tens of seconds and hours. In almost all cases, these flares correlate with the emissions in the X-ray band (see e.g. Jaodand et al. 2016 for a compilation of simultaneous X-ray and optical time series of PSR J1023+0038), as well as with those in the nIR and ultraviolet bands (see, e.g. de Martino et al. 2010, 2013; Saitou et al. 2009; Patruno et al. 2014; Bogdanov et al. 2015, 2018; Bogdanov & Halpern 2015; Strader et al. 2016; Shahbaz et al. 2018). Prominent emission lines in the optical spectrum typical of accreting systems were also observed for PSR J1023+0038 (e.g. Coti Zelati et al. 2014; Bogdanov et al. 2015), XSS J12270−4859 (de Martino et al. 2014) and 1SXPS J042749.2−670434 (Strader et al. 2016). In J1109 as well as in these other systems, the profiles of the Balmer lines are typically double-peaked. This is indicative of motion within an accretion disk around the NS.
The bimodal distribution in the net X-ray count rates of J1109 is strikingly similar to that observed over a broad X-ray energy range (and also over years) in almost all the known tMSPs in the sub-luminous accretion disk state (e.g. Saitou et al. 2009; de Martino et al. 2010, 2013; Linares 2014; Tendulkar et al. 2014; Bogdanov et al. 2015; Jaodand et al. 2016; Coti Zelati et al. 2018). The rapid timescale of the switches and the fraction of time spent in each of the three modes are also reproducible, not only from source to source, but also across observations of the same target at different epochs. We note, however, that such a remarkable similarity among the tMSPs might represent only a fluke, due to the small sample size of tMSPs caught so far in the sub-luminous accretion disk state, as well as to the detection of an “anomalous” 10 h long low mode in the X-ray emission of IGR J18245−2452 (Papitto et al. 2015; Linares et al. 2014). Although no flares have been reported yet from the tMSP candidates 1RXS J154439.4−112820 and 1SXPS J042749.2−670434, intense flares with a variety of morphologies and durations have been observed in almost all high-time resolution XMM-Newton and NuSTAR observations of PSR J1023+0038 and XSS J12270−4859 (e.g. de Martino et al. 2010, 2013; Jaodand et al. 2016). Interestingly, a common characteristic shared by J1109 and these two tMSPs is that the onset of (brighter) flaring events is often preceded by relatively long time intervals of low mode. For example, both XSS J12270−4859 and PSR J1023+0038 persisted in the low mode for about ∼20 min before undergoing a sustained flaring activity during XMM-Newton observations in 2011 January and 2015 November, respectively. There is, however, no evidence for any significant correlation between the duration of the low mode and that of the subsequent flares or their peak intensity. Moreover, in J1109, XSS J12270−4859 and PSR J1023+0038, flares are typically interspersed with time intervals of lower flux where the X-ray emission varies erratically, at odds with the flat-bottomed emission observed during the low mode. The highly reproducible pattern of the light curve in different observations and the remarkable steadiness of both the high and low mode intensity levels over timescales of years suggest a negligible impact of the flaring events on the emission properties in the two modes, in tMSPs as well as in J1109.
The upper limit that we derived on the pulse fractional amplitude for any coherent signal during the high mode, A < 42%, does not constrain significantly the presence of X-ray pulsations from J1109 as it is much larger than the typical amplitudes measured for tMSPs in the same mode, ≃8% (Archibald et al. 2015; Papitto et al. 2015). The aperiodic time variability of J1109 lacks the typical flat-topped low-frequency noise observed in several accreting MSPs (with characteristic frequency within the 0.1–1 Hz interval; see e.g. van Straaten et al. 2005). This appears, however, to be a hallmark of tMSPs. In particular, the functional shape of the noise of J1109 – a power law with index β ∼ 1.3 – is similar to that already reported for other members of the class (Papitto et al. 2015; Ferrigno et al. 2014 for the case of IGR J18245−2452; Tendulkar et al. 2014 for PSR J1023+0038; Hernández Santisteban 2016; Papitto et al. 2018 for analogous studies of PSR J1023+0038 in the UV and optical bands, respectively). We also performed a preliminary study of the aperiodic time variability of both 1RXS J154439.4−112820 and 1SXPS J042749.2−670434 using NuSTAR and XMM-Newton data publicly available, and adopting a similar procedure to that described in Sect. 6.2.1. We derived again a similar slope, β ∼ 1.4 − 1.5.
The X-ray spectral shape of J1109 is virtually identical to that observed for the average emission of all tMSPs in the sub-luminous accretion disk state (e.g. de Martino et al. 2013; Bogdanov et al. 2018; Strader et al. 2016; Coti Zelati et al. 2018). J1109 was always caught at a similar X-ray flux across a broad energy band over the past ≳15 yr. The detection during an archival ROSAT observation in 1991 at comparable flux is probably indicative of an even longer X-ray active state, although the lack of sensitive X-ray observations of the field between 1991 and 2003 cannot rule out – at least in principle – a possible switch back and forth to a fainter X-ray state over this time period. Similar prolonged (≳8 yr) sub-luminous states were observed also in the two tMSP candidates 1RXS J154439.4−112820 (Bogdanov & Halpern 2015) and 1SXPS J042749.2−670434 (Strader et al. 2016). Furthermore, the case of J1109 is very similar to that of XSS J12270−4859, which was also detected by ROSAT, the Rossi X-ray Timing Explorer, INTEGRAL and Swift BAT before switching to a X-ray fainter disk-free, rotation-powered state in 2013 (e.g. de Martino et al. 2010; Papitto et al. 2014). We note that no pulsar spatially coincident with J1109 is listed in the most updated online version of the Australia Telescope National Facility (ATNF) pulsar catalogue (v. 1.59; see Manchester et al. 2005). However, no deep searches for radio pulses from the source position have been performed to our knowledge. Dedicated studies are required to investigate whether a radio pulsar is turned on during the current state of J1109. The dispersion measure expected at the position and distance of J1109 is comparatively large, DM ≈ 390 cm−3 pc according to the state of the art model for the distribution of free electrons in the Galaxy (Yao et al. 2017)14.
The gamma-ray emission properties of the Fermi source associated to J1109 also closely resemble those observed for PSR J1023+0038 and XSS J12270−4859 and the candidates 1RXS J154439.4−112820 and 1SXPS J042749.2−670434 in the sub-luminous accretion disk state, i.e. the only known NS LMXBs hitherto known for which a GeV counterpart has been established unambiguously. All these systems show a power-law like spectrum (Torres et al. 2017 and references therein) extending up to a much higher energy compared to the rotation-powered state, and slightly softer (Γγ ∼ 2.4 − 2.5) than that measured in the X-ray band (Γ ∼ 1.5 − 1.7). The larger photon counting statistics available for the two brightest gamma-ray sources, PSR J1023+0038 and XSS J12270−4859, led additionally to the detection of a statistically significant spectral cut-off in these systems, at energy EC ∼ 3 GeV and ∼11 GeV, respectively (and a slightly harder photon index of Γγ ∼ 2.0, 2.3 compared to the simple power law model; see Torres et al. 2017; Xing et al. 2018). The ratio between the average gamma-ray and X-ray luminosities is also compatible across all these systems when in the sub-luminous accretion disk state, and of the order of unity: L0.1 − 300 GeV/L0.3 − 79 keV ∼ 0.7, 2.4, 1.8, 1.5 and 1 for J1109, PSR J1023+0038, XSS J12270−4859, 1RXS J154439.4−112820 and 1SXPS J042749.2−670434, respectively. A summary of the multiband emission properties of confirmed and candidate tMSPs in the sub-luminous accretion disk state is reported in Table 6.
Multi-wavelength emission properties of the confirmed and candidate tMSPs in the sub-luminous accretion disk state; other systems properties are also listed.
Notably, the SED reported in Fig. 14 indicates that the extrapolation of the best-fitting power-law model for the X-ray spectrum (corrected for the effects of interstellar absorption) towards lower photon frequencies predicts an optical and nIR flux which is smaller than that inferred using Gaia measurements. This implies that the emission process responsible for the X-ray flux cannot account for the bulk of the optical and nIR emissions. Such optical/nIR excess was reported also for the cases of XSS J12270−4859 (de Martino et al. 2013, 2015), PSR J1023+0038 (Coti Zelati et al. 2014; Bogdanov et al. 2015) and the tMSP candidate 1RXS J154439.4−112820 (Bogdanov et al. 2018), and it was ascribed to emission from the donor and the accretion disk surrounding the NS (see the inset of Fig. 14). The energy of the spectral turnover between the X-ray and gamma-ray power law slopes in J1109, although only poorly constrained, is of the same order of magnitude of that estimated for other tMSPs (see, e.g. Tendulkar et al. 2014). X-/gamma-ray observations with instruments covering the MeV–GeV energy range, such as those of the originally proposed mission e-ASTROGAM (de Angelis et al. 2018), could constrain better the energy of the spectral turnover of J1109 and tMSPs in general.
The only property that makes J1109 seemingly at odds with the other tMSPs is the non-detection of its radio counterpart, as all tMSPs studied so far were observed to emit in the radio band in the sub-luminous accretion disk state. In these other systems, the radio emission is characterised by a flat to slightly inverted spectrum (α ∼ 0 − 0.5, where Fν ∝ να) that is significantly different from the typical pulsar-like steep spectrum (α < −1.5) observed during the disk-free, rotation-powered state. The emission is also rapidly variable, a factor of ∼2 − 3 on timescales of minutes (Ferrigno et al. 2014; de Martino et al. 2015; Deller et al. 2015). Radio counterparts were detected also for 1RXS J154439.4−112820 and 1SXPS J042749.2−670434 at 5 GHz in ATCA observations in 2012 September (Petrov et al. 2013). The radio:X-ray luminosity plane for accreting compact objects including J1109 is shown in Fig. 15 (see Bahramian et al. 2018b for an updated compilation). Recently, Gallo et al. (2018) performed a comprehensive regression analysis aimed at characterising empirically the shape of the correlation between the radio and X-ray luminosities for different classes of accreting compact objects. In particular, they found that the correlation holding for a sample of 41 NSs (including all known accreting X-ray MSPs and the 3 tMSPs) can be described by the following formula:
![Mathematical equation: $$ \begin{aligned} \mathrm{Log}\Bigg (\frac{L_{5\,\mathrm{GHz}}}{\mathrm{erg\,s}^{-1}}\Bigg ) =&(28.40\,{\pm }\,0.15)\nonumber \\&+ 0.44_{-0.13}^{+0.15} \Bigg [\mathrm{Log}\Bigg (\frac{L_{1-10\,\mathrm{KeV}}}{\mathrm{erg\,s}^{-1}}\Bigg ) -36.30 \Bigg ], \end{aligned} $$](/articles/aa/full_html/2019/02/aa34835-18/aa34835-18-eq41.gif) (3)
(3)
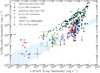 |
Fig. 15. Radio vs. X-ray luminosity plane for different classes of accreting compact objects, adapted from Bahramian et al. (2018b). Data points for PSR J1023+0038 and J1109 (see the green triangles) are plotted also separately for the high and low X-ray modes (Bogdanov et al. 2018 and this work). The data point for IGR J18245−2452 (M28I) was derived from strictly simultaneous ATCA and Swift XRT observations (Ferrigno et al. 2014), and we computed its position on the plane after performing time-resolved spectral analysis of Swift XRT data (obs. ID 00032785003). Upper limits are denoted by arrowheads. The cyan shaded area encloses the 3σ confidence interval on the shape of the correlation holding for accreting NSs (see Gallo et al. 2018 and the text for more details). |
where the uncertainties on the constant and theslope are quoted at the 3σ c.l. (see the cyan shaded area in Fig. 15). Assuming that J1109 follows the correlation described by Eq. (3), we would expect an average radio flux density within the range ≈8 − 50 μJy at 5 GHz based on the X-ray luminosity estimated from our XMM-Newton and NuSTAR observations. Therefore, the 3σ flux upper limit of 18 μJy beam−1 (at 7.25 GHz) that we derived in Sect. 6.3 would be consistent with the presence of a faint radio counterpart. Furthermore, we note that the shape of the correlation has become more uncertain very recently following the discovery of radio emission from the Be/X-ray binary system Swift J0243.6+6124 during its outburst decay between 2017 October and 2018 January (van den Eijnden et al. 2018), as well as of bright radio emission from the accreting MSP IGR J17591−2342 during the early stages of its outburst in 2018 August (Russell et al. 2018). Accounting for these detections leads to an even wider parameter space allowed for accreting NSs on the radio:X-ray luminosity plane (see Fig. 3 by van den Eijnden et al. 2018 and Fig. 2 by Russell et al. 2018).
We also stress that the non-detection of the radio counterpart would not be so surprising if the anti-correlated variability pattern between the radio and X-ray emissions (Ferrigno et al. 2014; Bogdanov et al. 2018) is ubiquitous for all tMSPs. The NuSTAR light curve shows that J1109 spent overall only ∼30 min in the X-ray low mode during the time span strictly simultaneous with the radio observation (this value shall be deemed however merely as a lower limit, owing to the uneven sampling of the light curve extracted from the NuSTAR datasets). Assuming that J1109 follows such an anti-correlation as well, we would expect the source to have attained a radio high mode only for ≲10% of the whole ATCA on-source time. In Fig. 15 we also report the position occupied by J1109 on the radio:X-ray luminosity plane separately during the X-ray high and low modes (see Table 5 and Sect. 6.3). In particular, the upper limit derived on the radio luminosity during the X-ray low mode of J1109, L5 GHz < 1028 erg s−1, clearly stands above the region occupied by tMSPs and the NS population as a whole. Deeper radio continuum observations would be thus needed to possibly detect any radio emission from J1109.
8. Conclusions
In search for transitional pulsars lurking behind new unassociated Fermi/LAT gamma-ray sources, we carried out an intensive multi-wavelength observing campaign spanning the optical, X-ray and radio bands of the unidentified X-ray source CXOU J110926.4−650224 (J1109). We discovered that J1109 is characterised by several hallmark phenomenological properties of tMSPs in the enigmatic sub-luminous accretion disk state. Hence, we propose it as a new tMSP candidate.
J1109 represents the first case so far for a tMSP candidate whose GeV counterpart became detectable only after more than four years of continuous monitoring of the gamma-ray sky by the Fermi/LAT. We are currently scrutinising the LAT eight-year point source list and investigating systematically the multiband properties of several unidentified sources case by case, in an effort to select new potential gamma-ray faint tMSP candidates in this unique transitional phase. Meanwhile, we will monitor J1109 on a regular cadence to assess the evolution of its emission properties over a longer time span, and unveil possible marked changes that would signal the long-sought state transition typical of tMSPs.
This list is preliminary as reported at https://fermi.gsfc.nasa.gov/ssc/data/access/lat/fl8y/
The uncertainty radius was computed as the sum of the positional systematic uncertainty of the ACIS (Weisskopf et al. 2005) and the statistical uncertainty derived from the source counts and its distance from the aim point (see Eq. (14) by Kim et al. 2007).
Bp and Rp represent the magnitudes measured by the Blue and Red Photometers on board Gaia, respectively.
NUSTARDAS v. 1.9.3 is distributed along with HEASOFT v. 6.25.
We used the codes available at http://www.weizmann.ac.il/particle/tal/research-activities/software
The NS mass, radius and distance were held fixed to MNS = 1.4 M⊙, RNS = 10 km and D = 4 kpc.
The formula was derived from X-ray and optical studies of supernova remnants using the chemical abundances by Wilms et al. (2000), i.e. the same that we assumed to evaluate the absorption column density towards J1109.
Acknowledgments
We are grateful to the XMM-Newton, NuSTAR and ATCA teams for the effort in scheduling the simultaneous ToO observations of CXOU J110926.4−650224. FCZ acknowledges Poshak Gandhi for sharing his code to compute the prior based on the 3D model of the distribution of Galactic LMXBs. We acknowledge the International Space Science Institute (ISSI, Bern) that funded and hosted the international team “The disk-magnetosphere interaction around transitional millisecond pulsars”. We thank the referee for comments. We made use of data from the ESA mission Gaia (https://www.cosmos.esa.int/gaia), processed by the Gaia Data Processing and Analysis Consortium (DPAC, https://www.cosmos.esa.int/web/gaia/dpac/consortium). Funding for the DPAC has been provided by national institutions, in particular the institutions participating in the Gaia Multilateral Agreement. We also made use of data from the Two Micron All Sky Survey, which is a joint project of the University of Massachusetts and the Infrared Processing and Analysis Center/California Institute of Technology, funded by the National Aeronautics and Space Administration (NASA) and the National Science Foundation (NSF). Some of the observations reported in this paper were obtained with the Southern African Large Telescope (SALT), as part of the Large Science Programme on transients 2016-2-LSP-001 (PI: Buckley). Some of the scientific results reported in this study are based on observations obtained with XMM-Newton and INTEGRAL, which are European Space Agency (ESA) science missions with instruments and contributions directly funded by ESA Member States and NASA; The Neil Gehrels Swift Observatory, which is a NASA/UK/ASI mission; and the NuSTAR mission, which is a project led by the California Institute of Technology, managed by the Jet Propulsion Laboratory and funded by NASA. The Australia Telescope Compact Array is part of the Australia Telescope National Facility, which is funded by the Australian Government for operation as a National Facility managed by CSIRO. IRAF is distributed by the National Optical Astronomy Observatory (NOAO), which is operated by the Association of Universities for Research in Astronomy (AURA) under a cooperative agreement with the NSF. PYRAF is a product of the Space Telescope Science Institute, which is operated by AURA for NASA. This research has made use of the NuSTAR Data Analysis Software (NuSTARDAS) jointly developed by the ASI Science Data Center (ASDC) and the California Institute of Technology, as well as of software provided by the Chandra X-ray Center (operated for and on behalf of NASA by the Smithsonian Astrophysical Observatory [SAO] under contract NAS8–03060) in the application package CIAO. We made use of data supplied by the UK Swift Science Data Centre at the University of Leicester and of the XRT Data Analysis Software (XRTDAS). We also used softwares and tools provided by the High Energy Astrophysics Science Archive Research Center (HEASARC) Online Service, which is a service of the Astrophysics Science Division at NASA/GSFC and the High Energy Astrophysics Division of SAO. This research has made use of the Palermo BAT Catalogue and database operated at INAF – IASF Palermo. FCZ, DFT and NR are supported by grants SGR2017-1383, AYA2017-92402-EXP and iLink 2017-1238. FCZ is also supported by a Juan de la Cierva fellowship. AP and DdM acknowledge financial support from the Italian Space Agency and National Institute for Astrophysics, ASI/INAF, under agreements ASI-INAF I/037/12/0 and ASI-INAF n.2017-14-H.0. AP also acknowledges funding from the EUs Horizon 2020 Framework Programme for Research and Innovation under the Marie Skłodowska-Curie Individual Fellowship grant agreement 660657-TMSP-H2020-MSCA-IF-2014. DAHB is supported by the National Research Foundation (NRF) of South Africa. JL acknowledges support from the Alexander von Humboldt Foundation. TDR is supported by a Veni grant from the Netherlands Organization for Scientific Research (NWO). MG is supported by Polish National Science Centre grant OPUS 2015/17/B/ST9/03167. Polish participation in SALT is funded by grant no. MNiSW DIR/WK/2016/07. We acknowledge support from The National Key Research and Development Program of China (2016YFA0400800), the National Natural Science Foundation of China via NSFC-11473027, NSFC-11503078, NSFC-11673013, NSFC-11733009 and the Strategic Priority Research Program “The Emergence of Cosmological Structures” of the Chinese Academy of Sciences, grant No. XDB09000000. We thank the PHAROS COST Action (CA16214) for partial support.
References
- Alexander, T. 1997, in Is AGN Variability Correlated with Other AGN Properties? ZDCF Analysis of Small Samples of Sparse Light Curveseds. D. Maoz, A. Sternberg, & E. M. Leibowitz (Dordrecht: Kluwer), Astron. Time Ser., 163 [Google Scholar]
- Alexander, T. 2013, ArXiv e-prints [arXiv:1302.1508] [Google Scholar]
- Alpar, M. A., Cheng, A. F., Ruderman, M. A., & Shaham, J. 1982, Nature, 300, 728 [NASA ADS] [CrossRef] [Google Scholar]
- Ambrosino, F., Papitto, A., Stella, L., et al. 2017, Nature Astron., 1, 266 [Google Scholar]
- Andrae, R., Fouesneau, M., Creevey, O., et al. 2018, A&A, 616, A8 [NASA ADS] [CrossRef] [EDP Sciences] [Google Scholar]
- Archibald, A. M., Stairs, I. H., Ransom, S. M., et al. 2009, Science, 324, 1411 [Google Scholar]
- Archibald, A. M., Bogdanov, S., Patruno, A., et al. 2015, ApJ, 807, 62 [NASA ADS] [CrossRef] [Google Scholar]
- Arnaud, K. A. 1996, in Astronomical Data Analysis Software and Systems V, eds. G. H. Jacoby, & J. Barnes (San Francisco, CA: Astron. Soc. Pac.), ASP Conf. Ser., 101, 17 [NASA ADS] [Google Scholar]
- Atwood, W. B., Abdo, A. A., Ackermann, M., et al. 2009, ApJ, 697, 1071 [CrossRef] [Google Scholar]
- Bachetti, M., Harrison, F. A., Cook, R., et al. 2015, ApJ, 800, 109 [NASA ADS] [CrossRef] [Google Scholar]
- Bahramian, A., Strader, J., Chomiuk, L., et al. 2018a, ApJ, 864, 28 [NASA ADS] [CrossRef] [Google Scholar]
- Bahramian, A., Miller-Jones, J., Strader, J., et al. 2018b, Zenodo, DOI 10.5281/zenodo.1252036 [Google Scholar]
- Bailer-Jones, C. A. L., Rybizki, J., Fouesneau, M., Mantelet, G., & Andrae, R. 2018, AJ, 156, 58 [Google Scholar]
- Barthelmy, S. D., Barbier, L. M., Cummings, J. R., et al. 2005, Space Sci. Rev., 120, 143 [Google Scholar]
- Bassa, C. G., Patruno, A., Hessels, J. W. T., et al. 2014, MNRAS, 441, 1825 [Google Scholar]
- Belloni, T., & Hasinger, G. 1990, A&A, 230, 103 [NASA ADS] [Google Scholar]
- Bogdanov, S., Deller, A., Miller-Jones, J. C. A., et al. 2018, ApJ, 856, 54 [NASA ADS] [CrossRef] [Google Scholar]
- Bogdanov, S., & Halpern, J. P. 2015, ApJ, 803, L27 [NASA ADS] [CrossRef] [Google Scholar]
- Bogdanov, S., Archibald, A. M., Bassa, C., et al. 2015, ApJ, 806, 148 [NASA ADS] [CrossRef] [Google Scholar]
- Bogdanov, S., Deller, A., Miller-Jones, J. C. A., et al. 2018, ApJ, 856, 54 [NASA ADS] [CrossRef] [Google Scholar]
- Bird, A. J., Bazzano, A., Malizia, A., et al. 2016, ApJS, 223, 15 [Google Scholar]
- Bozzo, E., Romano, P., Ferrigno, C., et al. 2013, A&A, 556, A30 [NASA ADS] [CrossRef] [EDP Sciences] [Google Scholar]
- Britt, C. T., Strader, J., Chomiuk, L., et al. 2017, ApJ, 849, 21 [NASA ADS] [CrossRef] [Google Scholar]
- Buckley, D. A. H., Swart, G. P., & Meiring, J. G. 2006, SPIE, 6267 [Google Scholar]
- Buckley, D. A. H., Barnes, S. I., Burgh, E. B., et al. 2008, SPIE, 7014, 07 [Google Scholar]
- Burgh, E. B., Nordsieck, K. H., Kobulnicky, H. A., et al. 2003, SPIE, 4841, 1463 [Google Scholar]
- Burrows, D. N., Hill, J. E., Nousek, J. A., et al. 2005, Space Sci. Rev., 120, 165 [Google Scholar]
- Campana, S., & Di Salvo, T. 2018, Physics and Astrophysics of Neutron Stars (NewCompStar COST Action), 1304 [Google Scholar]
- Campana, S., Coti Zelati, F., Papitto, A., et al. 2016, A&A, 594, A31 [NASA ADS] [CrossRef] [EDP Sciences] [Google Scholar]
- Cash, W. 1979, ApJ, 228, 939 [Google Scholar]
- Coti Zelati, F., Baglio, M. C., Campana, S., et al. 2014, MNRAS, 444, 1783 [NASA ADS] [CrossRef] [Google Scholar]
- Coti Zelati, F., Campana, S., Braito, V., et al. 2018, A&A, 611, A14 [NASA ADS] [CrossRef] [EDP Sciences] [Google Scholar]
- Courvoisier, T. J.-L., Walter, R., Beckmann, V., et al. 2003, A&A, 411, 53 [Google Scholar]
- Crawford, S. M., Still, M., Schellart, P., et al. 2010, SPIE, 7737, 25 [Google Scholar]
- Cusumano, G., Segreto, A., La Parola, V., & Maselli, A. 2014, SPIE [Google Scholar]
- de Angelis, A., Tatischeff, V., Grenier, I. A., et al. 2018, JHEAp, 19, 1 [Google Scholar]
- Deller, A. T., Moldon, J., Miller-Jones, J. C. A., et al. 2015, ApJ, 809, 13 [NASA ADS] [CrossRef] [Google Scholar]
- de Martino, D., Falanga, M., Bonnet-Bidaud, J.-M., et al. 2010, A&A, 515, A25 [NASA ADS] [CrossRef] [EDP Sciences] [Google Scholar]
- de Martino, D., Belloni, T., Falanga, M., et al. 2013, A&A, 550, A89 [NASA ADS] [CrossRef] [EDP Sciences] [Google Scholar]
- de Martino, D., Casares, J., Mason, E., et al. 2014, MNRAS, 444, 3004 [Google Scholar]
- de Martino, D., Papitto, A., Belloni, T., et al. 2015, MNRAS, 454, 2190 [NASA ADS] [CrossRef] [Google Scholar]
- den Herder, J. W., Brinkman, A. C., Kahn, S. M., et al. 2001, A&A, 365, L7 [NASA ADS] [CrossRef] [EDP Sciences] [Google Scholar]
- Edelson, R. A., & Krolik, J. H. 1988, ApJ, 333, 646 [Google Scholar]
- Evans, D. W., Riello, M., De Angeli, F., et al. 2018, A&A, 616, A4 [NASA ADS] [CrossRef] [EDP Sciences] [Google Scholar]
- Ferrigno, C., Bozzo, E., Papitto, A., et al. 2014, A&A, 567, A77 [NASA ADS] [CrossRef] [EDP Sciences] [Google Scholar]
- Foight, D., Güver, T., Özel, F., & Slane, P. 2016, ApJ, 826, 66 [NASA ADS] [CrossRef] [Google Scholar]
- Fruscione, A., McDowell, J. C., Allen, G. E., et al. 2006, Proc. SPIE Conf. Ser., 6270, 62701V [NASA ADS] [CrossRef] [Google Scholar]
- Frater, R. H., Brooks, J. W., & Whiteoak, J. B. 1992, J. Electr. Electron. Eng. Aust., 12, 103 [Google Scholar]
- Gaia Collaboration (Brown, A. G. A., et al.) 2018, A&A, 616, A1 [NASA ADS] [CrossRef] [EDP Sciences] [Google Scholar]
- Gallo, E., Degenaar, N., & van den Eijnden, J. 2018, MNRAS, 478, 132 [Google Scholar]
- Gandhi, P., Rao, A., Johnson, M. A. C., et al. 2018, MNRAS, submitted [arXiv:1804.11349] [Google Scholar]
- Garmire, G. P., Bautz, M. W., Ford, P. G., et al. 2003, eds. in X-Ray and Gamma-Ray Telescopes and Instruments (Bellingham: SPIE), Proc. SPIE, 4851, 28 [NASA ADS] [CrossRef] [Google Scholar]
- Gehrels, N., Chincarini, G., Giommi, P., et al. 2004, ApJ, 611, 1005 [Google Scholar]
- Grimm, H.-J., Gilfanov, M., & Sunyaev, R. 2002, A&A, 391, 923 [NASA ADS] [CrossRef] [EDP Sciences] [Google Scholar]
- Harris, W. E. 1996, AJ, 112, 1487 [Google Scholar]
- Harrison, F. A., Craig, W. W., Christensen, F. E., et al. 2013, ApJ, 770, 103 [Google Scholar]
- Heinke, C. O., Rybicki, G. B., Narayan, R., & Grindlay, J. E. 2006, ApJ, 644, 1090 [NASA ADS] [CrossRef] [Google Scholar]
- Hernández Santisteban, J. V. 2016, PhD Thesis, University of Southampton [Google Scholar]
- H.E.S.S. Collaboration (Abdalla, H., et al.) 2018, A&A, 612, A1 [NASA ADS] [CrossRef] [EDP Sciences] [Google Scholar]
- Jansen, F., Lumb, D., Altieri, B., et al. 2001, A&A, 365, L1 [NASA ADS] [CrossRef] [EDP Sciences] [Google Scholar]
- Jaodand, A., Archibald, A. M., Hessels, J. W. T., et al. 2016, ApJ, 830, 122 [Google Scholar]
- Jennings, R. J., Kaplan, D. L., Chatterjee, S., Cordes, J. M., & Deller, A. T. 2018, ApJ, 864, 26 [NASA ADS] [CrossRef] [Google Scholar]
- Johnston, H. M., & Kulkarni, S. R. 1991, ApJ, 368, 504 [NASA ADS] [CrossRef] [Google Scholar]
- Kaastra, J. S., & Bleeker, J. A. M. 2016, A&A, 587, A151 [NASA ADS] [CrossRef] [EDP Sciences] [Google Scholar]
- Kennedy, M. R., Clark, C. J., Voisin, G., & Breton, R. P. 2018, MNRAS, 477, 1120 [NASA ADS] [CrossRef] [Google Scholar]
- Kim, M., Kim, D.-W., Wilkes, B. J., et al. 2007, ApJS, 169, 401 [NASA ADS] [CrossRef] [Google Scholar]
- Kobulnicky, H. A., Nordsieck, K. H., Burgh, E. B., et al. 2003, SPIE, 4841, 1634 [NASA ADS] [Google Scholar]
- Landolt, A. U. 2009, AJ, 137, 4186 [Google Scholar]
- Lanzoni, B., Ferraro, F. R., Dalessandro, E., et al. 2010, ApJ, 717, 653 [Google Scholar]
- Leahy, D. A., Darbro, W., Elsner, R. F., et al. 1983, ApJ, 266, 160 [NASA ADS] [CrossRef] [Google Scholar]
- Lebrun, F., Leray, J. P., Lavocat, P., et al. 2003, A&A, 411, 141 [Google Scholar]
- Linares, M. 2014, ApJ, 795, 7 [NASA ADS] [CrossRef] [Google Scholar]
- Linares, M., Bahramian, A., Heinke, C., et al. 2014, MNRAS, 438, 251 [NASA ADS] [CrossRef] [Google Scholar]
- Lindegren, L., Hernández, J., Bombrun, A., et al. 2018, A&A, 616, A2 [NASA ADS] [CrossRef] [EDP Sciences] [Google Scholar]
- Lund, N., Budtz-Jørgensen, C., Westergaard, N. J., et al. 2003, A&A, 411, 231 [Google Scholar]
- Manchester, R. N., Hobbs, G. B., Teoh, A., & Hobbs, M. 2005, AJ, 129, 1993 [Google Scholar]
- Mason, K. O., Breeveld, A., Much, R., et al. 2001, A&A, 365, L36 [NASA ADS] [CrossRef] [EDP Sciences] [Google Scholar]
- McMullin, J. P., Waters, B., Schiebel, D., Young, W., & Golap, K. 2007, ASPC, 376, 127 [Google Scholar]
- Miyamoto, S., Kimura, K., Kitamoto, S., et al. 1991, ApJ, 383, 784 [NASA ADS] [CrossRef] [Google Scholar]
- O’Donoghue, D., Buckley, D. A. H., Balona, L. A., et al. 2006, MNRAS, 372, 151 [CrossRef] [Google Scholar]
- Papitto, A., Ferrigno, C., Bozzo, E., et al. 2015, MNRAS, 449, 26 [Google Scholar]
- Papitto, A., Torres, D. F., & Li, J. 2014, MNRAS, 438, 2105 [NASA ADS] [CrossRef] [Google Scholar]
- Papitto, A., de Martino, D., Belloni, T. M., et al. 2015, MNRAS, 449, 26 [Google Scholar]
- Papitto, A., Rea, N., Coti Zelati, F., et al. 2018, ApJL, 858, 12 [Google Scholar]
- Patruno, A., Archibald, A. M., Hessels, J. W. T., et al. 2014, ApJ, 781, L3 [Google Scholar]
- Petrov, L., Mahony, E. K., Edwards, P. G., et al. 2013, MNRAS, 432, 1294 [NASA ADS] [CrossRef] [Google Scholar]
- Pfeffermann, E., Briel, U. G., Hippmann, H., et al. 1987, SPIE, 733, 519 [NASA ADS] [Google Scholar]
- Rea, N., Coti Zelati, F., Esposito, P., et al. 2017, MNRAS, 471, 2902 [NASA ADS] [CrossRef] [Google Scholar]
- Russell, T. D., Degenaar, N., Wijnands, R., et al. 2018, ApJL, 869, 16 [Google Scholar]
- Rybizki, J., Demleitner, M., Fouesneau, M., et al. 2018, PASP, 130, 074101 [Google Scholar]
- Saitou, K., Tsujimoto, M., Ebisawa, K., & Ishida, M. 2009, PASJ, 61, L13 [NASA ADS] [Google Scholar]
- Saxton, R. D., Read, A. M., Esquej, P., et al. 2008, A&A, 480, 611 [NASA ADS] [CrossRef] [EDP Sciences] [Google Scholar]
- Schlafly, E. F., & Finkbeiner, D. P. 2011, ApJ, 737, 103 [Google Scholar]
- Shahbaz, T., Dallilar, Y., Garner, A., et al. 2018, MNRAS, 477, 566 [NASA ADS] [CrossRef] [Google Scholar]
- Skrutskie, M. F., Cutri, R. M., Stiening, R., et al. 2006, AJ, 131, 1163 [NASA ADS] [CrossRef] [Google Scholar]
- Stappers, B. W., Archibald, A. M., Hessels, J. W. T., et al. 2014, ApJ, 790, 39 [Google Scholar]
- Stetson, P. B. 2000, PASP, 112, 925 [Google Scholar]
- Strader, J., Li, K.-L., Chomiuk, L., et al. 2016, ApJ, 831, 1 [NASA ADS] [CrossRef] [Google Scholar]
- Strader, J., Swihart, S. J., Chomiuk, L., et al. 2019, ApJ, in press [arXiv:1812.04626] [Google Scholar]
- Strüder, L., Briel, U., Dennerl, K., et al. 2001, A&A, 365, 18 [Google Scholar]
- Tendulkar, S. P., Yang, C., An, H., et al. 2014, ApJ, 791, 77 [CrossRef] [Google Scholar]
- Tody, D. 1986, in Instrumentation in Astronomy VI, ed. D. L. Crawford, Proc. SPIE, 627, 733 [NASA ADS] [CrossRef] [Google Scholar]
- Tody, D. 1993, in Astronomical Data Analysis Software and Systems II, eds. R. J. Hanisch, R. J. V. Brissenden, & J. Barnes, ASP Conf. Ser., 52, 173 [Google Scholar]
- Tomsick, J. A., Chaty, S., Rodriguez, J., Walter, R., & Kaaret, P. 2009, ApJ, 701, 811 [NASA ADS] [CrossRef] [Google Scholar]
- Torres, D. F., Ji, L., Li, J., et al. 2017, ApJ, 836, 68 [NASA ADS] [CrossRef] [Google Scholar]
- Turner, M. J. L., Abbey, A., Arnaud, M., et al. 2001, A&A, 365, L27 [CrossRef] [EDP Sciences] [Google Scholar]
- Ubertini, P., Lebrun, F., Di Cocco, G., et al. 2003, A&A, 411, 131 [Google Scholar]
- van den Eijnden, J., Degenaar, N., Russell, T. D., et al. 2018, Nature, 562, 233 [NASA ADS] [CrossRef] [Google Scholar]
- van Straaten, S., van der Klis, M., & Wijnands, R. 2005, ApJ, 619, 455 [NASA ADS] [CrossRef] [Google Scholar]
- Vaughan, B. A., van der Klis, M., Wood, K. S., et al. 1994, ApJ, 435, 362 [NASA ADS] [CrossRef] [Google Scholar]
- Verner, D. A., Ferland, G. J., Korista, K. T., & Yakovlev, D. G. 1996, ApJ, 465, 487 [Google Scholar]
- Weisskopf, M. C. 2005, ArXiv e-prints [arXiv:astro-ph/0503091] [Google Scholar]
- Willingale, R., Starling, R. L. C., Beardmore, A. P., Tanvir, N. R., & O’Brien, P. T. 2013, MNRAS, 431, 394 [Google Scholar]
- Wilms, J., Allen, A., & McCray, R. 2000, ApJ, 542, 914 [Google Scholar]
- Wilson, W. E., Ferris, R. H., & Axtens, P. 2011, MNRAS, 416, 832 [NASA ADS] [CrossRef] [Google Scholar]
- Winkler, C., Courvoisier, T. J.-L., Di Cocco, G., et al. 2003, A&A, 411, 1 [Google Scholar]
- Wood, K. S., Norris, J. P., Hertz, P., et al. 1991, ApJ, 379, 295 [NASA ADS] [CrossRef] [Google Scholar]
- Xing, Y., Wang, Z.-X., & Takata, J. 2018, RAA, 18, 127 [NASA ADS] [Google Scholar]
- Yao, J. M., Manchester, R. N., & Wang, N. 2017, ApJ, 835, 29 [NASA ADS] [CrossRef] [Google Scholar]
All Tables
Journal of the photometric observations of J1109 performed with SALTICAM on 2018 March 4.
Properties of the Balmer emission lines of J1109 measured for the three spectra acquired with SALT RSS (see the text for details).
Journal of the X-ray modes of J1109 from the simultaneous XMM-Newton EPIC and NuSTAR data sets, and results of the spectral fits.
Multi-wavelength emission properties of the confirmed and candidate tMSPs in the sub-luminous accretion disk state; other systems properties are also listed.
All Figures
|
Fig. 1. Exposure-corrected image of the field around J1109 (labelled in white) extracted from Chandra ACIS-I data over the 0.3–8 keV energy band. The image was smoothed with a Gaussian filter with a kernel radius of 3 pixels (one ACIS pixel corresponds to 0.492 arcsec), and a logarithmic scale was adopted for better visualization. North is up, east to the right. The green ellipse has semi-major and semi-minor axes of 5.5 and 4.3 arcmin, respectively, at a position angle of 39.2° (measured from north towards east), and represents the error region (at 95% c.l.) for the position of the gamma-ray source FL8Y J1109.8−6500 obtained using 8 years of Fermi/LAT data. The magenta circle represents the error region for the position of the hard X-ray source IGR J11098−6457, obtained using 2995 ks of INTEGRAL IBIS data between 2002 and 2010 (see the 8 yr INTEGRAL IBIS soft gamma-ray survey catalogue by Bird et al. 2016 for more details). The yellow circle represents the error region for the position of the hard X-ray source 4PBC J1109.3−6501, obtained using 32.8 Ms of Swift BAT data between 2004 December and 2013 March (see the 100-month Palermo Swift BAT catalogue by Cusumano et al. 2014 for more details). The colour code on the right indicates the S/N at the different positions in the image. |
| In the text | |
|
Fig. 2. Posterior probability distribution function (PDF; yellow curve) for the distance of J1109 for an exponentially decreasing volume density prior with length scale of L = 2.11 kpc (green curve). The mode of the PDF is indicated by the vertical black solid line. The lower and upper boundaries of the highest density interval containing 68.27% of the posterior probability (i.e., the 16th and 84th percentiles) are indicated by the two vertical black dotted lines. The known systematic zero-point offset of −29 μas in the Gaia parallaxes determined from Gaia observations of quasars (Lindegren et al. 2018) was taken into account in the computation. The plot was produced using the code publicly available at https://github.com/Alymantara/gaia_distance_calculator/blob/master/gaia_distance_calculator.ipynb. |
| In the text | |
|
Fig. 3. Zoom of the optical images of the field around J1109 obtained on 2018 March 4 using SALTICAM. North is up, east to the left. Images acquired in the same filter were co-added, yielding total net exposures of 300 s, 200 s and 100 s in the g′, r′ and i′ filters, respectively. The white strip is due to the gap between the two CCD chips. The blue arrowhead in each panel indicates the position of the source in the second Gaia data release located within the error circle of J1109 (as determined using Chandra data). See the text for details. |
| In the text | |
|
Fig. 4. Images of the sky region around J1109 in different broad X-ray energy ranges obtained using different instruments. Top panel: INTEGRAL IBIS/ISGRI 20–40 keV mosaicked image. Galactic coordinates are reported. The grey scale is proportional to the X-ray flux. All sources detected in the field are labelled (J1109 is labelled in bold). Lower panels, left: NuSTAR FPMA+FPMB 3–79 keV image with sub-pixel binning. The 50 arcsec circle adopted to extract the source photons is overlaid. The colour code indicates the S/N at the different positions in the image. Lower panels, right: Swift BAT 15–150 keV image. The colour code indicates the S/N at the different positions in the image (negative values are in logarithmic scale). Different scales have been adopted for the images in the lower panels (more enlarged from left to right). |
| In the text | |
|
Fig. 5. Left-hand panel: low-resolution optical spectrum of J1109 obtained from the average of the two spectra acquired on 2018 March 4 using SALT RSS (total exposure of 2000 s), and restricted to the 4100–8600 Å wavelength range. The gaps over the 4530–4630 Å and 7790–7860 Å wavelength ranges are due to the gaps between the CCD chips in the RSS. The most prominent emission features as well as the telluric (atmospheric) O2 absorption feature are labelled. Right-hand panel: zoom on the wavelength ranges around the Hβ and Hα emission lines for the three spectra (in black, red and blue following the chronological order of spectra acquisition). Spectra were normalised to the continuum, and shifted along the vertical axis for better visualization. |
| In the text | |
|
Fig. 6. 0.3–10 keV background-subtracted and exposure-corrected light curve of J1109 obtained with XMM-Newton EPIC with a time bin of 30 s. |
| In the text | |
|
Fig. 7. Distribution of the count rates (left-hand panels) obtained from the binned background-subtracted and exposure-corrected light curves of J1109 extracted using different X-ray instruments (right-hand panels). The vertical error bars in the distributions are evaluated as the square root of the number of time bins measured in the corresponding count rate interval (i.e. as the standard deviation of a Poisson distribution). Top panel: from the XMM-Newton EPIC 30-s binned light curve, separately for the first 49 ks (in black) and the last 16 ks (in red) of the observation. The black solid line represents the best-fitting model for the former distribution, i.e. the superposition of two log-normal distributions (see the text for details). A logarithmic scale was adopted for the vertical axis, for better visualization. Middle panel: from the NuSTAR FPMA+FPMB 40-s binned light curve. The ∼3-ks long gaps in the light curve are due to Earth occultation. Bottom panel: from the Chandra ACIS-I 40-s binned light curve. |
| In the text | |
|
Fig. 8. z-transformed discrete correlation functions (zDCFs) between the light curves of J1109 extracted in the soft and hard X-ray energy bands from XMM-Newton EPIC pn (top panel) and NuSTAR FPMA+FPMB (bottom panel) data using a time step of 2 s (see Sect. 6.2.1 for the definitions adopted for the energy bands). The zDCFs have been normalised so as to account for Poisson noise. Positive time delays correspond to higher energy photons lagging lower energy photons. For plotting purpose, an extended range of time delays is shown, and uncertainties on the values have been omitted. |
| In the text | |
|
Fig. 9. White noise-subtracted power density spectrum of J1109 in the 0.1 mHz–100 Hz frequency range, computed from the EPIC pn data filtered over the 0.3–10 keV energy range. The red dashed line represents the best-fitting power law model (see the text for details). Post-fit residuals in units of standard deviations are shown in the bottom panel. |
| In the text | |
|
Fig. 10. Background-subtracted X-ray spectra of J1109 extracted over the 0.3–79 keV energy range from the simultaneous XMM-Newton and NuSTAR observations on 2018 June 20–21. Left-hand panel: spectra relative to the average emission. Black refers to the pn, red to MOS 1, green to MOS 2, blue to FPMA and cyan to FPMB. Right-hand panel: spectra relative to the flare, high and low X-ray modes separately. Only the XMM-Newton EPIC MOS1 (0.3–10 keV) and NuSTAR FPMA (3–79 keV) spectra are shown for plotting purposes. Orange and red refer to the flare mode, black and grey to the high mode, and blue and cyan to the low mode. In both panels the best-fitting absorbed power law model is indicated by the solid lines, and post-fit residuals in units of standard deviations are shown in the bottom panel. Data were re-binned to better visualise the trend in the spectral residuals. See the text and Table 5 for details. |
| In the text | |
|
Fig. 11. 1, 2 and 3σ confidence regions for the power law photon index as a function of the unabsorbed flux over the 0.3–79 keV energy band for the best-fitting models of the flare (orange), high (black) and low (blue) mode spectra of J1109. The crosses mark the best-fitting values (see Table 5 for details). |
| In the text | |
|
Fig. 12. Long-term light curves of J1109 in the X-ray bands. Top panel: over the 0.3–10 keV energy range, obtained from data with different observatories in the time interval from 1991 January 18 to 2018 June 21. Bottom panel: over the 15–150 keV energy range, obtained from data with the Swift BAT in the time interval from 2004 December 8 to 2017 October 1 with a time bin of 360 d. |
| In the text | |
|
Fig. 13. Naturally-weighted 7.25 GHz image of the sky region around J1109, extracted from our 4.8 h long ATCA observation on 2018 June 20. A logarithmic scale was adopted for better visualization. The white circle is centred on the optical position of J1109, with an enlarged radius of 10 arcsec for imaging purposes. The green ellipse denotes the error region for the position of the Fermi/LAT gamma-ray source. |
| In the text | |
|
Fig. 14. Large panel: time-averaged spectral energy distribution of J1109 from the radio to the gamma-ray band. Vertical bars represent 1σ statistical uncertainties, whereas arrowheads indicate 95% upper limits. The blue dashed line represents the best-fitting power-law model for the average X-ray emission detected with XMM-Newton and NuSTAR, and its extrapolation to the optical and nIR bands. The X-ray spectrum has not been corrected for absorption. Inset: SEDs of J1109, PSR J1023+0038 (taken from Bogdanov et al. 2015), XSS J12270−4859 (from de Martino et al. 2015) and 1RXS J154439.4−112820 (from Bogdanov et al. 2018 for the optical, UV and X-ray data) plotted together to highlight their similarities among these systems in the sub-luminous accretion disk state (we note in particular the virtually identical slope of the power law model in the X-ray band). |
| In the text | |
|
Fig. 15. Radio vs. X-ray luminosity plane for different classes of accreting compact objects, adapted from Bahramian et al. (2018b). Data points for PSR J1023+0038 and J1109 (see the green triangles) are plotted also separately for the high and low X-ray modes (Bogdanov et al. 2018 and this work). The data point for IGR J18245−2452 (M28I) was derived from strictly simultaneous ATCA and Swift XRT observations (Ferrigno et al. 2014), and we computed its position on the plane after performing time-resolved spectral analysis of Swift XRT data (obs. ID 00032785003). Upper limits are denoted by arrowheads. The cyan shaded area encloses the 3σ confidence interval on the shape of the correlation holding for accreting NSs (see Gallo et al. 2018 and the text for more details). |
| In the text | |
Current usage metrics show cumulative count of Article Views (full-text article views including HTML views, PDF and ePub downloads, according to the available data) and Abstracts Views on Vision4Press platform.
Data correspond to usage on the plateform after 2015. The current usage metrics is available 48-96 hours after online publication and is updated daily on week days.
Initial download of the metrics may take a while.