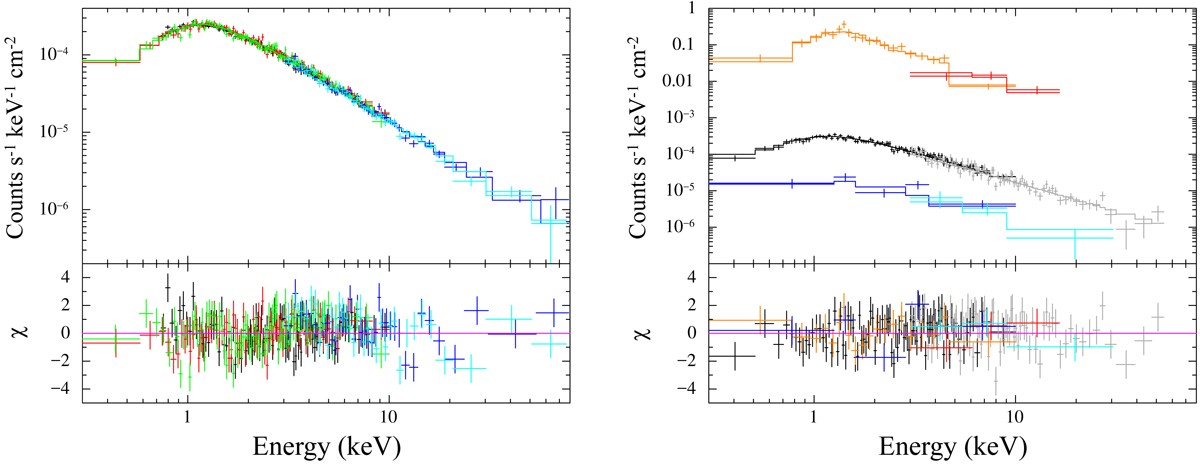
Fig. 10.
Download original image
Background-subtracted X-ray spectra of J1109 extracted over the 0.3–79 keV energy range from the simultaneous XMM-Newton and NuSTAR observations on 2018 June 20–21. Left-hand panel: spectra relative to the average emission. Black refers to the pn, red to MOS 1, green to MOS 2, blue to FPMA and cyan to FPMB. Right-hand panel: spectra relative to the flare, high and low X-ray modes separately. Only the XMM-Newton EPIC MOS1 (0.3–10 keV) and NuSTAR FPMA (3–79 keV) spectra are shown for plotting purposes. Orange and red refer to the flare mode, black and grey to the high mode, and blue and cyan to the low mode. In both panels the best-fitting absorbed power law model is indicated by the solid lines, and post-fit residuals in units of standard deviations are shown in the bottom panel. Data were re-binned to better visualise the trend in the spectral residuals. See the text and Table 5 for details.
Current usage metrics show cumulative count of Article Views (full-text article views including HTML views, PDF and ePub downloads, according to the available data) and Abstracts Views on Vision4Press platform.
Data correspond to usage on the plateform after 2015. The current usage metrics is available 48-96 hours after online publication and is updated daily on week days.
Initial download of the metrics may take a while.