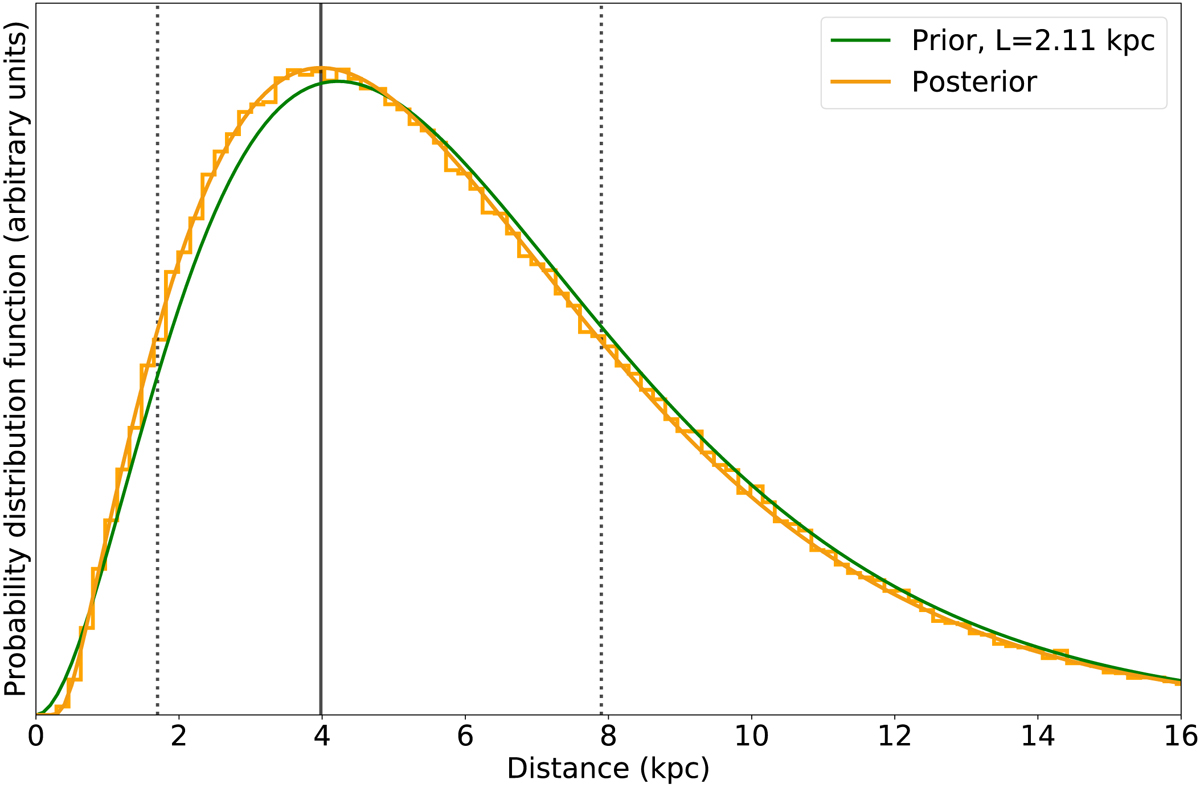
Fig. 2.
Download original image
Posterior probability distribution function (PDF; yellow curve) for the distance of J1109 for an exponentially decreasing volume density prior with length scale of L = 2.11 kpc (green curve). The mode of the PDF is indicated by the vertical black solid line. The lower and upper boundaries of the highest density interval containing 68.27% of the posterior probability (i.e., the 16th and 84th percentiles) are indicated by the two vertical black dotted lines. The known systematic zero-point offset of −29 μas in the Gaia parallaxes determined from Gaia observations of quasars (Lindegren et al. 2018) was taken into account in the computation. The plot was produced using the code publicly available at https://github.com/Alymantara/gaia_distance_calculator/blob/master/gaia_distance_calculator.ipynb.
Current usage metrics show cumulative count of Article Views (full-text article views including HTML views, PDF and ePub downloads, according to the available data) and Abstracts Views on Vision4Press platform.
Data correspond to usage on the plateform after 2015. The current usage metrics is available 48-96 hours after online publication and is updated daily on week days.
Initial download of the metrics may take a while.