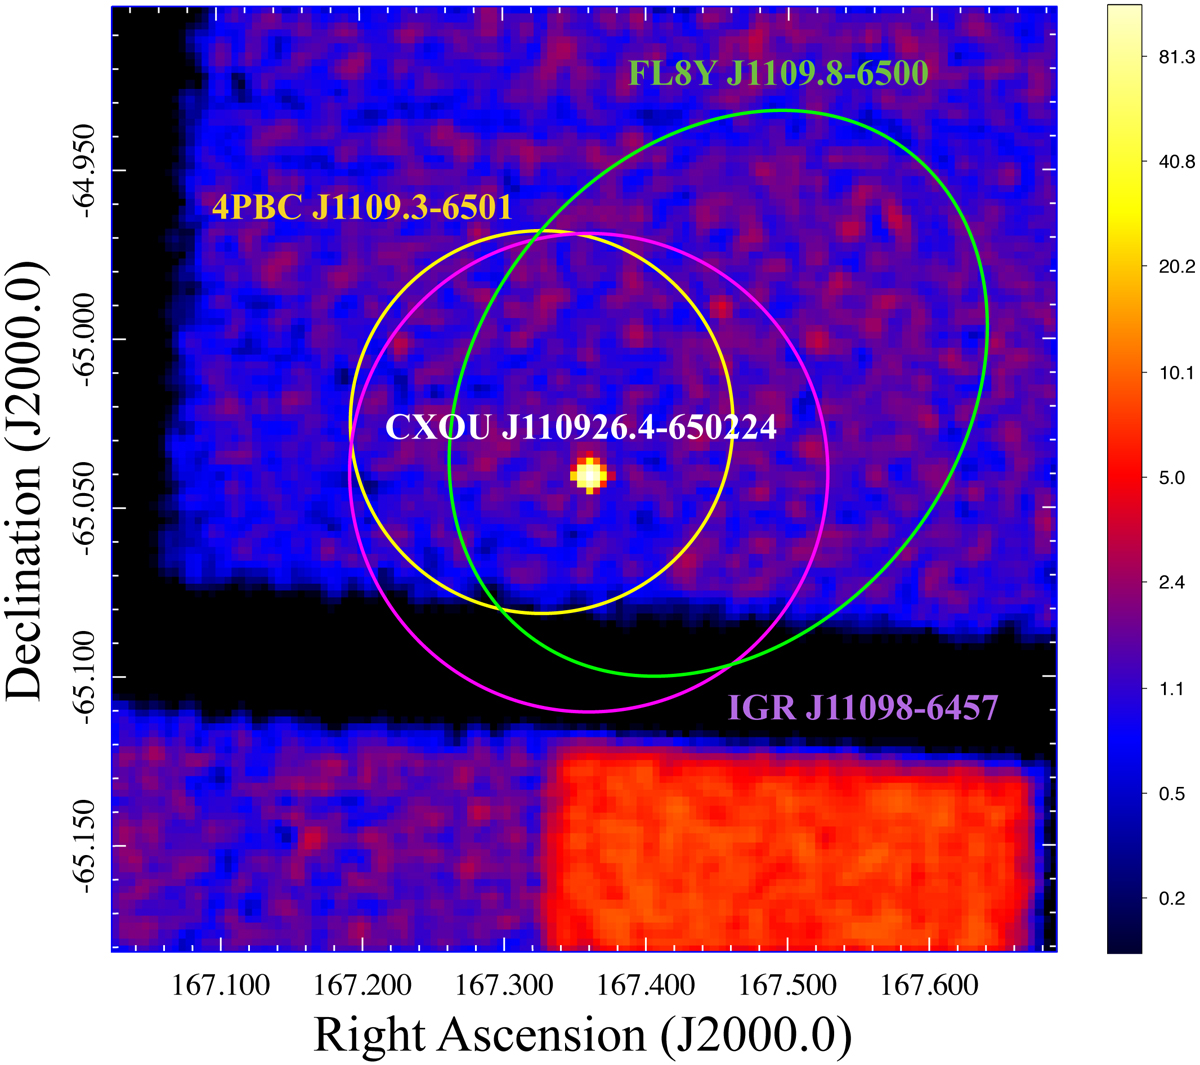
Fig. 1.
Download original image
Exposure-corrected image of the field around J1109 (labelled in white) extracted from Chandra ACIS-I data over the 0.3–8 keV energy band. The image was smoothed with a Gaussian filter with a kernel radius of 3 pixels (one ACIS pixel corresponds to 0.492 arcsec), and a logarithmic scale was adopted for better visualization. North is up, east to the right. The green ellipse has semi-major and semi-minor axes of 5.5 and 4.3 arcmin, respectively, at a position angle of 39.2° (measured from north towards east), and represents the error region (at 95% c.l.) for the position of the gamma-ray source FL8Y J1109.8−6500 obtained using 8 years of Fermi/LAT data. The magenta circle represents the error region for the position of the hard X-ray source IGR J11098−6457, obtained using 2995 ks of INTEGRAL IBIS data between 2002 and 2010 (see the 8 yr INTEGRAL IBIS soft gamma-ray survey catalogue by Bird et al. 2016 for more details). The yellow circle represents the error region for the position of the hard X-ray source 4PBC J1109.3−6501, obtained using 32.8 Ms of Swift BAT data between 2004 December and 2013 March (see the 100-month Palermo Swift BAT catalogue by Cusumano et al. 2014 for more details). The colour code on the right indicates the S/N at the different positions in the image.
Current usage metrics show cumulative count of Article Views (full-text article views including HTML views, PDF and ePub downloads, according to the available data) and Abstracts Views on Vision4Press platform.
Data correspond to usage on the plateform after 2015. The current usage metrics is available 48-96 hours after online publication and is updated daily on week days.
Initial download of the metrics may take a while.