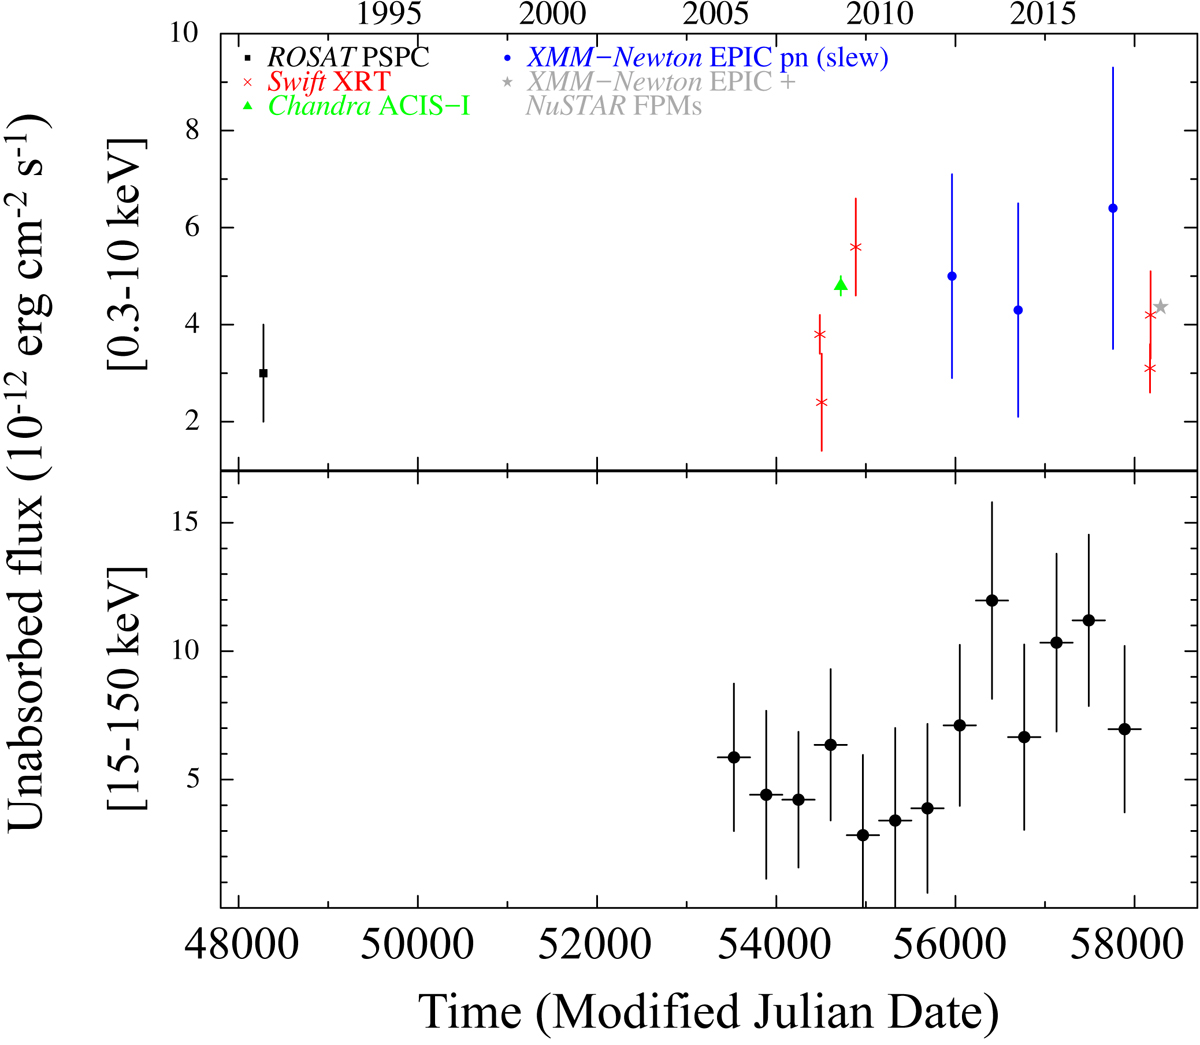
Fig. 12.
Download original image
Long-term light curves of J1109 in the X-ray bands. Top panel: over the 0.3–10 keV energy range, obtained from data with different observatories in the time interval from 1991 January 18 to 2018 June 21. Bottom panel: over the 15–150 keV energy range, obtained from data with the Swift BAT in the time interval from 2004 December 8 to 2017 October 1 with a time bin of 360 d.
Current usage metrics show cumulative count of Article Views (full-text article views including HTML views, PDF and ePub downloads, according to the available data) and Abstracts Views on Vision4Press platform.
Data correspond to usage on the plateform after 2015. The current usage metrics is available 48-96 hours after online publication and is updated daily on week days.
Initial download of the metrics may take a while.