Fig. 5.
Download original image
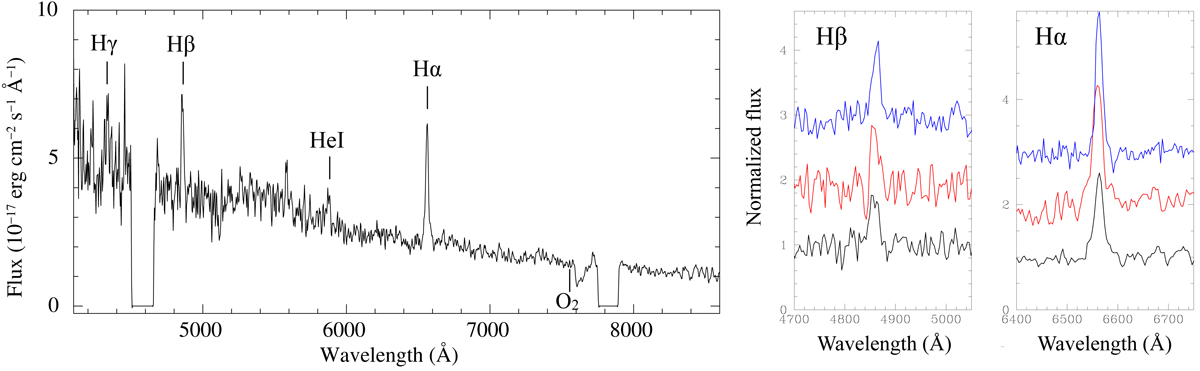
Left-hand panel: low-resolution optical spectrum of J1109 obtained from the average of the two spectra acquired on 2018 March 4 using SALT RSS (total exposure of 2000 s), and restricted to the 4100–8600 Å wavelength range. The gaps over the 4530–4630 Å and 7790–7860 Å wavelength ranges are due to the gaps between the CCD chips in the RSS. The most prominent emission features as well as the telluric (atmospheric) O2 absorption feature are labelled. Right-hand panel: zoom on the wavelength ranges around the Hβ and Hα emission lines for the three spectra (in black, red and blue following the chronological order of spectra acquisition). Spectra were normalised to the continuum, and shifted along the vertical axis for better visualization.
Current usage metrics show cumulative count of Article Views (full-text article views including HTML views, PDF and ePub downloads, according to the available data) and Abstracts Views on Vision4Press platform.
Data correspond to usage on the plateform after 2015. The current usage metrics is available 48-96 hours after online publication and is updated daily on week days.
Initial download of the metrics may take a while.