Fig. 3.
Download original image
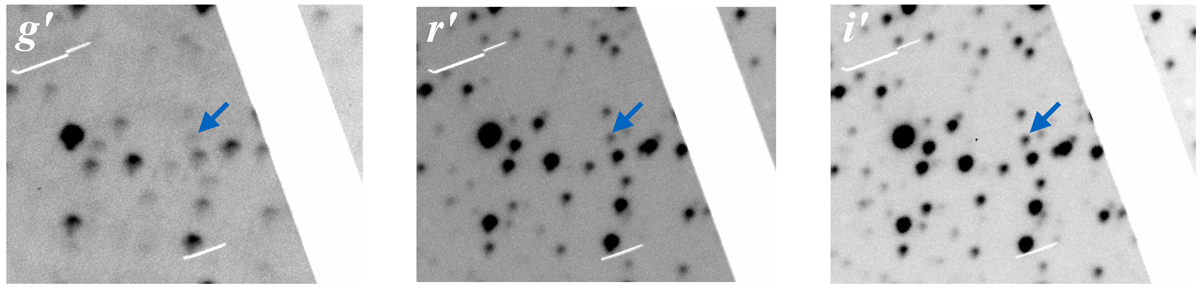
Zoom of the optical images of the field around J1109 obtained on 2018 March 4 using SALTICAM. North is up, east to the left. Images acquired in the same filter were co-added, yielding total net exposures of 300 s, 200 s and 100 s in the g′, r′ and i′ filters, respectively. The white strip is due to the gap between the two CCD chips. The blue arrowhead in each panel indicates the position of the source in the second Gaia data release located within the error circle of J1109 (as determined using Chandra data). See the text for details.
Current usage metrics show cumulative count of Article Views (full-text article views including HTML views, PDF and ePub downloads, according to the available data) and Abstracts Views on Vision4Press platform.
Data correspond to usage on the plateform after 2015. The current usage metrics is available 48-96 hours after online publication and is updated daily on week days.
Initial download of the metrics may take a while.