Fig. 7.
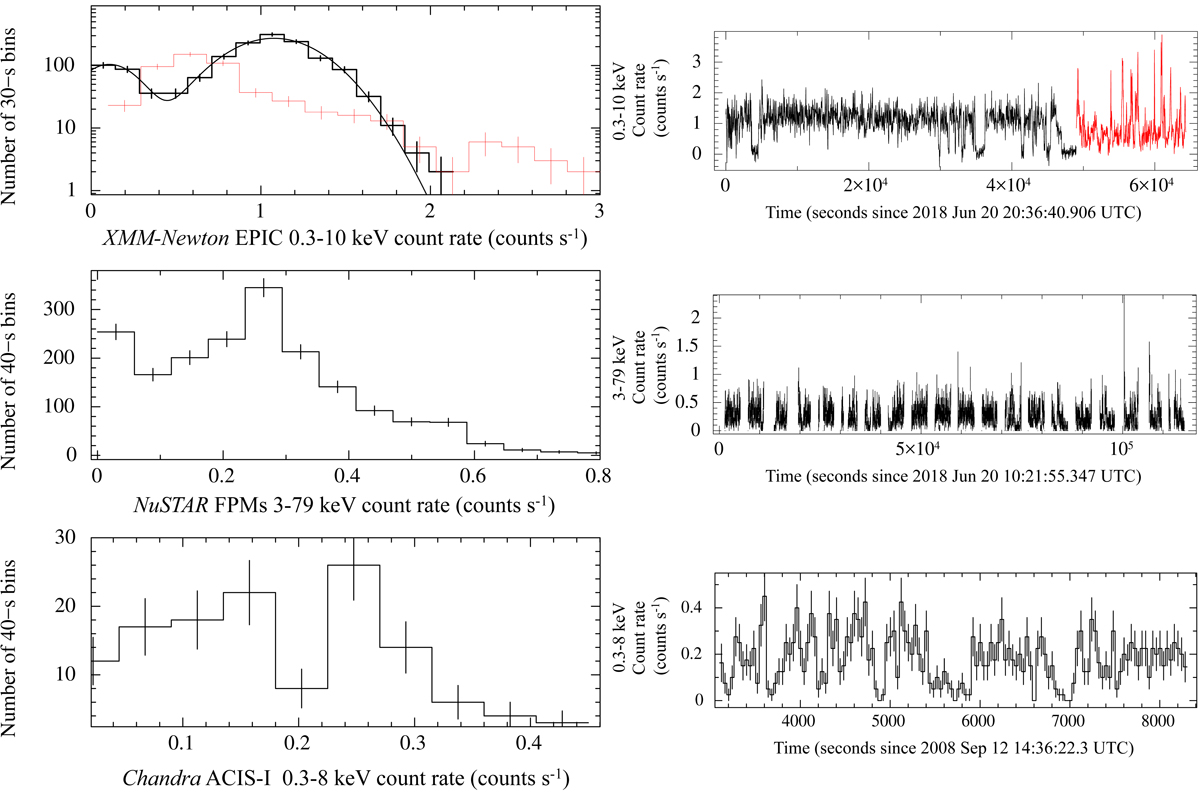
Download original image
Distribution of the count rates (left-hand panels) obtained from the binned background-subtracted and exposure-corrected light curves of J1109 extracted using different X-ray instruments (right-hand panels). The vertical error bars in the distributions are evaluated as the square root of the number of time bins measured in the corresponding count rate interval (i.e. as the standard deviation of a Poisson distribution). Top panel: from the XMM-Newton EPIC 30-s binned light curve, separately for the first 49 ks (in black) and the last 16 ks (in red) of the observation. The black solid line represents the best-fitting model for the former distribution, i.e. the superposition of two log-normal distributions (see the text for details). A logarithmic scale was adopted for the vertical axis, for better visualization. Middle panel: from the NuSTAR FPMA+FPMB 40-s binned light curve. The ∼3-ks long gaps in the light curve are due to Earth occultation. Bottom panel: from the Chandra ACIS-I 40-s binned light curve.
Current usage metrics show cumulative count of Article Views (full-text article views including HTML views, PDF and ePub downloads, according to the available data) and Abstracts Views on Vision4Press platform.
Data correspond to usage on the plateform after 2015. The current usage metrics is available 48-96 hours after online publication and is updated daily on week days.
Initial download of the metrics may take a while.