| Issue |
A&A
Volume 622, February 2019
|
|
|---|---|---|
| Article Number | A29 | |
| Number of page(s) | 18 | |
| Section | Catalogs and data | |
| DOI | https://doi.org/10.1051/0004-6361/201833663 | |
| Published online | 24 January 2019 | |
Identification of AGN in the XMM-Newton X-ray survey of the SMC⋆,⋆⋆
1
Max-Planck-Institut für extraterrestrische Physik, Giessenbachstraße, 85748 Garching, Germany
e-mail: This email address is being protected from spambots. You need JavaScript enabled to view it.
2
European Southern Observatory, Ave. Alonso de Crdova 3107, Vitacura, Santiago, Chile
3
European Southern Observatory, Karl-Schwarzschild-Str. 2, 85748 Garching bei München, Germany
4
Leibniz-Institut für Astrophysik Potsdam, An der Sternwarte 16, 14482 Potsdam, Germany
5
Lennard-Jones Laboratories, Keele University, ST5 5BG, UK
Received:
18
June
2018
Accepted:
25
October
2018
Abstract
Context. Finding active galactic nuclei (AGN) behind the Magellanic Clouds (MCs) is difficult because of the high stellar density in these fields. Although the first AGN behind the Small Magellanic Cloud (SMC) were reported in the 1980s, it is only recently that the number of AGN known behind the SMC has increased by several orders of magnitude.
Aims. The mid-infrared colour selection technique has proven to be an efficient means of identifying AGN, especially obscured sources. The X-ray regime is complementary in this regard and we use XMM-Newton observations to support the identification of AGN behind the SMC.
Methods. We present a catalogue of AGN behind the SMC by correlating an updated X-ray point-source catalogue from our XMM-Newton survey of the SMC with previously identified AGN from the literature as well as a list of candidates obtained from the ALLWISE mid-infrared colour-selection criterion. We studied the properties of the sample with respect to their redshifts, luminosities, and X-ray spectral characteristics. We also identified the near-infrared counterpart of the sources from the VISTA observations.
Results. The redshift and luminosity distributions of the sample (where known) indicate that we detect sources ranging from nearby Seyfert galaxies to distant and obscured quasars. The X-ray hardness ratios are compatible with those typically expected for AGN, and the VISTA colours and variability are also consistent with AGN. A positive correlation was observed between the integrated X-ray flux (0.2–12 keV) and the ALLWISE and VISTA magnitudes. We further present a sample of new candidate AGN and candidates for obscured AGN. Together these make an interesting subset for further follow-up studies. An initial spectroscopic follow-up of 6 out of the 81 new candidates showed that all six sources are active galaxies, although two have narrow emission lines.
Key words: Magellanic Clouds / quasars: general / X-rays: galaxies / infrared: galaxies / catalogs
Based on observations with XMM-Newton, an ESA Science Mission with instruments and contributions directly funded by ESA Member states and the USA (NASA).
Based on observations made with VISTA at the Paranal Observatory under programme ID(s) 179.B-2003(G), 179.B-2003(F), 179.B-2003(D), 179.B-2003(C), 179.B-2003(H), 179.B-2003(B).
© ESO 2019
1. Introduction
Active galactic nuclei (AGN) are amongst the most powerful and steady sources of luminosity in the universe ranging from AGN in nearby galaxies emitting at luminosities of about 1040 erg s−1, to distant quasars emitting > 1047 erg s−1. Active galactic nuclei play a crucial role in the formation and evolution of galaxies (e.g. Caputi 2014), and in the growth of supermassive black holes (Fabian & Iwasawa 1999).
Identification of AGN behind the Magellanic Clouds (MCs) can be a challenging task because of the high stellar density in these fields. The first small samples of quasars behind the Small Magellanic Cloud (SMC) were reported in the 1980s (Mills et al. 1982; Wilkes et al. 1983). Tinney et al. (1997) confirmed eight new sources by performing optical spectroscopic follow-up of ROSAT X-ray sources. Further, Dobrzycki et al. (2003a,b) and Geha et al. (2003) identified five candidates from X-ray selection and five using the optical variability properties from the Magellanic Cloud OGLE-II data (Eyer 2002). The Magellanic Quasar Survey (MQS) played a significant role in increasing the number of AGN behind the MCs. In the first work of a series, Kozłowski & Kochanek (2009) selected 657 candidates using the Spitzer space telescope in the infrared (IR) and near-infrared (NIR) photometry. Subsequently, based on the candidates from Kozłowski & Kochanek (2009), and additional ones selected by optical variability from OGLE data together with mid-IR and/or X-ray properties, Kozłowski et al. (2011, OGLE-II) and Kozłowski et al. (2013, OGLE-III) were able to confirm 193 of the 766 candidates selected in total by performing follow-up spectroscopy.
Recent years have witnessed an increase in the number of identified AGN by several orders of magnitude. A large fraction of these are owed to the advent of the mid-IR colour-selection technique which has proven to be a very efficient means of identifying AGN. This technique is based on detecting the hot obscured dust surrounding an AGN, which is much less affected by extinction. For the same reason, this method is also effective in finding the most obscured AGN, and is in a way complementary to X-ray surveys of AGN at energies < 10 keV which are only partially sensitive to Compton-thick AGN (NH > 1024 cm−2; Della Ceca et al. 2008). The mid-IR selection techniques were introduced by Lacy et al. (2004), Stern et al. (2005), and Donley et al. (2012) using data from the Spitzer mission. These were later adapted for the Wide-field Infrared Survey Explorer (WISE; Wright et al. 2010) mission which performed an all-sky survey in the IR bands at 3.4, 4.6, 12 and 22 μm. The mission achieved 5σ point-source sensitivities better than 0.08, 0.11, 1, and 6 mJy at 3.4, 4.6, 12, and 22 μm, respectively, with angular resolutions of 6.1, 6.4, 6.5, and  in the respective bands. Stern et al. (2012) and Assef et al. (2013) applied one colour-selection criterion using 3.4 and 4.6 μm wavebands from the ALLWISE data to select AGN. Mateos et al. (2012) formulated a more advanced and effective two-colour wedge selection criterion of these sources. All of the selection criteria are based on the fact that the AGN separate cleanly from stars and star-forming galaxies in the mid-IR colour space.
Based on this, Secrest et al. (2015) presented an all-sky catalogue of 1.4 million AGN selected using the two-colour mid-IR criteria for AGN (Mateos et al. 2012), applied to sources from the WISE final catalogue release (ALLWISE). This included approximately 1.1 million previously uncatalogued AGN. Additionally, the Half-Million Quasars catalogue (HMQ; Flesch 2015) lists a sample of 510 764 objects. This included high-confidence SDSS-based photometric quasars with radio/X-ray associations as well as BL Lac and type 2 objects with accurate source positions. Recently, Flesch (2017) published the Million Quasars (MILLIQUAS) catalogue, which is an updated version of the former catalogue including ∼900 000 high-confidence quasar candidates from SDSS-based photometric quasar catalogues and also from all-sky radio/X-ray associated objects, bringing the total count to 1 422 219. However, only a small fraction of this catalogue contained X-ray-selected sources or sources with X-ray associations.
The XMM-Newton survey of the SMC (Haberl et al. 2012) provided the deepest complete coverage of the main body of the SMC (bar and eastern wing, ∼5.58 deg2) in the X-ray (0.2−12.0 keV) band. The bulk (> 71%) of the 3053 X-ray-emitting point sources that were detected are expected to be AGN, although only 72 could be identified with high confidence (Sturm et al. 2013a). This is because for an individual faint (∼10−14 erg cm−2 s−1) X-ray source it is difficult to prove the AGN nature. Moreover, owing to the coordinate uncertainties of an XMM-Newton source (typical  , after astrometric correction), it is challenging to find the optical counterpart because of the high density of SMC stars, which causes chance coincidences with typically up to approximately four optical sources. Sturm et al. (2013b) used associations of the X-ray point sources with radio emission to effectively select 43 new candidates for AGN behind the SMC. With the large database of all-sky quasar catalogues available now, and additional effective and well tested selection methods in other wavebands (especially in the mid-IR), we now have the ideal opportunity to identify many more quasars behind the SMC.
Active galactic nuclei behind the MCs are particularly important for two additional reasons. Firstly, they are ideally suited as anchors for an absolute astrometric reference system for proper-motion studies (e.g. Kallivayalil et al. 2013; Cioni et al. 2014). Also, in the context of X-ray sources, we note the importance of having identified X-ray sources to improve the astrometric quality of X-ray catalogues in the field of the MCs. The brightest sources might be used to probe absorption by the interstellar medium in the MCs. Finally, AGN could be the subject of investigations using the comprehensive multi-epoch and multi-wavelength data available for the MCs (e.g. Kelly et al. 2009).
In this paper we present a catalogue of X-ray detected AGN behind the SMC by correlating an updated point-source catalogue of the XMM-Newton SMC survey with lists of AGN known from the literature and of candidates obtained in this work using the ALLWISE mid-IR colour-selection criterion. In Sect. 2 we describe the observations and the data reduction, and the production of AGN samples based on mid-IR selections and published catalogues, and their correlation with the X-ray data. In Sect. 3 we describe the results and characterise the selected AGN. In Sect. 4 we present a summary and conclusions. For calculation of luminosities, we adopted the standard cosmological parameters: ΩM = 0.3, ΩA = 0.7 and H0 = 70 km s−1 Mpc−1.
2. Observations and data reduction
2.1. X-ray data and the updated SMC survey
The XMM-Newton (Jansen et al. 2001) survey of the SMC (Haberl et al. 2012) provided the deepest complete coverage of the main body of the SMC (bar and eastern wing, ∼5.58 deg2) in the 0.2−12.0 keV band. Using additional outer fields, a catalogue of 3053 X-ray point sources was created. A detailed description of the catalogue and the used observations are presented in Sturm et al. (2013a). To this sample, we added new observations of the SMC wing region acquired as part of the SMC Wing survey (PI: F. Haberl), and all observations publicly available up to satellite revolution 3177 (2017-04-14). This resulted in 44 new pointings (including archival observations). The updated survey has a total exposure of 3.4 Ms and covers an area of ∼6.67 deg2 and will be described in detail in a forthcoming paper. The new observations are listed in Table 1. We reprocessed the entire dataset mentioned above in the same way as for the SMC X-ray point-source catalogue using the latest version of SAS (16.1), also including new boresight corrections using the catalogue of AGN compiled from this work. In contrast to Sturm et al. (2013a) we applied background filtering to each instrument individually. This resulted in a gain of exposure times for MOS1 and MOS2 in most cases. For the compilation of the updated SMC point-source catalogue we applied a reduced systematic error of  in comparison to Sturm et al. (2013a) who used a value of
  . This is comparable to the systematic error applied to the 3XMM-DR6 catalogue (Rosen et al. 2016)1. A total of 8690 detections were found from the entire SMC survey area, which include detections with a detection likelihood of ≥6. Unique sources were included in the catalogue when at least one detection was found with a detection likelihood of ≥10. This resulted in 4449 unique X-ray point sources. The master source positions and the corresponding errors were calculated from the error-weighted average of the individual detections. All the sources identified in this work were screened individually by visual inspection to avoid spurious detections.
New XMM-Newton observations since Sturm et al. (2013a) given in chronological order.
2.2. The mid infrared sample and the ALLWISE data
We selected all sources from the ALLWISE catalogue within a radius of 3.33° around RA = 01h00m00s, Dec = −72°30′00″ (area of the XMM-Newton SMC survey) following the two-colour selection criterion of Mateos et al. (2012, see Eqs. (3) and (4)). We additionally imposed a requirement that the selected sources have a signal-to-noise-ratio (S/N) ≥3 in all three bands of selection (3.4, 4.6, and 12 μm: referred to henceforth as W1, W2, and W3) and be unaffected by known artifacts (cc_flags ==“0000”). This implied the same criteria as used by Secrest et al. (2015) albeit with a more relaxed S/N requirement of 3 instead of 5. Secrest et al. (2015) adopted a criterion of S/N ≥ 5 in order to minimise the contamination from star-forming galaxies. However, the presence of a corresponding X-ray counterpart of an ALLWISE source makes this less likely. The relaxed S/N criterion enabled us to increase our sample of detected AGN, while our choice of mid-IR colour selection is well suited to also finding AGN behind highly obscured regions of the SMC.
2.3. HMQ/MILLIQUAS catalogues
In order to find more sources for the reference AGN sample that were either not detected in the ALLWISE data, or did not have the colours matching the Mateos et al. (2012) criterion, we selected additional high-confidence sources with known spectroscopic redshifts from the HMQ and the MILLIQUAS catalogue within the area of the XMM-Newton SMC survey. This resulted in a total of 2753 sources from the ALLWISE data and the HMQ/MILLIQUAS, out of which 2587 (94%) are from the ALLWISE data.
2.4. Correlation of the XMM-Newton and ALLWISE/HMQ/MILLIQUAS catalogues
In order to identify the AGN behind the SMC from the survey data, we cross-correlated the X-ray and the ALLWISE/HMQ/MILLIQUAS samples described in the previous subsections. For the cross-match we used TOPCAT v 4.2-12, and adopted the following selection methods to optimise the purity of the resulting sample. Sources with uncertain X-ray coordinates can result in more than one match, which is therefore insecure. In the following, we only used X-ray sources with a 1σ position uncertainty of  (4311 out of 4449 sources). We further regarded all correlations with an angular separation of

For a Rayleigh distribution this corresponds to a 99.7% completeness. The typical position accuracy of an X-ray source is  . The ALLWISE position uncertainties are < 1″ for all sources and better than
  for high-S/N sources (Wright et al. 2010). The coordinate uncertainties of the HMQ/MILLIQUAS sample is
  . Figure 1 shows the distribution of the uncertainty-normalised angular separation between the correlated sources after applying the criteria described above.
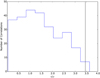 |
Fig. 1. Distribution of uncertainty-normalised angular separations for 276 XMM-Newton correlations with the total AGN sample of 2753 sources. For real counterparts, we expect a Rayleigh distribution. The vertical line indicates the 99.7% completeness. |
To estimate the probability of chance coincidence, we cross-correlated the X-ray sample with the total sample of AGN by shifting the coordinates of the latter by large offsets (3′ in either RA or Dec). We estimate the probability of chance coincidence to be 0.003%.
3. Results and discussion
3.1. The X-ray-selected sample: characterisation
We found a total of 276 X-ray sources uniquely correlating with the selected sample of AGN (Table A.5). Out of them, 218 in total were selected using the ALLWISE selection criteria, with 81 new AGN candidates identified from this work, and 137 already classified as AGN by Secrest et al. (2015; Table 2). The rest (58) were selected exclusively from the MILLIQUAS and the HMQ catalogue. The spatial distribution of the sample (Fig. 2) shows that the identified AGN are scattered uniformly within the XMM-Newton survey area with no particular spatial dependence on the selection criteria (ALLWISE/HMQ/MILLIQUAS) used for the sample.
 |
Fig. 2. Mosaic image of all XMM-Newton observations used in the updated SMC survey. Red/green/blue: 0.2–1.0/1.0–2.0/2.0–4.5 keV intensities. White circles denote the sources selected from Secrest et al. (2015), green circles those from the HMQ and MILLIQUAS survey (Flesch 2015, 2017), and red circles mark the 81 new AGN candidates that we identified. The magenta crosses indicate the candidates for obscured AGN. The circle radius is scaled with the uncertainty on the X-ray positions. |
AGN behind the SMC selected in this work.
3.1.1. Redshift
From the 276 sources, 90 have their redshifts (z) determined. Their distribution is shown in the right panel of Fig. 3. The median z of the sample is 1.06, the lowest is 0.07 (classified as a Seyfert galaxy 6dFGS gJ005356.2–703804) and the highest is 2.878 (classified as a quasar SMC J010127.75−721306.2). This indicates that we detect sources with a wide range of z from nearby Seyfert galaxies to distant quasars. We detected 14 objects with high redshifts (z ≥ 2). Although most of the sample was selected by correlating the X-ray source list with the ALLWISE mid-IR two-colour selection, only 29 of the objects with known z are from the ALLWISE sample. This is consistent with the fact that out of the 2587 sources identified within the area of the XMM-Newton survey that satisfied the criterion of Mateos et al. (2012), only 73 contain redshift information. The rest were selected from the MILLIQUAS and the HMQ catalogues. Moreover, all the sources with z ≥ 2 were also selected from the MILLIQUAS and the HMQ catalogues. We verified that the high-z sources were distributed randomly within the survey area of the SMC, further indicating that there is no dependence of the selection criteria used for identification of the sources on the area of the survey.
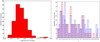 |
Fig. 3. Left panel: X-ray flux (in units of 10−11 erg cm−2 s−1 in the energy range of 0.2–12 keV) distribution of the sample; right panel: redshift distribution of the sample, where known (in red), and redshift distribution of all AGN with known z (in blue) within the XMM-Newton SMC survey from (Secrest et al. 2015). |
3.1.2. Flux and luminosity
We calculated the average X-ray flux for each source of the sample (0.2–12 keV) by converting the count rates using conversion factors taken from Sturm et al. (2013a). This assumes a power-law model with a photon index of 1.7 and a photo-electric foreground absorption by the Galaxy of 6 × 1020 cm−2 (average for the SMC main field in the H I map of Dickey & Lockman 1990). The flux of the sample has a median at 7.0 × 10⁻¹⁴ erg cm−2 s−1 (Fig. 3, left). The minimum flux detected in the sample is 6.0 × 10⁻¹⁵ erg cm−2 s−1, which is near the sensitivity limit of the survey. The highest flux detected is 5.0 × 10⁻¹² erg cm−2 s−1 from a nearby object (z = 0.074).
For the sources with known z, we determined the rest-frame X-ray luminosities (0.2–12 keV). The X-ray luminosity distribution is shown in the left panel of Fig. 4. The median of the sample is 1.9 × 1044 erg s−1 and the minimum luminosity determined is 3.7 × 1042 erg s−1. The lower limit of our sample is compatible with the value at which the AGN luminosity dominates over the host galaxy emission and can be selected effectively using AGN colour-selection criteria (Stern 2015, and references therein). We note however, that the luminosities were calculated using the flux obtained from converting the count rates alone, and were not corrected for obscuration effects due to local or line-of-sight absorption; they therefore do not reflect the intrinsic luminosity of the sample. In order to obtain a robust estimation of the true luminosity, we determined the 6 μm rest-frame luminosity for the 29 sources containing information on the magnitudes in the four ALLWISE bands (3.4, 4.6, 12 and 22 μm, Mountrichas et al. 2017). The choice of the wavelength was motivated by the fact that 6 μm provides an unbiased estimate of the bolometric luminosity representing the torus luminosity. Further, the contribution from star-formation is negligible at this wavelength (Mountrichas et al. 2017). The right panel of Fig. 4 shows the distribution of the IR luminosity (in red) and the X-ray luminosity (in blue) for the sample. The median of the IR-luminosity (νLν) distribution is 4.7 × 1046 erg s−1 and the highest determined value is 3.2 × 1047 erg s−1 (indicative of a powerful quasar).
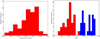 |
Fig. 4. Left panel: X-ray luminosity (in units of erg s−1) distribution of the sub-sample with known redshift; right panel: comparison between X-ray (red) and mid-IR (blue) luminosity distribution from a smaller set where both the X-ray and mid-IR luminosities can be determined. |
Figure 5 shows the comparison of the rest-frame X-ray (0.2–12 keV, not corrected for absorption) and the mid-IR (6 μm) luminosity of this sample. Previous works in this regard have demonstrated how the luminosities are correlated (Gandhi et al. 2009; Fiore et al. 2009; Lanzuisi et al. 2009), including Stern (2015) who formulated the global X-ray to mid-IR relation of AGN which is appropriate for a large range of luminosities from Seyfert galaxies to luminous quasars. Figure 5 shows that the brightest objects in mid-IR are also bright in X-rays. To quantify the correlation, we determined the Kendall’s τ rank correlation coefficient to be 0.70. Artificial correlations may be introduced between luminosities due to the effect of redshift in a flux-limited sample. In order to take this into account, we determined the partial Kendall’s τ rank correlation coefficient to be 0.44, indicating a weaker intrinsic correlation between the X-ray and mid-IR luminosities.
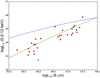 |
Fig. 5. Comparison of X-ray (0.2–12 keV) and mid-IR (6 μm) luminosity (in units of erg s−1) shown in Fig. 4. The blue line denotes the X-ray-mid-IR luminosity relation from Stern (2015). The blue dot marks the candidate obscured AGN identified by comparing the X-ray hardness-ratio of the sample. The cyan dot marks the candidate obscured AGN identified from an unusually low Lx/LIR ratio. The green line denotes the relation derived from this work for the current sample. |
We also compare our results with the X-ray to mid-IR relation of AGN. The X-ray luminosities determined in this work are systematically lower than predicted by the relation. The bias indicates the presence of significant X-ray obscuration. This is because the formulation of Stern (2015) is based on absorption-corrected luminosities in the energy band of 2–10 keV. The X-ray luminosities reported in this work on the other hand are obtained from converting count rates to average flux (0.2–12 keV), and accounting only for a photo-electric foreground absorption by the Galaxy of 6 × 1020 cm−2. As the AGN are distributed uniformly within the XMM-Newton survey area (Fig. 2), an additional obscuration of NH =2 × 1021 cm−2 through the depth of the SMC (as is typically found in the wing region of the SMC; Stanimirovic et al. 1999) corresponds to an increase in the absorption-corrected luminosity of ∼2% in the 2–10 keV energy range and 15% in the 0.2–12 keV range. Similar factors corresponding to NH = 1022 cm−2 (as is typically found in the bar region of the SMC; Stanimirovic et al. 1999) are 8% and 30%, respectively. We performed a least-square polynomial fit to the data and derived a slightly different relation (not corrected for absorption) from Stern (2015):

where Lx is in units of erg s−1 and x ≡ log(νLν/1041 erg s−1). A change in slope of our obtained relation as compared to the global formulation of Stern (2015) indicates that the intrinsic absorption of the AGN is an important contributing factor to the total absorption component. As the AGN intrinsic absorption is redshift dependent, it would have a higher effect on nearby, low-luminosity Seyfert galaxies as compared to luminous and distant quasars in the observer’s reference frame.
3.1.3. X-ray spectral characteristics
The X-ray spectra of an AGN can typically be described by a power law with a photon index of Γ ∼ 1.75 (e.g. Tozzi et al. 2006) and therefore show a hard X-ray spectrum compared to Galactic stars. As shown by Sturm et al. (2013a), hard X-ray sources can be selected efficiently using the hardness-ratio relation,
 (1)
(1)
or sources with HR2 > 0 if HR3 is not defined, due to lack of statistics. Here, hardness ratios are derived by comparing count rates in neighbouring XMM-Newton energy bands: HRi = (Ri + 1 − Ri)/(Ri + 1 + Ri), where i = 1 for 0.2–0.5 keV, i = 2 for 0.5–1.0 keV, i = 3 for 1.0–2.0 keV, i = 4 for 2.0–4.5 keV, and i = 5 for 4.5–12.0 keV. We extracted this information for the AGN sample and plotted the HR2–HR3 hardness–hardness diagram as shown in Fig. 6. We found that almost all the sources (except a few with very large error bars) lie within the specified region for AGN in the HR2–HR3 plane prescribed in Sturm et al. (2013a). This further validated the robustness of our selection.
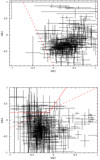 |
Fig. 6. Top panel: hardness ratio diagram for the AGN sample. The dashed line defines the spectral classification criterion in HR3 vs. HR2 by Sturm et al. (2013a) to identify AGN. Bottom panel: hardness ratio diagram, as in the top figure but in different energy bands. The solid wedge and the dashed line define the selection criteria for highly obscured AGN in Brightman & Nandra (2012). |
The mid-IR-based surveys have the potential to find the most obscured and even Compton-thick AGN (NH ≥1024 cm−2), and thus help in identifying X-ray-selected heavily obscured AGN (Secrest et al. 2015, and references therein). This motivated us to look for obscured AGN within the sample. Brightman & Nandra (2012) showed that heavily obscured sources can be well separated in X-rays by being hard in the band HR2 (≡to HR4 band in our definition) and soft in HR1 (≡to HR3 band in our definition). Using Eqs. (1) and (2) from Brightman & Nandra (2012), we found that 13 sources satisfy the criteria of expected NH ≥1024 cm−2 (Compton-thick) and 20 sources satisfy the criteria of expected NH ≥1023 cm−2 (see Fig. 6 and Table A.4). Alternatively, an unusually low Lx/LIR ratio has been used to test the Compton-thick nature of candidates in nearby (z < 0.1) AGN (Severgnini et al. 2012; Rovilos et al. 2014). With this approach we found one more candidate by looking for extreme outliers in the X-ray to mid-IR luminosity comparison (source marked cyan in Fig. 5). All 21 sources were distributed evenly within the survey area, except the bar region of the SMC, where the absorption within the SMC is the highest (see Fig. 2). This is further indicative of the fact that the sources are intrinsically absorbed. The high absorption in the bar region also makes the X-ray detection of the obscured AGN difficult. Interestingly, three of these sources have z ≈ 2, which is indicative of distant objects. The possible luminous, distant, and obscured quasar candidates are rare objects, and their identification is crucial to reproduce the shape of the cosmic X-ray background (see e.g. Gilli et al. 2007). These sources therefore deserve attention for further follow-up studies. The sample of possibly obscured AGN also contains eight newly identified candidates described in Sect. 3.2. The fraction of Compton-thick AGN candidates constitute ∼5% of the total sample, roughly consistent with the fraction detected in the XMM-Newton survey of the COSMOS field (Hasinger et al. 2007) and the Lockman hole (Hasinger et al. 2001).
To confirm their nature, it would be ideal to investigate the X-ray spectra of the sample to constrain the NH, determine the unabsorbed X-ray luminosities of the sources, or look for signatures of obscured AGN, such as a convex-shaped X-ray spectrum indicative of very high NH, or a Fe-K emission line of high equivalent width (see e.g. Terashima et al. 2015). All the sources were however either detected off-axis and/or are X-ray faint. Therefore, the statistical quality of the source spectra was inadequate for performing a meaningful analysis. The identified sources are nevertheless promising targets for follow-up studies of distant obscured quasars.
3.2. Correlation with the SMC X-ray point-source catalogue from 2013
We correlated our sample with the SMC point-source catalogue of Sturm et al. (2013a) which is based on a subset of the observations used for this work. We found that 201 of our 276 sources are included in that catalogue and that 40 of them have already been classified as AGN. The remaining sources were either unclassified or are candidate AGN. Our work further validates the candidate sources as real AGN. Only 8 out of the selected sources were included in the sample of 88 AGN with radio associations (Sturm et al. 2013b). We note that although 12 more out of the 88 sources had a counterpart in the ALLWISE catalogue, their mid-IR colours did not meet the selection criterion of Mateos et al. (2012). The very small overlap between the sample selected from radio associations and those chosen using the present selection methods indicates that these latter methods are perhaps sensitive to different populations of AGN (blazars and radio galaxies vs. Seyfert galaxies).
3.3. Identification of near-infrared counterparts
It is well known that AGN are prominent in the near-IR band, and their variability can be used to identify them (e.g. Edelson et al. 1987).
These two considerations prompted us to cross-identify our objects with the point-source catalogue of the VISTA (Visual and Infrared Survey Telescope for Astronomy; Emerson et al. 2006) Survey of the MC system (VMC; Cioni et al. 2011). The VMC is an ESO public survey, carried out with the wide-field near-IR camera VIRCAM (VISTA InfraRed CAMera; Dalton et al. 2006), mounted at the European Southern Observatory’s (ESO) VISTA 4.1 m telescope. More information about the telescope, the data flow system, and the archive access to the data is given by Irwin et al. (2004); Emerson et al. (2004, 2006); González-Fernández et al. (2018), and Cross et al. (2012), and Cioni et al. (2011) provides a detailed description of the VMC observing strategy. In short, the VMC covers 170 deg2 around the MCs, Bridge, and Stream, down to Ks = 20.3 mag (S/N ∼ 10; Vega system) in three epochs in the Y and J, and in 12 epochs (each of which consists of two or more individual pawprint observations) in the Ks band, spread over a year or longer.
At first we searched for the closest matches within 3″ for our 276 sources with the VMC obtained until March 2017 and identified 274 matches. To evaluate the probability for random coincidence we repeated the search after moving the source coordinates 3′ to the east, and found 191 matches – these constitute a reference sample. The colour–colour diagram of the IR counterparts with detections in all three bands is shown in Fig. 7. The inset shows histograms of the angular separation for the closest match for both the main and reference samples. We note that in many cases, there is more than one counterpart within 3″; those were not counted in the histogram for the main sample, and the higher counts in the reference histogram at separations ≥1″ reflect the existence of additional VMC sources near the position of the objects in our sample. Apparently, the cross-identifications with separations  are secure, and the random coincidences dominate the larger separations. Therefore, we adopt
  as a final matching radius for the VMC cross correlations and the subsequent analysis. This limit guarantees very close to zero contamination, as can be seen from the separation histogram (Fig. 7, inset panel). Another conclusion we draw from this diagram is that the reference sample consists mostly of stars, which is clear from the similarity between the locus it occupies and the stellar locus in Fig. 2 from Cioni et al. (2013). The location of the counterparts strongly supports the AGN nature.
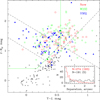 |
Fig. 7. VMC colour–colour diagram. The lines follow Cioni et al. (2013) and show regions where known quasars (upper left of the dashed black lines) and planetary nebulae (left of the green wedge) were found. Our objects are marked with red circles if they are newly identified, green squares if they were identified in the WISE data, or blue triangles if they were present in the HMQ/MILLIQUAS. The symbols are open if there has been no spectroscopic follow up, and solid if the objects have known redshifts from spectra. The reference sample is plotted with black crosses. The inset shows histograms of the angular separations between the objects and their counterparts for our sample (red) and for the reference sample (black). |
Next, we extracted from the VMC catalogue the light curves for all the identified counterparts. For each light curve we calculated a linear fit of the Ks magnitude versus time – this is a simple parametrisation of the objects’ variability, following Cioni et al. (2013) and Ivanov et al. (2016). The properties of the light curves of the target and reference samples are summarised in Fig. 8. Clearly, the identified counterparts are more variable than a randomly selected sample, as expected for a sample dominated by AGN – in good agreement with the results of Cioni et al. (2013) and Ivanov et al. (2016). We note that the difference in the slopes is more evident if we only consider objects observed with at least 15 epochs. Our experiments with the slopes indicated that a smaller number of observations produces less than reliable slopes.
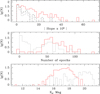 |
Fig. 8. Properties of the VMC Ks band light curves for the counterparts to our targets (red solid line) and of the light curves for the counterparts to the reference sample (black dotted line). Top panel: histograms of the slopes of the linear fits for objects with 15 or more epochs; only reliable slopes are considered in the comparison. The black dashed line is the same as the black dotted, but scaled to match the level of the first bin. Middle panel: histograms of the number of available Ks epochs. Bottom panel: Ks band apparent luminosity functions averaged over epochs. |
The counterparts of our sample tend to be brighter than the counterparts of the reference sample. The latter conclusion accounts, at least partially, for the larger number of epochs of the counterparts to “real” objects than for the counterparts to the “random” objects. Finally, we note that no constraint was imposed on whether the VMC matches are point-like or extended. This was motivated by the fact that some of the confirmed low-redshift quasars in Ivanov et al. (2016) were classified as extended; which means that the VMC has enough spatial resolution to see the host. Furthermore, background quasars can be contaminated by imperfectly aligned foreground VMC stars, giving the quasars an extended appearance.
3.4. Multi-wavelength properties
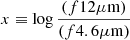
To investigate the distribution of the sources in the mid-IR (ALLWISE) and near-IR (VISTA) parameter space as a function of the total X-ray flux (0.2–12 keV) and the IR (ALLWISE and VISTA) magnitudes, we plotted colour–colour diagram in Figs. 9 and 10. We found that the sample of sources is homogeneously distributed within the ALLWISE ( versus
 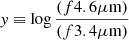 ) and VISTA (Y − J and J − K) colour–colour space as a function of their X-ray fluxes and the ALLWISE and VISTA magnitudes. The medians of the ALLWISE magnitudes are 15.79, 14.88, and 11.88 mag in the W1, W2, and W3 bands, and the corresponding standard deviations are 1.06, 1.00, and 0.92 mag, respectively. The corresponding median values of the VISTA magnitudes in the Y, J, and Ks bands are 19.00, 18.58, and 17.27 mag with standard deviations of 1.03, 1.1, and 1.06 mag, respectively.
 |
Fig. 9. Distribution of the sample in the ALLWISE two-colour selection plane (Mateos et al. 2012). |

 |
Fig. 10. Distribution of the sample in the VISTA two-colour selection plane (Cioni et al. 2013). The two figures are representative of the distribution of the sample in the VISTA plane, and the variation with J and Ks magnitudes shows a similar pattern. X-ray flux (Fx) as in Fig. 9. |
A positive correlation is observed between the integrated X-ray flux (0.2–12 keV) and the ALLWISE and VISTA magnitudes. From Fig. 11 it can be seen that the brightest objects in X-rays correspond to the brightest objects in the W1, W2, and W3 bands of the ALLWISE data, and the Y, J, and Ks magnitudes in the VISTA data.
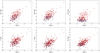 |
Fig. 11. Relation between the X-ray flux and the ALLWISE and VISTA magnitudes. X-ray flux (Fx) as in Fig. 9. Blue dots mark the new candidates identified in this work. |
3.5. Identification of new candidates
We identified 81 new AGN candidates from a sample that was selected using the ALLWISE mid-IR selection criteria of Mateos et al. (2012) albeit with a lower S/N of 3, but with a corresponding X-ray association. This sample is not included in any of the large all-sky AGN catalogues of Secrest et al. (2015) and Flesch (2015, 2017). To ensure that they had not been reported previously, we searched within 3″ of all the source positions in the VizieR database3. We found that for 31 of the 81 sources, the corresponding ALLWISE counterparts were identified in the ARCHES (Astronomical Resource Cross-matching for High Energy Studies) database (Motch et al. 2017) although source classification was not performed. We found however that 22 of the 31 were included in Kozłowski & Kochanek (2009) as AGN candidates. This makes 59 new sources catalogued as AGN candidates for the first time. The X-ray, mid-IR, and NIR colours of the sources, as well as the variability in the NIR band, strongly support their AGN nature and the level of contamination is likely to be almost negligible. The new candidates therefore make a very promising subset for optical spectroscopic follow-up and are listed in Table A.1.
3.6. Optical spectroscopy of new candidates
In order to verify the robustness of our selection of new candidates, we performed optical spectroscopic follow-up of six randomly chosen objects out of the 15 brightest (in X-rays) candidates listed in Table A.1. Low-resolution (R = λ/Δλ ∼ 440) spectra over λ4450-8650Å were obtained with the FOcal Reducer and low dispersion Spectrograph (FORS2; Appenzeller et al. 1998) at the ESO Very Large Telescope. The set up was: long-slit mode, grism 300V+10, order sorting filter GG435+81, slit width 1.3″. Further details are listed in Table A.2. The data reduction closely followed Ivanov et al. (2016), except a newer Reflex-based (Freudling et al. 2013) ESO pipeline version (5.3.23) was used. The finding charts are shown in Fig. B.1, the final spectra are shown in Fig. 12, and the measured emission lines are listed in Table A.3. The candidates are presented in decreasing order of their X-ray fluxes. The results confirm that all of the six objects that were followed up are AGN. One of them (candidate 59) is a distant quasar with z = 2.23. The presence of a broad MgII line in candidates 18, 26, and 35 also confirms that they are quasars. Candidates 06 and 47 are Seyfert galaxies, and the presence of narrow emission lines indicate type 2 Seyferts. Although the 100% success rate of our initial follow-up of the six candidates does not guarantee the validity of all the other candidates, the results are in further support of the robustness of our selection and strongly encourage future follow-ups.
 |
Fig. 12. Spectra of the AGN candidates shifted to rest-frame wavelength. The spectra were smoothed, normalised to an average value of one and offset vertically for display purposes. The SDSS composite quasar spectrum (Vanden Berk et al. 2001) is shown at the top. |
3.7. Comparison of the sample with the expected population of AGN
Seventy-one percent of the X-ray point sources detected in the SMC region by the XMM-Newton are expected to be AGN behind the SMC (Sturm et al. 2013a). This implies that ∼3158 of the 4311 detected unique sources are AGN. Our identification of 276 sources constitutes only a small fraction of the entire expected population. This can be attributed to the limitations of the selection criterion used in this work as well as the data sets which were used for the identification of the sample.
The AGN selection wedge is defined using the Bright Ultra-hard XMM-Newton survey (BUXS). This is one of the largest complete flux-limited samples of bright (flux between 4.5–10 keV > 6.0 × 10⁻¹⁴ erg cm−2 s−1) and ultra-hard (4.5–10 keV) X-ray selected AGN. The sample selected in this work is heavily biased towards these properties which is evident by the fact that the median flux of the sample is very close to the BUXS value. Mateos et al. (2012) further noted that the selection completeness was significantly smaller for type 2 AGN at X-ray luminosities (2–10 keV ) < 1044 erg s−1 than for type 1 AGN. This is mainly attributed to different luminosity distributions for the two classes of AGN, with type 2 being intrinsically less luminous. Further, a sharp decrease in the X-ray detection fraction of ALLWISE objects is expected at 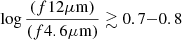 . This is also seen in our sample (Fig. 13), when comparing the AGN identified using the ALLWISE criterion in this work with the entire sample of ALLWISE sources located within the area of the XMM-Newton survey which fulfilled the criterion of Mateos et al. (2012).
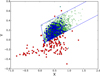 |
Fig. 13. Distribution of sources in the ALLWISE two-colour selection plane (Mateos et al. 2012). |


In order to illustrate the limitations of the data sets which were used for the identification of the sample, we correlated the sample of AGN candidates from Sturm et al. (2013a) which were not confirmed in this work, with the ALLWISE catalogue (using sources with S/N ≥ 3 in W1, W2, and W3 bands and cc_flags ==“0000”). Out of 1989 sources, only 134 were found to have a secure ALLWISE counterpart (shown in Fig. 13). The small fraction of the AGN candidates that were identified with an ALLWISE counterpart is consistent with the fact that only 276 AGN were identified when correlating the entire unique source list of the XMM-Newton SMC survey with the ALLWISE catalogue. The most intriguing point is that almost all of these sources overlap with the horizontal sequence of normal galaxies in the ALLWISE colour–colour space. This points to the fact that most of these 134 sources being at the faint end of the X-ray flux (near the detection limit of the XMM-Newton survey) may have contribution from the host galaxy in the mid-IR emission, causing them to fall outside the selection wedge and overlap with normal galaxies (Mateos et al. 2012; Mountrichas et al. 2017, and references therein). This is further ascertained in Fig. 11, which shows the new AGN candidates which are identified in this work by relaxing the S/N threshold in the W1, W2, and W3 bands. It is evident from the figure that these sources tend to be intrinsically less luminous, and they lie near the detection thresholds in both the X-ray and IR bands. As the correlation between the X-ray and IR bands has a relatively large spread, it is possible that many of these sources fall below the detection threshold in the ALLWISE bands even though they are detected in the X-ray band. This is supported by the very small fraction of ALLWISE counterparts identified as AGN candidates from Sturm et al. (2013a). We further searched for the ALLWISE counterparts of the 58 sources exclusively selected from the HMQ and MILLIQUAS catalogue using the same criteria as above. Only ten sources were found to have a secure ALLWISE counterpart, plotted in Fig. 13. As in the case of AGN candidates from Sturm et al. (2013a), all of these sources lie in the horizontal sequence of normal galaxies in the ALLWISE colour–colour space. This is in further support of the fact that not all AGN lie within the ALLWISE selection wedge of Mateos et al. (2012).
4. Summary and conclusions
In this paper we present a catalogue of 276 AGN behind the SMC by correlating an updated X-ray point-source catalogue of the XMM-Newton SMC survey with already known AGN from the literature or selected using ALLWISE mid-IR colour criteria. Ninety sources in the sample have confirmed redshifts, and the redshift distribution indicates that we detect sources ranging from nearby Seyfert galaxies to distant quasars. We investigated the X-ray luminosity distribution (not corrected for absorption) of the sources and compared it with the IR luminosity distribution (both in the rest-frame).
We identified NIR counterparts of the sources from the VISTA observations, and confirm that the VISTA colours and variability are compatible with that expected from AGN. We also confirm that the X-ray hardness ratios are compatible with that typically expected for AGN. These two results validate the robustness of our selection. We found the sources to be homogeneously distributed in the ALLWISE and VISTA colour–colour space where the AGN are expected to be located. A positive correlation was observed between the integrated X-ray flux (0.2–12 keV) and the ALLWISE and VISTA magnitudes.
The sample contains 81 newly identified candidates (with 59 being introduced for the first time as AGN candidates) which were selected using the ALLWISE mid-IR colours but with a lower S/N criterion than used by Secrest et al. (2015). An initial optical spectroscopic follow-up of 6 out of the 81 candidates confirmed that all six are AGN. This strongly supports the robustness of the sample of candidate AGN and encourages further follow-up analyses of the rest of the sample. We also identified possible candidates for distant obscured quasars behind the SMC. All of these make a very promising subset for optical spectroscopic follow-up to confirm the nature of the sources, and/or X-ray spectral analysis to determine the degree and nature of obscuration towards the source.
In this work ∼75% of the sources are identified using mid-IR colour-selection criteria. This technique is very useful in finding the most luminous and obscured AGN. However, the sample is expected to be incomplete at lower luminosities where the contamination from the host galaxy begins to dominate and renders the mid-IR colours bluer, causing them to fall outside the selection wedge (Mateos et al. 2012; Mountrichas et al. 2017, and references therein). Therefore, using these criteria we possibly miss the faint AGN, which become indistinguishable in X-rays from star-forming galaxies.
After resolving a known problem in coordinate conversion from SAS 15.0 onwards, a better agreement between the X-ray and optical positions was obtained. See https://www.cosmos.esa.int/web/xmm-newton/sas-release-notes-1500
Acknowledgments
The XMM-Newton project is supported by the Bundesministerium für Wirtschaft und Technologie/Deutsches Zentrum für Luft- und Raumfahrt (BMWI/DLR, FKZ 50 OX 0001) and the Max-Planck Society. M.-R.L.C. has received support from the European Research Council (ERC) under European Unions Horizon 2020 research and innovation programme (grant agreement No 682115). We thank the Cambridge Astronomy Survey Unit (CASU) and the Wide Field Astronomy Unit (WFAU) in Edinburgh for providing calibrated data products under the support of the Science and Technology Facility Council (STFC).
References
- Appenzeller, I., Fricke, K., Fürtig, W., et al. 1998, The Messenger, 94, 1 [NASA ADS] [Google Scholar]
- Assef, R. J., Stern, D., Kochanek, C. S., et al. 2013, ApJ, 772, 26 [NASA ADS] [CrossRef] [Google Scholar]
- Brightman, M., & Nandra, K. 2012, MNRAS, 422, 1166 [NASA ADS] [CrossRef] [Google Scholar]
- Caputi, K. I. 2014, Int. J. Mod. Phys. D, 23, 1430015 [NASA ADS] [CrossRef] [Google Scholar]
- Cioni, M.-R. L., Clementini, G., Girardi, L., et al. 2011, A&A, 527, A116 [NASA ADS] [CrossRef] [EDP Sciences] [Google Scholar]
- Cioni, M.-R. L., Kamath, D., Rubele, S., et al. 2013, A&A, 549, A29 [NASA ADS] [CrossRef] [EDP Sciences] [Google Scholar]
- Cioni, M.-R. L., Girardi, L., Moretti, M. I., et al. 2014, A&A, 562, A32 [NASA ADS] [CrossRef] [EDP Sciences] [Google Scholar]
- Cross, N. J. G., Collins, R. S., Mann, R. G., et al. 2012, A&A, 548, A119 [NASA ADS] [CrossRef] [EDP Sciences] [Google Scholar]
- Dalton, G. B., Caldwell, M., Ward, A. K., et al. 2006, in Proc. SPIE, 6269, 62690X [CrossRef] [Google Scholar]
- Della Ceca, R., Caccianiga, A., Severgnini, P., et al. 2008, A&A, 487, 119 [NASA ADS] [CrossRef] [EDP Sciences] [Google Scholar]
- Dickey, J. M., & Lockman, F. J. 1990, ARA&A, 28, 215 [NASA ADS] [CrossRef] [MathSciNet] [Google Scholar]
- Dobrzycki, A., Macri, L. M., Stanek, K. Z., & Groot, P. J. 2003a, AJ, 125, 1330 [NASA ADS] [CrossRef] [Google Scholar]
- Dobrzycki, A., Stanek, K. Z., Macri, L. M., & Groot, P. J. 2003b, AJ, 126, 734 [NASA ADS] [CrossRef] [Google Scholar]
- Donley, J. L., Koekemoer, A. M., Brusa, M., et al. 2012, ApJ, 748, 142 [NASA ADS] [CrossRef] [Google Scholar]
- Edelson, R. A., Malkan, M. A., & Rieke, G. H. 1987, ApJ, 321, 233 [NASA ADS] [CrossRef] [Google Scholar]
- Emerson, J., McPherson, A., & Sutherland, W. 2006, The Messenger, 126, 41 [NASA ADS] [Google Scholar]
- Emerson, J. P., Irwin, M. J., Lewis, J., et al. 2004, in Optimizing Scientific Return for Astronomy through Information Technologies, eds. P. J. Quinn, & A. Bridger, Proc. SPIE, 5493, 401 [NASA ADS] [CrossRef] [Google Scholar]
- Eyer, L. 2002, Acta Astron., 52, 241 [NASA ADS] [Google Scholar]
- Fabian, A. C., & Iwasawa, K. 1999, MNRAS, 303, L34 [NASA ADS] [CrossRef] [Google Scholar]
- Fiore, F., Puccetti, S., Brusa, M., et al. 2009, ApJ, 693, 447 [NASA ADS] [CrossRef] [Google Scholar]
- Flesch, E. W. 2015, PASA, 32, e010 [NASA ADS] [CrossRef] [Google Scholar]
- Flesch, E. W. 2017, VizieR Online Data Catalog: VII/277 [Google Scholar]
- Freudling, W., Romaniello, M., Bramich, D. M., et al. 2013, A&A, 559, A96 [NASA ADS] [CrossRef] [EDP Sciences] [Google Scholar]
- Gandhi, P., Horst, H., Smette, A., et al. 2009, A&A, 502, 457 [NASA ADS] [CrossRef] [EDP Sciences] [Google Scholar]
- Geha, M., Alcock, C., Allsman, R. A., et al. 2003, AJ, 125, 1 [NASA ADS] [CrossRef] [Google Scholar]
- Gilli, R., Comastri, A., & Hasinger, G. 2007, A&A, 463, 79 [NASA ADS] [CrossRef] [EDP Sciences] [Google Scholar]
- González-Fernández, C., Hodgkin, S. T., Irwin, M. J., et al. 2018, MNRAS, 474, 5459 [NASA ADS] [CrossRef] [Google Scholar]
- Haberl, F., Sturm, R., Ballet, J., et al. 2012, A&A, 545, A128 [NASA ADS] [CrossRef] [EDP Sciences] [Google Scholar]
- Hasinger, G., Altieri, B., Arnaud, M., et al. 2001, A&A, 365, L45 [NASA ADS] [CrossRef] [EDP Sciences] [Google Scholar]
- Hasinger, G., Cappelluti, N., Brunner, H., et al. 2007, ApJS, 172, 29 [NASA ADS] [CrossRef] [Google Scholar]
- Irwin, M. J., Lewis, J., Hodgkin, S., et al. 2004, in Optimizing Scientific Return for Astronomy through Information Technologies, eds. P. J. Quinn, & A. Bridger, Proc. SPIE, 5493, 411 [Google Scholar]
- Ivanov, V. D., Cioni, M.-R. L., Bekki, K., et al. 2016, A&A, 588, A93 [NASA ADS] [CrossRef] [EDP Sciences] [Google Scholar]
- Jansen, F., Lumb, D., Altieri, B., et al. 2001, A&A, 365, L1 [NASA ADS] [CrossRef] [EDP Sciences] [Google Scholar]
- Kallivayalil, N., van der Marel, R. P., Besla, G., Anderson, J., & Alcock, C. 2013, ApJ, 764, 161 [NASA ADS] [CrossRef] [Google Scholar]
- Kelly, B. C., Bechtold, J., & Siemiginowska, A. 2009, ApJ, 698, 895 [Google Scholar]
- Kozłowski, S., & Kochanek, C. S. 2009, ApJ, 701, 508 [NASA ADS] [CrossRef] [Google Scholar]
- Kozłowski, S., Kochanek, C. S., & Udalski, A. 2011, ApJS, 194, 22 [NASA ADS] [CrossRef] [Google Scholar]
- Kozłowski, S., Onken, C. A., Kochanek, C. S., et al. 2013, ApJ, 775, 92 [NASA ADS] [CrossRef] [Google Scholar]
- Lacy, M., Storrie-Lombardi, L. J., Sajina, A., et al. 2004, ApJS, 154, 166 [NASA ADS] [CrossRef] [Google Scholar]
- Lanzuisi, G., Piconcelli, E., Fiore, F., et al. 2009, A&A, 498, 67 [NASA ADS] [CrossRef] [EDP Sciences] [Google Scholar]
- Mateos, S., Alonso-Herrero, A., Carrera, F. J., et al. 2012, MNRAS, 426, 3271 [NASA ADS] [CrossRef] [Google Scholar]
- Mills, B. Y., Little, A. G., Durdin, J. M., & Kesteven, M. J. 1982, MNRAS, 200, 1007 [NASA ADS] [Google Scholar]
- Motch, C., Carrera, F., Genova, F., et al. 2017, in Proceedings of a conference held at Rydges World Square, Sydney, NSW, Australia, eds. N. P. F. Lorente, K. Shortridge, & R. Wayth (San Francisco: ASP), 165 [Google Scholar]
- Mountrichas, G., Georgantopoulos, I., Secrest, N. J., et al. 2017, MNRAS, 468, 3042 [NASA ADS] [CrossRef] [Google Scholar]
- Rosen, S. R., Webb, N. A., Watson, M. G., et al. 2016, A&A, 590, A1 [NASA ADS] [CrossRef] [EDP Sciences] [Google Scholar]
- Rovilos, E., Georgantopoulos, I., Akylas, A., et al. 2014, MNRAS, 438, 494 [NASA ADS] [CrossRef] [Google Scholar]
- Secrest, N. J., Dudik, R. P., Dorland, B. N., et al. 2015, ApJS, 221, 12 [NASA ADS] [CrossRef] [Google Scholar]
- Severgnini, P., Caccianiga, A., & Della Ceca, R. 2012, A&A, 542, A46 [NASA ADS] [CrossRef] [EDP Sciences] [Google Scholar]
- Stanimirovic, S., Staveley-Smith, L., Dickey, J. M., Sault, R. J., & Snowden, S. L. 1999, MNRAS, 302, 417 [NASA ADS] [CrossRef] [Google Scholar]
- Stern, D. 2015, ApJ, 807, 129 [NASA ADS] [CrossRef] [Google Scholar]
- Stern, D., Eisenhardt, P., Gorjian, V., et al. 2005, ApJ, 631, 163 [NASA ADS] [CrossRef] [Google Scholar]
- Stern, D., Assef, R. J., Benford, D. J., et al. 2012, ApJ, 753, 30 [NASA ADS] [CrossRef] [Google Scholar]
- Sturm, R., Haberl, F., Pietsch, W., et al. 2013a, A&A, 558, A3 [NASA ADS] [CrossRef] [EDP Sciences] [Google Scholar]
- Sturm, R., Drašković, D., Filipović, M. D., et al. 2013b, A&A, 558, A101 [NASA ADS] [CrossRef] [EDP Sciences] [Google Scholar]
- Terashima, Y., Hirata, Y., Awaki, H., et al. 2015, ApJ, 814, 11 [NASA ADS] [CrossRef] [Google Scholar]
- Tinney, C. G., Da Costa, G. S., & Zinnecker, H. 1997, MNRAS, 285, 111 [NASA ADS] [CrossRef] [Google Scholar]
- Tozzi, P., Gilli, R., Mainieri, V., et al. 2006, A&A, 451, 457 [NASA ADS] [CrossRef] [EDP Sciences] [Google Scholar]
- Vanden Berk, D. E., Richards, G. T., Bauer, A., et al. 2001, AJ, 122, 549 [NASA ADS] [CrossRef] [Google Scholar]
- Wilkes, B. J., Wright, A. E., Jauncey, D. L., & Peterson, B. A. 1983, PASA, 5, 2 [NASA ADS] [CrossRef] [Google Scholar]
- Wright, E. L., Eisenhardt, P. R. M., Mainzer, A. K., et al. 2010, AJ, 140, 1868 [NASA ADS] [CrossRef] [Google Scholar]
Appendix A: Additional Tables
Newly identified AGN candidates from the XMM-Newton SMC survey selected using ALLWISE mid-IR colour selection.
Log of the spectroscopic observations.
Derived line parameters from our optical spectra.
Identified candidates for obscured AGN.
Sample of the first five entries in the catalogue of AGN compiled from this work.
Appendix B: Additional Figure
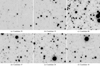 |
Fig. B.1. Finding charts in the Y-band for all 6 objects (crosses) with follow-up spectroscopy. The images are 1 × 1 arcmin2. North is at the top and east is to the left. |
All Tables
New XMM-Newton observations since Sturm et al. (2013a) given in chronological order.
Newly identified AGN candidates from the XMM-Newton SMC survey selected using ALLWISE mid-IR colour selection.
Sample of the first five entries in the catalogue of AGN compiled from this work.
All Figures
|
Fig. 1. Distribution of uncertainty-normalised angular separations for 276 XMM-Newton correlations with the total AGN sample of 2753 sources. For real counterparts, we expect a Rayleigh distribution. The vertical line indicates the 99.7% completeness. |
| In the text | |
|
Fig. 2. Mosaic image of all XMM-Newton observations used in the updated SMC survey. Red/green/blue: 0.2–1.0/1.0–2.0/2.0–4.5 keV intensities. White circles denote the sources selected from Secrest et al. (2015), green circles those from the HMQ and MILLIQUAS survey (Flesch 2015, 2017), and red circles mark the 81 new AGN candidates that we identified. The magenta crosses indicate the candidates for obscured AGN. The circle radius is scaled with the uncertainty on the X-ray positions. |
| In the text | |
|
Fig. 3. Left panel: X-ray flux (in units of 10−11 erg cm−2 s−1 in the energy range of 0.2–12 keV) distribution of the sample; right panel: redshift distribution of the sample, where known (in red), and redshift distribution of all AGN with known z (in blue) within the XMM-Newton SMC survey from (Secrest et al. 2015). |
| In the text | |
|
Fig. 4. Left panel: X-ray luminosity (in units of erg s−1) distribution of the sub-sample with known redshift; right panel: comparison between X-ray (red) and mid-IR (blue) luminosity distribution from a smaller set where both the X-ray and mid-IR luminosities can be determined. |
| In the text | |
|
Fig. 5. Comparison of X-ray (0.2–12 keV) and mid-IR (6 μm) luminosity (in units of erg s−1) shown in Fig. 4. The blue line denotes the X-ray-mid-IR luminosity relation from Stern (2015). The blue dot marks the candidate obscured AGN identified by comparing the X-ray hardness-ratio of the sample. The cyan dot marks the candidate obscured AGN identified from an unusually low Lx/LIR ratio. The green line denotes the relation derived from this work for the current sample. |
| In the text | |
|
Fig. 6. Top panel: hardness ratio diagram for the AGN sample. The dashed line defines the spectral classification criterion in HR3 vs. HR2 by Sturm et al. (2013a) to identify AGN. Bottom panel: hardness ratio diagram, as in the top figure but in different energy bands. The solid wedge and the dashed line define the selection criteria for highly obscured AGN in Brightman & Nandra (2012). |
| In the text | |
|
Fig. 7. VMC colour–colour diagram. The lines follow Cioni et al. (2013) and show regions where known quasars (upper left of the dashed black lines) and planetary nebulae (left of the green wedge) were found. Our objects are marked with red circles if they are newly identified, green squares if they were identified in the WISE data, or blue triangles if they were present in the HMQ/MILLIQUAS. The symbols are open if there has been no spectroscopic follow up, and solid if the objects have known redshifts from spectra. The reference sample is plotted with black crosses. The inset shows histograms of the angular separations between the objects and their counterparts for our sample (red) and for the reference sample (black). |
| In the text | |
|
Fig. 8. Properties of the VMC Ks band light curves for the counterparts to our targets (red solid line) and of the light curves for the counterparts to the reference sample (black dotted line). Top panel: histograms of the slopes of the linear fits for objects with 15 or more epochs; only reliable slopes are considered in the comparison. The black dashed line is the same as the black dotted, but scaled to match the level of the first bin. Middle panel: histograms of the number of available Ks epochs. Bottom panel: Ks band apparent luminosity functions averaged over epochs. |
| In the text | |
|
Fig. 9. Distribution of the sample in the ALLWISE two-colour selection plane (Mateos et al. 2012). |
| In the text | |
|
Fig. 10. Distribution of the sample in the VISTA two-colour selection plane (Cioni et al. 2013). The two figures are representative of the distribution of the sample in the VISTA plane, and the variation with J and Ks magnitudes shows a similar pattern. X-ray flux (Fx) as in Fig. 9. |
| In the text | |
|
Fig. 11. Relation between the X-ray flux and the ALLWISE and VISTA magnitudes. X-ray flux (Fx) as in Fig. 9. Blue dots mark the new candidates identified in this work. |
| In the text | |
|
Fig. 12. Spectra of the AGN candidates shifted to rest-frame wavelength. The spectra were smoothed, normalised to an average value of one and offset vertically for display purposes. The SDSS composite quasar spectrum (Vanden Berk et al. 2001) is shown at the top. |
| In the text | |
|
Fig. 13. Distribution of sources in the ALLWISE two-colour selection plane (Mateos et al. 2012). |
| In the text | |
|
Fig. B.1. Finding charts in the Y-band for all 6 objects (crosses) with follow-up spectroscopy. The images are 1 × 1 arcmin2. North is at the top and east is to the left. |
| In the text | |
Current usage metrics show cumulative count of Article Views (full-text article views including HTML views, PDF and ePub downloads, according to the available data) and Abstracts Views on Vision4Press platform.
Data correspond to usage on the plateform after 2015. The current usage metrics is available 48-96 hours after online publication and is updated daily on week days.
Initial download of the metrics may take a while.