Fig. 5.
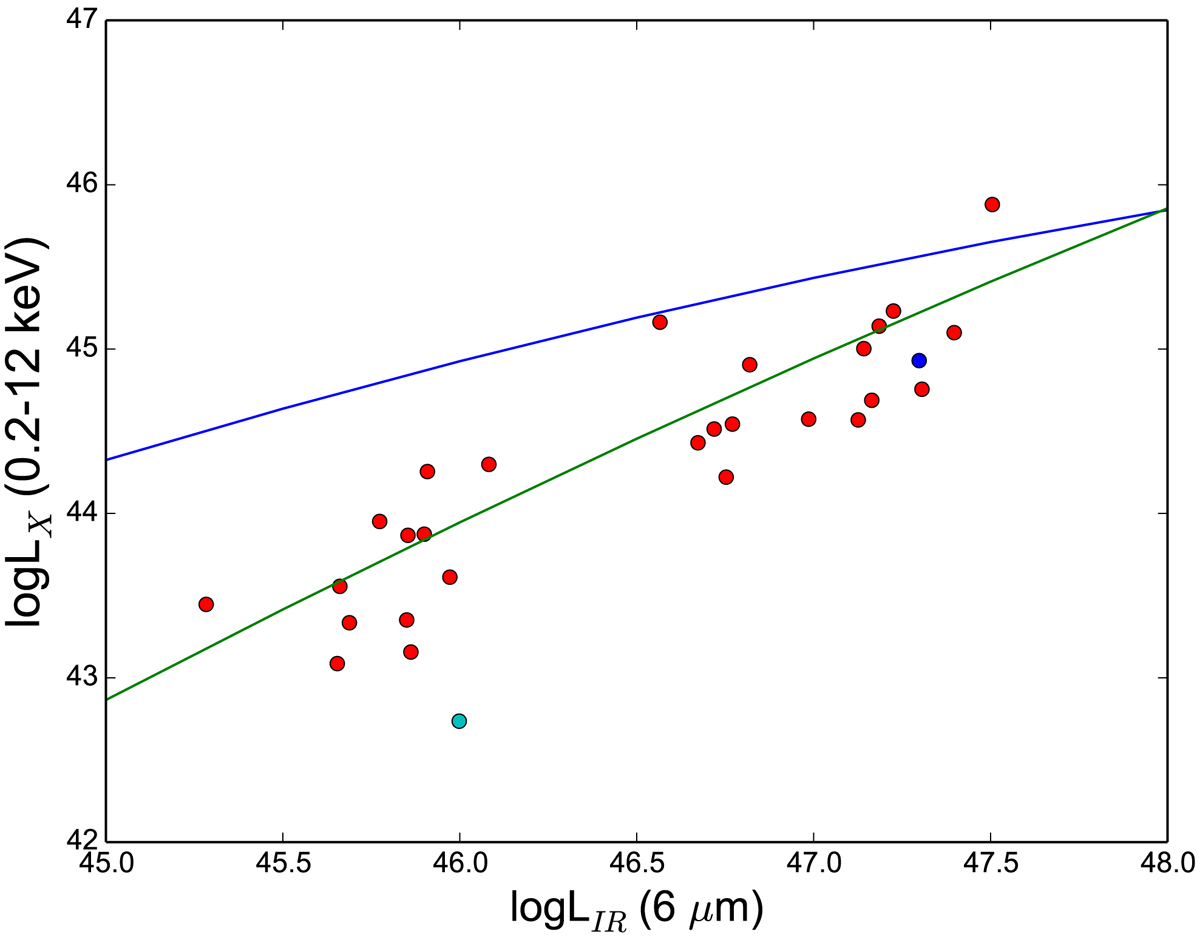
Comparison of X-ray (0.2–12 keV) and mid-IR (6 μm) luminosity (in units of erg s−1) shown in Fig. 4. The blue line denotes the X-ray-mid-IR luminosity relation from Stern (2015). The blue dot marks the candidate obscured AGN identified by comparing the X-ray hardness-ratio of the sample. The cyan dot marks the candidate obscured AGN identified from an unusually low Lx/LIR ratio. The green line denotes the relation derived from this work for the current sample.
Current usage metrics show cumulative count of Article Views (full-text article views including HTML views, PDF and ePub downloads, according to the available data) and Abstracts Views on Vision4Press platform.
Data correspond to usage on the plateform after 2015. The current usage metrics is available 48-96 hours after online publication and is updated daily on week days.
Initial download of the metrics may take a while.