Fig. 8.
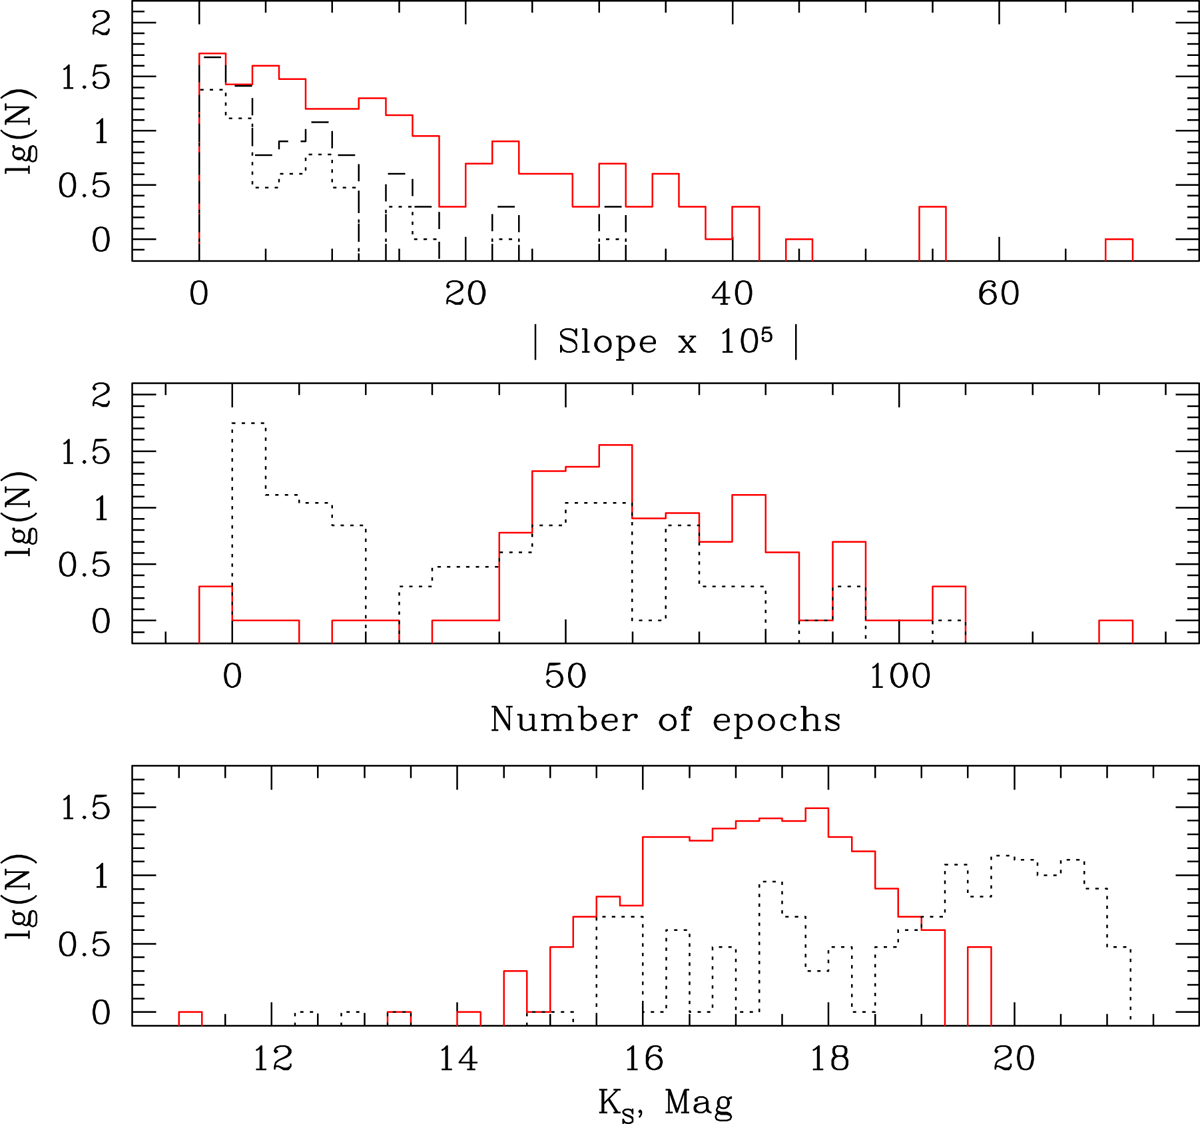
Properties of the VMC Ks band light curves for the counterparts to our targets (red solid line) and of the light curves for the counterparts to the reference sample (black dotted line). Top panel: histograms of the slopes of the linear fits for objects with 15 or more epochs; only reliable slopes are considered in the comparison. The black dashed line is the same as the black dotted, but scaled to match the level of the first bin. Middle panel: histograms of the number of available Ks epochs. Bottom panel: Ks band apparent luminosity functions averaged over epochs.
Current usage metrics show cumulative count of Article Views (full-text article views including HTML views, PDF and ePub downloads, according to the available data) and Abstracts Views on Vision4Press platform.
Data correspond to usage on the plateform after 2015. The current usage metrics is available 48-96 hours after online publication and is updated daily on week days.
Initial download of the metrics may take a while.