Fig. 6.
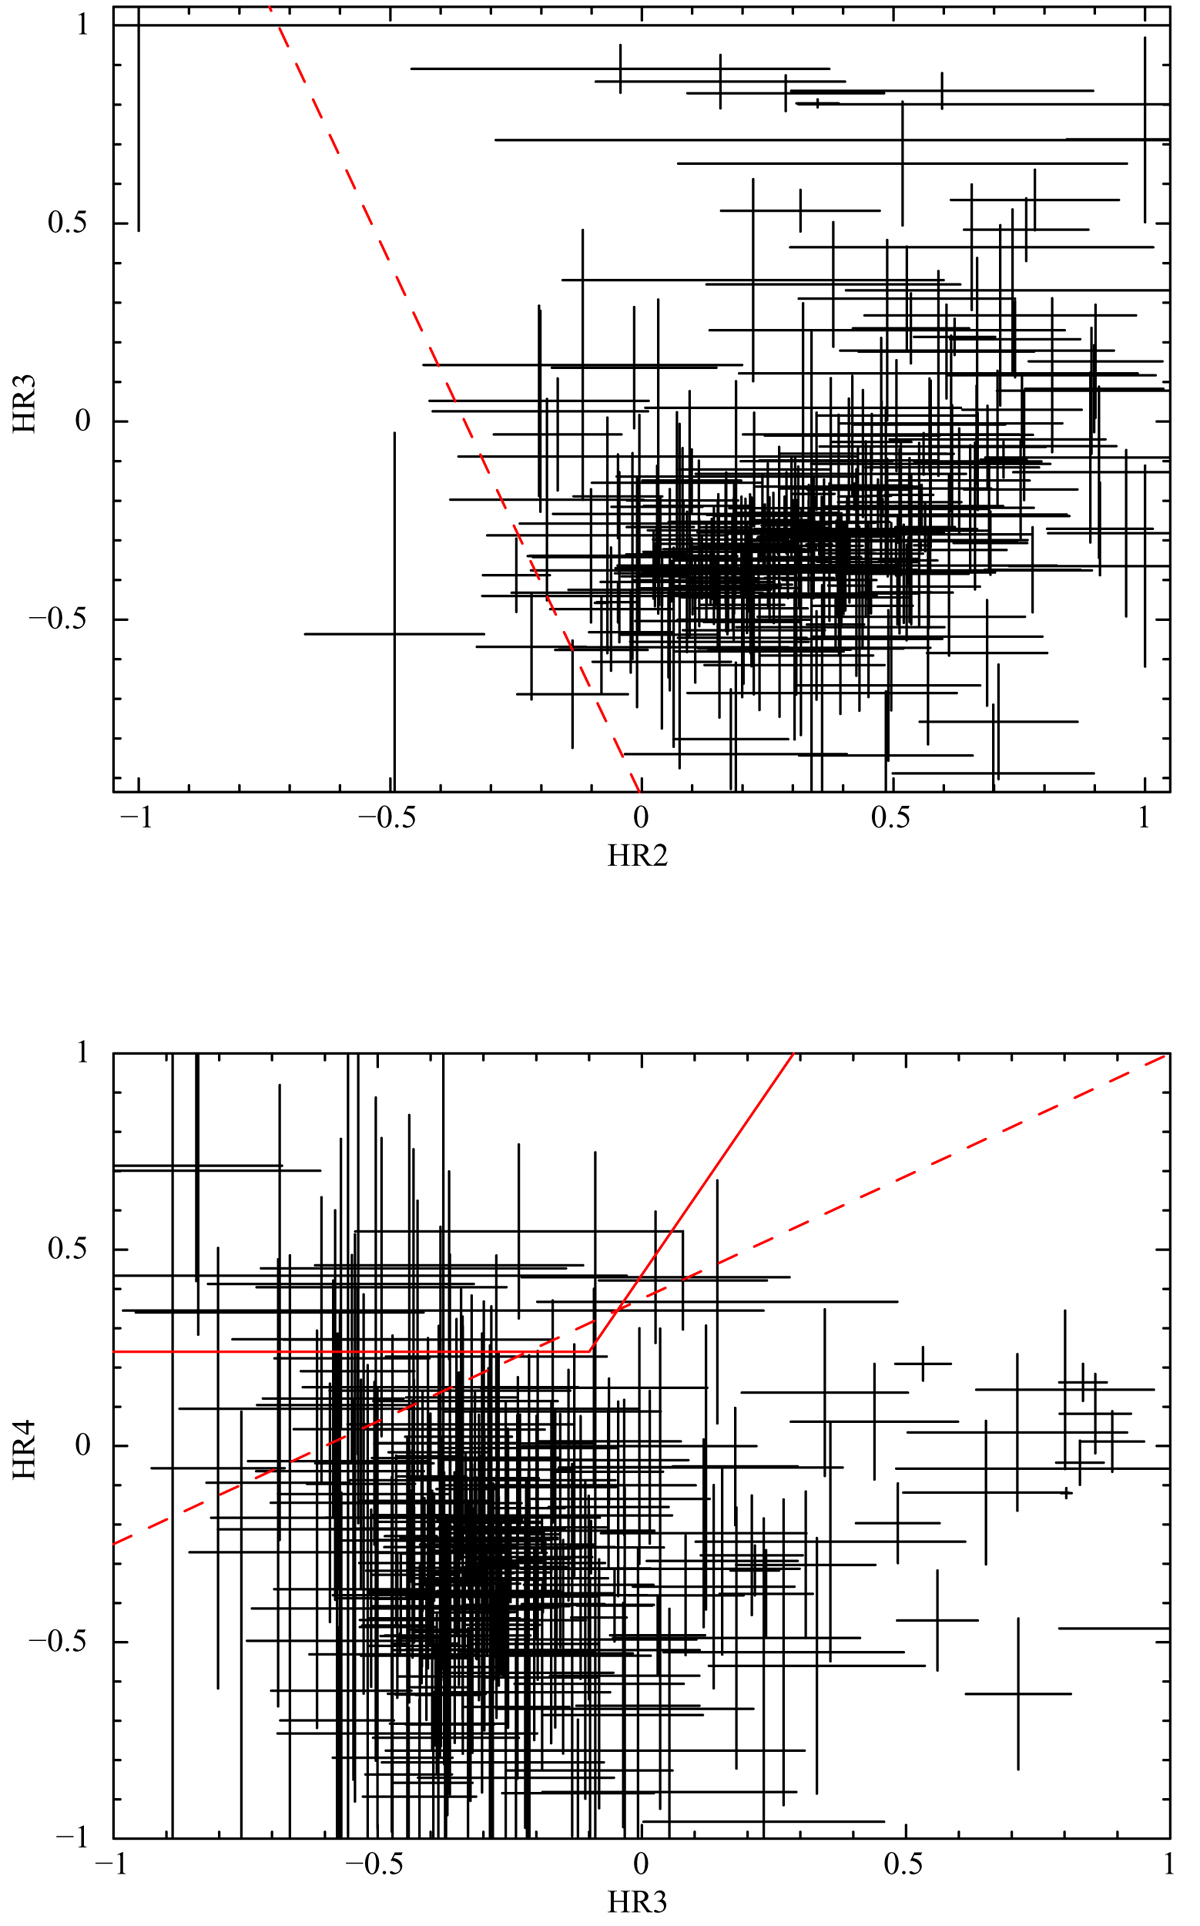
Top panel: hardness ratio diagram for the AGN sample. The dashed line defines the spectral classification criterion in HR3 vs. HR2 by Sturm et al. (2013a) to identify AGN. Bottom panel: hardness ratio diagram, as in the top figure but in different energy bands. The solid wedge and the dashed line define the selection criteria for highly obscured AGN in Brightman & Nandra (2012).
Current usage metrics show cumulative count of Article Views (full-text article views including HTML views, PDF and ePub downloads, according to the available data) and Abstracts Views on Vision4Press platform.
Data correspond to usage on the plateform after 2015. The current usage metrics is available 48-96 hours after online publication and is updated daily on week days.
Initial download of the metrics may take a while.