Free Access
Fig. 10.
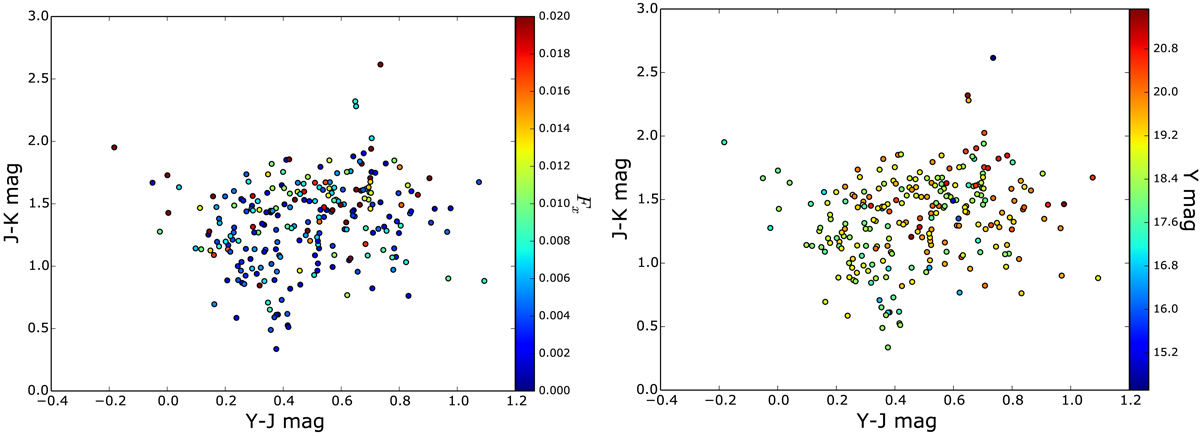
Distribution of the sample in the VISTA two-colour selection plane (Cioni et al. 2013). The two figures are representative of the distribution of the sample in the VISTA plane, and the variation with J and Ks magnitudes shows a similar pattern. X-ray flux (Fx) as in Fig. 9.
Current usage metrics show cumulative count of Article Views (full-text article views including HTML views, PDF and ePub downloads, according to the available data) and Abstracts Views on Vision4Press platform.
Data correspond to usage on the plateform after 2015. The current usage metrics is available 48-96 hours after online publication and is updated daily on week days.
Initial download of the metrics may take a while.