Fig. 7.
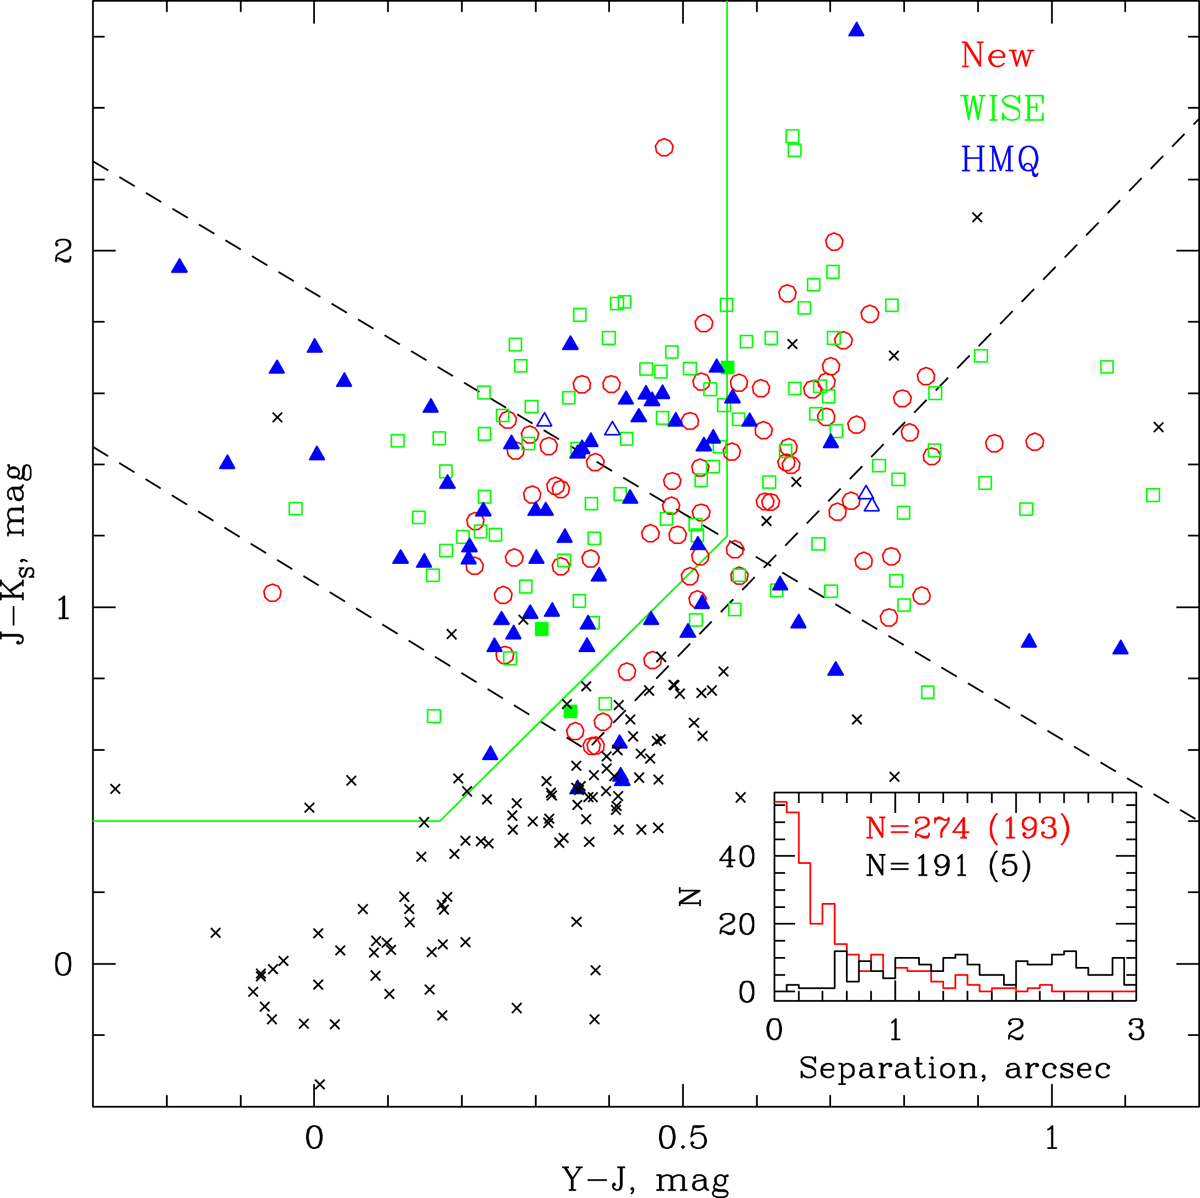
VMC colour–colour diagram. The lines follow Cioni et al. (2013) and show regions where known quasars (upper left of the dashed black lines) and planetary nebulae (left of the green wedge) were found. Our objects are marked with red circles if they are newly identified, green squares if they were identified in the WISE data, or blue triangles if they were present in the HMQ/MILLIQUAS. The symbols are open if there has been no spectroscopic follow up, and solid if the objects have known redshifts from spectra. The reference sample is plotted with black crosses. The inset shows histograms of the angular separations between the objects and their counterparts for our sample (red) and for the reference sample (black).
Current usage metrics show cumulative count of Article Views (full-text article views including HTML views, PDF and ePub downloads, according to the available data) and Abstracts Views on Vision4Press platform.
Data correspond to usage on the plateform after 2015. The current usage metrics is available 48-96 hours after online publication and is updated daily on week days.
Initial download of the metrics may take a while.