Free Access
Fig. 3.
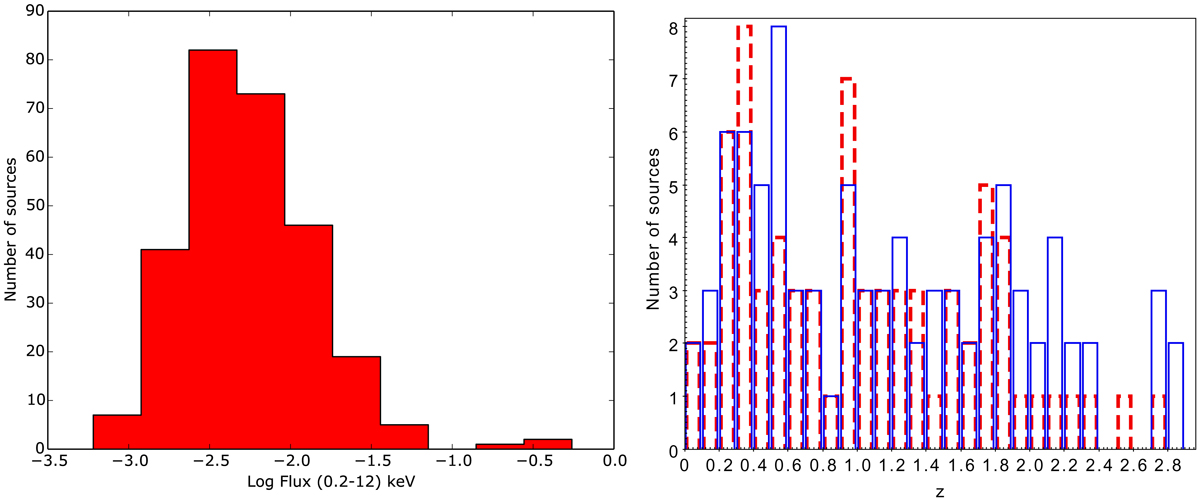
Left panel: X-ray flux (in units of 10−11 erg cm−2 s−1 in the energy range of 0.2–12 keV) distribution of the sample; right panel: redshift distribution of the sample, where known (in red), and redshift distribution of all AGN with known z (in blue) within the XMM-Newton SMC survey from (Secrest et al. 2015).
Current usage metrics show cumulative count of Article Views (full-text article views including HTML views, PDF and ePub downloads, according to the available data) and Abstracts Views on Vision4Press platform.
Data correspond to usage on the plateform after 2015. The current usage metrics is available 48-96 hours after online publication and is updated daily on week days.
Initial download of the metrics may take a while.