| Issue |
A&A
Volume 622, February 2019
|
|
|---|---|---|
| Article Number | A176 | |
| Number of page(s) | 25 | |
| Section | Catalogs and data | |
| DOI | https://doi.org/10.1051/0004-6361/201833036 | |
| Published online | 21 February 2019 | |
J-PLUS: The Javalambre Photometric Local Universe Survey
1
Centro de Estudios de Física del Cosmos de Aragón (CEFCA), Unidad Asociada al CSIC, Plaza de San Juan, 1, 44001 Teruel, Spain
e-mail: This email address is being protected from spambots. You need JavaScript enabled to view it.
2
Centro de Estudios de Física del Cosmos de Aragón (CEFCA), Plaza de San Juan, 1, 44001 Teruel, Spain
3
Instituto de Astrofísica de Canarias (IAC), Vía Láctea s/n, 38205 La Laguna, Tenerife, Spain
4
Departamento de Astrofísica, Universidad de La Laguna (ULL), 38206 La Laguna, Tenerife, Spain
5
Departamento de Astronomia, Universidade Federal do Rio Grande do Sul, Av. Bento Gonçalves, 9500, Porto Alegre 91501-970 RS, Brazil
6
Observatório Nacional do Rio de Janeiro (ON), Rua Gal. José Cristino 77, São Cristóvão, 20921-400 Rio de Janeiro, RJ, Brazil
7
University of Michigan, Dept. Astronomy, 1085 S. University Ann Arbor, MI 48109, USA
8
University of Alabama, Dept. of Phys. & Astronomy, Gallalee Hall, Tuscaloosa, AL 35401, USA
9
Observatório do Valongo (OV), Universidade Federal do Rio de Janeiro (UFRJ), Ladeira Pedro Antonio 43, 20080-090 Rio de Janeiro, Brazil
10
Instituto de Astronomia, Geofísica e Ciências Atmosféricas (IAG), Universidade de São Paulo (USP), Rua do Matão 1226, C. Universitária, 05508-090 São Paulo, Brazil
11
Department of Physics, JINA Center for the Evolution of the Elements, University of Notre Dame, Notre Dame, IN 46556, USA
12
Centro de Astrobiología, CSIC-INTA, ESAC campus, camino bajo del castillo s/n, 28692 Villanueva de la Cañada, Madrid, Spain
13
Departamento de Física, Universidade Federal do Rio Grande do Norte, 59072-970 Natal, RN, Brazil
14
Departamento de Física, Universidade Federal de Sergipe (UFS), Av. Marechal Rondon, s/n, 49000-000 São Cristóvão, SE, Brazil
15
X-ray Astrophysics Laboratory, NASA Goddard Space Flight Center, Greenbelt, MD 20771, USA
16
Department of Physics, University of Maryland, Baltimore County, 1000 Hilltop Circle, Baltimore, MD 21250, USA
17
Tartu Observatory, Tartu University, Observatooriumi 1, Tõravere, 61602 Tartu Maakond, Estonia
18
Instituto de Física, Universidade de São Paulo, Rua do Matão 1371, 05508-090 São Paulo, SP, Brazil
19
Instituto de Astrofísica de Andalucía (IAA), Consejo Superior de Investigaciones Científicas (CSIC), Glorieta de Astronomía, s/n, 18008 Granada, Spain
20
Laboratoire d’astroparticules et cosmologie (APC), 10 Rue Alice Domon et Léonie Duquet, 75013 Paris, France
21
Instituto de Radioastronomía y Astrofísica (IRyA), Universidad Nacional Autónoma de México (UNAM), Antigua Carretera a Pátzcuaro # 8701, Ex-Hda. San José de la Huerta, 58341 Morelos, Mich., Mexico
22
Instituto de Ciencias del Cosmos (ICC), Universitat de Barcelona (UB), Martíi Franquès 1, 08028 Barcelona, Spain
23
Universitat de Barcelona, Gran Via de les Corts Catalanes 585, 08007, Barcelona
24
European Space Astronomy Centre (ESAC), 28692 Villanueva de la Cañada, Madrid, Spain
25
PITT PACC, Department of Physics and Astronomy, University of Pittsburgh, Pittsburgh, PA 15260, USA
26
Instituto de Física de Cantabria (Universidad de Cantabria – CSIC), Av. de los Castros, 39005 Santander Cantabria, Spain
27
Departamento de Física, Campus Reitor João David Ferreira Lima, s/n – Trindade, 88040-900 Florianópolis, SC, Brazil
28
Finnish Centre for Astronomy with ESO (FINCA), University of Turku, Väisäläntie 20, 21500 Piikkiö, Finland
29
Tuorla Observatory, Department of Physics and Astronomy, University of Turku, Väisäläntie 20, 21500 Piikkiö, Finland
30
University of Warwick, Coventry CV4 7AL, UK
31
Institució Catalana de Recerca i Estudis Avançats (ICREA), Passeig Lluís Companys 23, 08010 Barcelona, Spain
32
Institute for Astronomy, University of Edinburgh, Royal Observatory, Blackford Hill, Edinburgh EH9 3HJ, UK
33
European Southern Observatory, Karl-Schwarzschild-Str. 2, 85748 Garching, Germany
34
Departament de Física, Universitat Politècnica de Catalunya, C/Esteve Terrades 5, 08860 Casteldefells, Spain
35
Institute for Space Studies of Catalonia, c/Gran Capità 2–4, Edif. Nexus 201, 08034 Barcelona, Spain
36
Instituto de Física (IF), Universidade Federal do Rio de Janeiro (UFRJ), 68528, CEP, 21941-972 Rio de Janeiro, RJ, Brazil
37
Department of Physics and Astronomy, University of Pennsylvania, 209 S 33rd St, Philadelphia, PA 19104, USA
38
Universidad Complutense de Madrid, Departamento de Astrofísica, Facultad de Ciencias, Plaza de Ciencias, 1, Ciudad Universitaria, 28040 Madrid, Spain
39
European Southern Observatory (ESO), Alonso de Córdova 3107, Vitacura, Santiago, Chile
40
Campus Duque de Caxias, Universidade Federal do Rio de Janeiro (UFRJ), CEP, 25245-390 Duque de Caxias, RJ, Brazil
Received:
16
March
2018
Accepted:
26
November
2018
Abstract
The Javalambre Photometric Local Universe Survey (J-PLUS ) is an ongoing 12-band photometric optical survey, observing thousands of square degrees of the Northern Hemisphere from the dedicated JAST/T80 telescope at the Observatorio Astrofísico de Javalambre (OAJ). The T80Cam is a camera with a field of view of 2 deg2 mounted on a telescope with a diameter of 83 cm, and is equipped with a unique system of filters spanning the entire optical range (3500–10 000 Å). This filter system is a combination of broad-, medium-, and narrow-band filters, optimally designed to extract the rest-frame spectral features (the 3700–4000 Å Balmer break region, Hδ, Ca H+K, the G band, and the Mg b and Ca triplets) that are key to characterizing stellar types and delivering a low-resolution photospectrum for each pixel of the observed sky. With a typical depth of AB ∼21.25 mag per band, this filter set thus allows for an unbiased and accurate characterization of the stellar population in our Galaxy, it provides an unprecedented 2D photospectral information for all resolved galaxies in the local Universe, as well as accurate photo-z estimates (at the δ z/(1 + z)∼0.005–0.03 precision level) for moderately bright (up to r ∼ 20 mag) extragalactic sources. While some narrow-band filters are designed for the study of particular emission features ([O II]/λ3727, Hα/λ6563) up to z < 0.017, they also provide well-defined windows for the analysis of other emission lines at higher redshifts. As a result, J-PLUS has the potential to contribute to a wide range of fields in Astrophysics, both in the nearby Universe (Milky Way structure, globular clusters, 2D IFU-like studies, stellar populations of nearby and moderate-redshift galaxies, clusters of galaxies) and at high redshifts (emission-line galaxies at z ≈ 0.77, 2.2, and 4.4, quasi-stellar objects, etc.). With this paper, we release the first ∼1000 deg2 of J-PLUS data, containing about 4.3 million stars and 3.0 million galaxies at r < 21 mag. With a goal of 8500 deg2 for the total J-PLUS footprint, these numbers are expected to rise to about 35 million stars and 24 million galaxies by the end of the survey.
Key words: surveys / astronomical databases: miscellaneous / techniques: photometric / stars: general / Galaxy: general / galaxies: general
© ESO 2019
1. Introduction
The success of large-scale, broadband, photometric sky surveys such as the Sloan Digital Sky Survey (SDSS, York et al. 2000) demonstrated that multi-filter surveys can provide crucial information on the spectral energy distributions (SED) for millions of astronomical objects. This is particularly evident for some science cases for which spectral resolution is not a limiting factor and for which multi-object spectroscopy therefore is not critically required. One of the major advantages of photometric surveys relies on the fact that the object selection is not biased by any prior other than the limiting magnitude in each band, hence favoring completeness and enabling the generation of more massive data sets.
In recent years, a growing number of multi-filter surveys with larger numbers of photometric bands such as COMBO-17 (Wolf et al. 2003), ALHAMBRA (Moles et al. 2008), COSMOS (Ilbert et al. 2009), MUSYC (Cardamone et al. 2010), CLASH (Postman et al. 2012), and SHARDS (Pérez-González et al. 2013) have opened new ways to shed light on many areas in Astrophysics and Cosmology. These surveys share the use of a set of broad-, intermediate- and/or narrow-band filters providing sufficient spectral information that enables addressing certain scientific cases without the need of resorting to spectroscopy. The success of such surveys has motivated the design of new challenging projects such as the Physics of the Accelerating Survey (PAU, Martí et al. 2014), the Javalambre-PAU Astrophysical Survey (J-PAS, Benitez et al. 2014), and the Javalambre-Photometric Local Universe Survey, hereafter J-PLUS1, whose presentation is the main goal of this paper.
As we explain next, the motivation for a survey like J-PLUS lies in the context of the J-PAS survey. J-PAS is a very wide field astrophysical survey to be developed at the Observatorio Astrofísico de Javalambre (OAJ; Cenarro et al. 2010, 2012, 2014). J-PAS will be conducted with the Javalambre Survey Telescope, JST/T250, a large-etendue 2.5 m telescope, and JPCam, a panoramic 4.7deg2 camera with a mosaic of 14 large-format CCDs, amounting to 1.2 Gpix. The main scientific driver of J-PAS is the measurement of radial baryonic acoustic oscillations with an unprecedented accuracy. To achieve this, J-PAS is planned to observe around 8500deg2 of the Northern Sky with a set of 54 contiguous narrow-band optical filters (145 Å width each, placed ∼100 Å apart), plus two broad-band filters at the blue and red sides of the optical range, and three SDSS-like filters. The filter set is designed to provide 0.3% relative error (0.003 × [1 + z]) photometric redshifts (photo-zs) for tens of millions of luminous red and emission-line galaxies (ELGs), plus about two million quasi-stellar objects (QSOs) with similar photo-z quality, sampling an effective volume of ∼14 Gpc3 up to z = 1.3. In addition, J-PAS is expected to detect hundreds of thousands of galaxy clusters and groups, produce one of the most powerful cosmological lensing surveys, and detect, classify, and measure redshifts for thousands of supernovae (SNe) at the 1% precision level (Xavier et al. 2014). All these observations are expected to provide complementary constraints on dark energy, which each have different systematics, and thus to provide a solid description of the nature of dark energy. Beyond these cosmological goals, the key to the J-PAS potential is its innovative approach. The use of narrow-band filters makes J-PAS equivalent to a low-resolution integral field unit (IFU) of the Northern Sky, providing the SED of every pixel of the sky and, ultimately, a 3D image of the Northern Sky with an obvious wealth of potential astrophysical applications. One must bear in mind that, unlike in standard IFU spectroscopy, in the approach adopted by J-PLUS and J-PAS, data corresponding to different bands/spectral ranges may be acquired at different times. For this reason, the term “hyperspectral imaging” has also been proposed to dub the non-simultaneous, multi narrow, medium-width, and broad band photometry conducted by J-PLUS.
The J-PLUS project is envisioned as a multi-filter survey that supports and complements J-PAS at the technical and scientific levels. With a unique set of 12 broad, intermediate, and narrow photometric bands in the optical range, J-PLUS was conceived to be implemented at the OAJ, using an 83 cm telescope with a large field of view (FoV) and a very efficient panoramic camera with low read-out noise. Telescope, camera, and filters are customized with the main goal of conducting J-PLUS, that is, to optimize the whole system so that the maximum outcome and efficiency of the survey can be achieved.
The original goal of J-PLUS of supporting the photometric calibration for J-PAS drove the definition of the J-PLUS filters. These filters have been conceived to retrieve accurate stellar SEDs and assign stellar templates to all the stars that are brighter than a certain magnitude. These templates will ultimately allow computing synthetic magnitudes for each star for the 59 J-PAS photometric bands in advance to J-PAS observations. With several dozen stars in each of the 14 large-format CCDs of JPCam, it will be possible to compute the photometric zero-points (ZPs) for each exposure of J-PAS (see, e.g., Varela et al. 2014). This calibration technique, together with alternative methods based on stellar locus in multiple J-PAS color-color diagrams, guarantees the success of the J-PAS calibration to uncertainties below 2% in each filter.
In addition, the timing of J-PLUS is an important asset. From the beginning, J-PLUS was thought to be conducted well in advance of J-PAS. First, because J-PLUS aims to observe most of the J-PAS footprint beforehand to support and complement the photometric calibration of J-PAS and its science. Second, because most of the technical developments related to the J-PLUS deployment (e.g., data reduction, pipelines, calibration procedures, scientific software, and storage hardware) constitute the natural basis for J-PAS, in many cases requiring only minor modifications to be made to the J-PAS specifications.
The details of the photometric calibration of J-PAS using J-PLUS data will be addressed in a dedicated paper (Varela et al., in prep.). In this paper, however, we focus on the definition, strategy, data, and scientific value of J-PLUS. Two main primary goals are related to local Universe science that have been prioritized during the survey definition. The first is the production of multi-filter photometric information for millions of Milky Way (hereafter MW) halo stars in the J-PAS footprint. This is a very valuable data set for multiple scientific cases in stellar astrophysics, such as the determination of atmospheric parameters, the detection of extremely metal poor stars, the study of brown dwarfs, and variable sources. The second primary goal is to optimally exploit the IFU-like science that J-PLUS can provide at very low spectral resolution. In particular, J-PLUS focuses on the detailed characterization of 2D stellar populations, star formation rates, and the role of the environment for tens of thousands of galaxies in the local Universe (z < 0.05). In the context of these two main goals, the J-PLUS filter set has been defined to be particularly sensitive to rest-frame spectral features that are key to (i) characterizing the different stellar spectral types, luminosity classes, and stellar metallicities, (ii) distinguishing ages and metallicities from the integrated light of local galaxies, and (iii) determining reliable strengths of nebular emission lines such as Hα and [O II]/λ3727.
The characteristics and strategy of the survey have been optimized to extract the maximum scientific return in many other areas of Astrophysics. J-PLUS will observe a significant fraction of the Northern Sky in 12 photometric optical bands and thus provide multi-filter information for every pixel in the survey footprint. This allows addressing a very wide range of scientific cases, essentially all those that are benefited by (i) the very large sky coverage of the survey; (ii) the use of specific filters, some with narrow-band passes located at key rest-frame spectral features; (iii) a massive volume of data for most categories of astronomical objects, and (iv) the time domain, as a result of the specific strategy to observe each field in the different filters at different times and also the revisiting of fields that were observed under poor atmospheric conditions.
In addition to describing the J-PLUS mission, the main goal of this paper is to illustrate some of the most relevant scientific capabilities of J-PLUS based on real data. With this aim, we here present the first two data releases that have recently been made public to the astronomical community. The first data release amounts to ∼50 deg2 of J-PLUS data split into two categories: ∼36 deg2 in the J-PLUS footprint, constituting the so called J-PLUS Early Data Release (EDR), and ∼14 deg2 of particularly interesting regions of the sky that were observed as part of the J-PLUS Science Verification Data. The second data release amounts to ∼1000 deg2 in the J-PLUS footprint, constituting the first official data release of the survey, referred to as Data Release 1 (DR1). This data set is representative of the whole J-PLUS survey and allows providing a flavor of the type of data and most relevant science cases that J-PLUS will address: MW science, stellar clusters, stellar populations of nearby and moderate-redshift galaxies (z < 0.015), emission-line studies, 2D IFU-like studies, high-redshift galaxies, QSOs, clusters of galaxies, and so on.
As of the time of writing, J-PLUS has collected data over more than 1400 deg2, which will become publicly accessible in subsequent data releases. In addition, a replica of the J-PLUS system for the Southern Hemisphere has been made possible and constructed within the framework of the J-PAS collaboration. The Southern Photometric Local Universe Survey (S-PLUS; Mendes de Oliveira et al., in prep.) is scanning the sky from Cerro Tololo with an identical telescope, camera, and filter set as originally defined for J-PLUS, thus strengthening the large-scale character of the two projects.
Overall, the paper is structured as follows. Section 2 provides a general description of the survey with an emphasis on the technical framework of J-PLUS: the OAJ, the JAST/T80 telescope, and its panoramic camera T80Cam, the J-PLUS filter set, the survey strategy, the data reduction pipeline, and, finally, the photometric calibration. Section 3 describes the J-PLUS data releases that are publicly presented with this paper, on the basis of which, Sect. 4 briefly illustrates some of the main science cases that will be covered by J-PLUS. Finally, the summary and conclusions are presented in Sect. 5.
Unless stated otherwise, magnitudes in this work refer to the AB system.
2. J-PLUS definition and implementation
J-PLUS is an ongoing dedicated photometric survey of ∼8500 deg2 that will be conducted from the OAJ in the next years, using a unique set of 12 broad-, medium-, and narrow-band filters. This filter set has been particularly defined to be sensitive to key stellar spectral features in the rest frame, thus being optimal for MW science and stellar population studies of galaxies in the local Universe. In addition, the survey strategy has been fine-tuned to optimize the scientific return in a wide range of applications in many other areas of Astrophysics.
In this section we describe the main technical characteristics of the survey, starting with the observatory (Sect. 2.1), telescope and camera (Sect. 2.2), and filters (Sect. 2.3). We continue with the survey strategy (Sect. 2.4), data reduction (Sect. 2.5), and calibration (Sect. 2.6).
2.1. OAJ: an observatory for large sky surveys
The OAJ2 is an astronomical facility located at the Pico del Buitre of the Sierra de Javalambre in Teruel, Spain. At an altitude of 1957 m, the site has excellent astronomical characteristics in terms of median seeing (0.71 arcsec in V band, with a mode of 0.58 arcsec), fraction of clear nights (53% are totally clear, and in 74%, at least 30% of the night clear), and darkness, with a typical sky surface brightness of V ∼ 22 mag arcsec−1 at zenit during dark nights. This is quite exceptional in continental Europe. Full details about the site testing of the OAJ can be found in Moles et al. (2010).
The OAJ was defined, designed, and constructed to carry out large sky surveys with dedicated telescopes of unusually large FoVs. The two main telescopes at the OAJ are the Javalambre Survey Telescope (JST/T250), a 2.55 m telescope with a FoV diameter of 3 deg, and the Javalambre Auxiliary Survey Telescope (JAST/T80), an 83 cm telescope with a FoV diameter of 2 deg. The JAST/T80 telescope is dedicated to the development of J-PLUS, whereas J-PAS will be carried out at the JST/T250.
The definition, design, construction, exploitation, and management of the observatory and the data produced at the OAJ are the responsibility of the Centro de Estudios de Física del Cosmos de Aragón (CEFCA3). The OAJ project started in March 2010, mostly funded by the Fondo de Inversiones de Teruel. This program is supported by the local government of Aragón and the government of Spain, and is essentially completed since 2015. In October 2014, the OAJ was awarded with the recognition of Spanish ICTS (Infraestructura Científico Técnica Singular) by the Spanish Ministry of Economy and Competitiveness.
2.2. JAST/T80 and T80Cam
The large FoV provided by JAST/T80 is achieved thanks to a fast optical configuration (F#4.5), which drives a plate scale at the Cassegrain focal plane of 55.56 arcsec mm−1. The design of JAST/T80 was led and carried out by CEFCA in close collaboration with its main subcontractors, AMOS (Belgium) and ASTELCO (Germany). JAST/T80 has a German equatorial mount, as illustrated in Fig. 1, integrated inside the 6.2 m dome building at the OAJ. The optical tube assembly also has a very compact layout, with just 826 mm between M1 and M2. With an overall weight of around 2500 kg, JAST/T80 supports instruments at its Cassegrain focus of up to 80 kg.
 |
Fig. 1. View of the JAST/T80 telescope inside its dome at the Observatorio Astrofísico de Javalambre. |
The optical design of the JAST/T80 is based on a modified Ritchey-Chrétien configuration, including a field corrector of three spherical lenses of fused silica. The lens diameters are in the range of 152–170 mm. The whole system is optimized to work in the optical range, from 330 to 1100 nm, yielding a polychromatic image quality better than 9.0 μm (EE50; diameter) inside the 13 cm diameter focal plane (3.1 deg2), after considering all error sources in the error budget. The design is also optimized to account for the J-PLUS filters and the T80Cam entrance window in the optical path. Table 1 illustrates a summary of the main technical characteristics of JAST/T80.
Main technical characteristics of the JAST/T80 telescope.
Because of the large FoV and fast optics, the JAST/T80 M2 is controlled actively with an hexapod that allows performing small M2 corrections that maintain the system focus and keep the entire FoV free of aberrations. This is done through a wave-front curvature sensing technique developed at CEFCA (see Chueca et al. 2012) that computes the optimal hexapod position for a given temperature and telescope pointing. This technique makes use of the scientific CCD of T80Cam, demanding only a few minutes every few hours of observation. In between such computations, M2 corrections are applied automatically in closed loop during the survey execution according to an empirically calibrated M2 control law. This control law is built on the basis of hundreds of telescope positions and temperatures. To improve the efficiency of the system, the JAST/T80 dome is air-conditioned during the daytime at the expected temperature of the coming night to minimize temperature gradients in the telescope and camera.
Since the overall effective etendues of the OAJ systems are ultimately determined by the CCD filling factor at the telescope focal plane, the OAJ instrumentation is designed to take full advantage of the large FoV of the telescopes and the seeing conditions of the site. JAST/T80 is therefore equipped with only one instrument, the T80Cam. This is a panoramic camera that will remain mounted at the telescope during the entire execution of J-PLUS, which will minimize overheads in the operation that are due to instrument exchanges.
The T80Cam includes a grade-1, back-side illuminated, low-noise 9.2 kpix × 9.2 kpix CCD of 10 μm pix−1 that was specifically developed by Teledyne e2v (UK) for the J-PLUS and J-PAS projects. The T80Cam provides a usable FoV of 2 deg2 with a plate scale of 0.55 arcsec pix−1. This full-wafer CCD is read simultaneously from 16 ports, achieving read-out times of 12 s with a typical read-out noise of 3.4 e− (rms). It has an image area of 92.16 mm × 92.32 mm and a broad-band anti-reflective coating for optimized performance in the range 380–850 nm.
The T80Cam is a direct-imaging camera designed to work in fast convergent beam at the Cassegrain focus of the JAST/T80, without additional optical elements other than the J-PLUS filters and the cryostat entrance window, which is optically powered. The camera entrance window is the fourth element of the JAST/T80 field corrector, which together with the filters has been accounted for when the optical design of JAST/T80 was defined. The window is a 10 mm thick, weakly powered field-flattener with an 8 mm distance between its inner surface and the focal plane.
The T80Cam (Fig. 2; left) consists of two main subsystems: the filter and shutter unit (FSU), and the cryogenic camera. In addition to the mechanical flange to attach the instrument to the telescope, the FSU includes a two-curtain shutter provided by Bonn-Shutter UG (Germany) that allows taking integration times as short as 0.1 s with an illumination uniformity better that 1% over the whole FoV and the filter unit. The latter consists of two filter wheels with seven positions each (Fig. 2; center), allowing it to host all the 12 J-PLUS filters (6 filters plus an empty space in each filter wheel). This avoids the need to exchange filters during observations or from night to night, thus minimizing risks and maintenance downtimes. The camera system is a 1110S camera manufactured by Spectral Instruments (USA). Figure 2 (right) shows a view of T80Cam mounted on the Cassegrain focus of the JAST/T80. The cryogenic camera system consists of the cryostat, the powered entrance window, the science CCD, its control electronics, and the vacuum and cooling systems. The sensor is cryo-cooled to an operating temperature of −100 ° C with a cryo-tiger refrigeration system, a closed-cycle Joule-Thomson effect cryogenic refrigerator device. The chamber is evacuated to 10−4 Torr using a turbo dry vacuum pump.
 |
Fig. 2. Left panel: T80Cam 3D model design completely assembled. The top part of the instrument represents the filter and shutter unit, containing the shutter and the two filter wheels. The gray cylindrical object below the filter and shutter unit represents the cryogenic camera. Center panel: same view of the T80Cam model after cover removal, showing the two filter wheels and the shutter. Right panel: T80Cam integrated at the Cassegrain focus of the JAST/T80 telescope. |
A summary of the technical characteristics of T80Cam is presented in Table 2. In addition, full technical and managerial details on T80Cam can be found in Marín-Franch et al. (2012a, 2015).
Main technical performances of the T80Cam panoramic camera at the JAST/T80 telescope.
2.3. J-PLUS filter set
The main goals of J-PLUS depend on the accurate determination of SEDs of MW stars and nearby galaxies. It is therefore clear that the J-PLUS filter set must be sensitive to both the optical continuum and the most prominent spectral features. In this context, it has been frequently demonstrated that it is possible to retrieve reliable stellar SEDs with a set of around 10–15 intermediate- to broad-band optical filters centered at key spectral regions (e.g., Bailer-Jones 2004; Jordi et al. 2006; Carrasco 2006).
Following this strategy, the J-PLUS filter set consists of the 12 filters defined in Table 3. Four of these are SDSS filters (g, r, i, and z; Fukugita et al. 1996) that provide the low-frequency continuum, and six are intermediate-band filters of 200–400 Å width, centered on key absorption features. These are the u filter, in common with J-PAS and located at the blue side of the 3700–4000 Å Balmer-break region, and the filters J0395 for Ca H+K, J0410 for Hδ, J0430 for the G band, J0515 for the Mg b triplet, and J0861 for the Ca triplet. The J-PLUS filter set is completed with two narrow-band filters, J0378 and J0660, also in common with the J-PAS filter set. These two filters are sensitive to the [O II]/λ3727 and Hα/λ6563 emission lines, respectively. The three filters in common with J-PAS are envisioned as an added value for the overall calibration procedure, as they will allow second-order corrections of the ZPs to anchor the J-PAS calibration.
J-PLUS filter system.
The J-PLUS filters have been manufactured by Schott (Switzerland). A detailed technical description of the filter requirements and design can be found in Marín-Franch et al. (2012b). Figure 3 shows the overall efficiency of the transmission curves of the filters, whose tabulated data can be found at the J-PLUS website4.
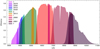 |
Fig. 3. Overall transmission curves measured for the set of 12 J-PLUS filters, including the effect of the entire system (sky, mirrors, lenses, and CCD). |
The filter arrangement is tuned to provide scientifically valuable data for many fields of Astrophysics. Since the intermediate-band filters are sensitive to the strengths of key features of old stellar populations, J-PLUS is very well suited for analyzing the stellar populations of nearby galaxies up to a limiting redshift of z ∼ 0.015 (set by the typical filter width). In addition, the two narrow-band filters are ideal for mapping the star formation rates in nearby galaxies in the range 0 < z < 0.05. These considerations are fully addressed in Sect. 4.
2.4. J-PLUS survey strategy
As explained in Sect. 1, one of the main goals of J-PLUS is to provide reliable stellar SEDs for millions of stars in the MW halo. To obtain reasonable characterizations of stellar SEDs, simulations have revealed that a signal-to-noise ratio (S/N) ≥ 50 in each J-PLUS filter is sufficient. The photometric depths defined for J-PLUS guarantees this S/N requirement for all stars brighter than ∼18 mag. The panoramic FoV of T80Cam includes more than one thousand stars per pointing and filter that reach ∼18 mag in the Galactic halo. In terms of limiting magnitude, this number is approximately equivalent to reaching ∼20.5 mag for S/N ≥ 5 (∼21.0 mag for S/N ≥ 3) for point-like sources in a circular aperture of 3 arcsec. This depth suffices to guarantee unprecedented IFU-like science for thousands of nearby galaxies for 2D stellar populations gradients and SFR studies.
J-PLUS is a direct-imaging survey. For each pointing of the survey, all filters are observed consecutively until completion following a predefined sequence. This constitutes a J-PLUS observing block (OB), which is the shortest observing unit during the survey. If an OB is interrupted by bad weather or any technical issue, it is marked as not valid and repeated as soon as possible.
Every J-PLUS OB is made of 36 exposures, 3 in each of the 12 filters. The 3 exposures in a given filter are consecutive, with a small dithering of 10 arcsec between them that allows the removal of bad pixels or columns. The J-PLUS observing sequence is the following: iSDSS, uJAVA, J0430, J0861, J0515, J0410, rSDSS, J0378, J0660, gSDSS, J0395, and zSDSS. This has been defined to reach a compromise between maximizing the time difference between filters with similar wavelength while at the same time minimizing long filter wheel rotations. The first requirement is purely scientific and allows the detection of fast-moving asteroids. The second requirement maximizes the observing efficiency. Because the filter wheels of the T80Cam can be moved during CCD readout without an effect on the noise, the filter change is triggered while reading out the last image. This minimizes overheads between exposures. The readout time of the T80Cam CCD (12 s) is the dominant overhead.
The exposure times of J-PLUS are set to reach the required S/N at ∼18 mag. To guarantee homogeneity in the final depths and quality of the photometry in each filter during the execution of the survey, the exposure times for each filter and for each pointing are computed automatically in advance according to the phase and distance of the Moon. For this purpose, the surface brightness of the sky in Javalambre in all the J-PLUS filters has been determined empirically from thousands of images for different Moon conditions. For illustration, Fig. 4 shows the sky brightness in J0430, J0660, and J0861 bands as a function of the distance to the Moon and the phase of the Moon. The estimated sky brightness at every J-PLUS pointing is then given as input to the exposure time calculator that determines the particular exposure time for that pointing and time. Completing the J-PLUS observations in the 12 filters takes typically about 35 min per pointing in dark time and about 1.5 h in bright time. Figure 5 represents the typical photometric uncertainties as a function of magnitude for each J-PLUS band obtained for EDR and DR1 under this observing strategy. Both point-like and extended sources (galaxies) are included in this plot.
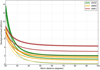 |
Fig. 4. Mean sky background at the OAJ in bands J0430 (green), J0660 (yellow), and J0861 (red) as a function of the distance to the Moon and the phase of the Moon: 100% (Full Moon; thickest line), 90% (medium thickness), and 0% (New Moon; thinnest line). This information, computed empirically in advance for all J-PLUS bands, is employed to derive the exposure times in real time that are required to reach the planned J-PLUS limiting magnitudes. |
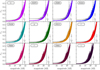 |
Fig. 5. Typical photometric uncertainties in the 12 J-PLUS bands as a function of magnitude for a random set of 10 J-PLUS tiles in common with the EDR (gray dots) and the DR1 (colored dots). The black dashed line indicates the DR1 limiting magnitude in each band. At fixed magnitude, the width of the error distribution accounts for different observing conditions in terms of final PSF, sky transparency, and so on. |
Figure 6 illustrates the footprint of J-PLUS, which is defined to match the sky coverage of J-PAS as best possible. This accounts for two main contiguous areas that are visible from Javalambre, that essentially avoid the galactic plane and highly reddened sky areas. The largest area lies in the Northern Galactic Hemisphere, with ∼6500 deg2, while the smallest lies in the Southern Galactic Hemisphere, with ∼2000 deg2. The complete J-PLUS footprint is scheduled to be covered in ∼4250 pointings.
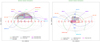 |
Fig. 6. J-PLUS footprint. It is split into two main contiguous areas, indicated in gray, in the Northern and Southern Galactic hemispheres (left and right panels, respectively). The Galactic plane, shown as the green dashed line, is avoided as part of the J-PLUS strategy. The three priority areas of the J-PLUS footprint, NGC-PA1, NGC-PA2, and SGC-PA, are indicated in different colors as given in the labels, together with the footprints or fields from other surveys that entirely or partially match the J-PLUS sky coverage: e.g., Alhambra (ALH; http://www.alhambrasurvey.com; Moles et al. 2008), the Canada-France-Hawaii Telescope Legacy Survey (CFHTLS; http://www.cfht.hawaii.edu/Science/CFHTLS/; e.g., Cuillandre et al. 2012), the Galaxy and Mass Assembly (GAMA; http://www.gama-survey.org), the DEEP2 redshift survey (DEEP2; http://deep.ps.uci.edu/), the Deep Lens Survey (DLS; http://matilda.physics.ucdavis.edu/working/website/techinfo.html), the Extended Groth Strip (EGS; http://aegis.ucolick.org/tech_overview.html), the Great Observatories Origins Deep Survey (GOODS; http://www.stsci.edu/science/goods/), the Hyper Suprime-Cam Subaru Strategic Program (HSC; http://hsc.mtk.nao.ac.jp/ssp/), and the SDSS Legacy Survey (SDSS; https://classic.sdss.org/legacy/index.html). The J-PLUS footprint is fully included in the footprint of the Pan-STARRS 3π survey (Tonry et al. 2012), which observed the whole sky for Dec > −30 deg. |
For the beginning of the survey, three priority areas that are accessible at different times of the year (see Fig. 6) have been defined, amounting overall to about 1750 deg2:
-
Priority Area 1 – North Galactic Cap (NGC–PA1): 580 deg2 in 120 deg < RA < 180 deg and 30 deg < Dec < 42 deg.
-
Priority Area 2 – North Galactic Cap (NGC–PA2): 610 deg2 in 180 deg < RA < 245 deg and 42.5 deg < Dec < 57 deg.
-
Priority Area 3 – South Galactic Cap (SGC–PA): 550 deg2 in 0 deg < RA < 42.2 deg and −5 deg < Dec < 8 deg.
As illustrated in Fig. 6, the priority areas were defined to optimize the match with other surveys. The EDR and DR1 presented in this paper both mostly belong to the priority areas indicated above.
In general, each field is observed when its observability is optimal, typically within the requirements of airmass lower than 1.5 and seeing better than 1.5 arcsec. The ultimate observing sequence is managed by the J-PLUS Scheduler and Sequencer according to predefined observability, efficiency, and image quality criteria.
2.5. J-PLUS pipelines and data management
The J-PLUS data are handled and processed using the data management software developed by the Data Processing and Archiving Unit (Unidad de Procesado y Archivo de Datos; hereafter UPAD) of CEFCA. The technical details of J-PLUS data handling and data processing will be explained in a forthcoming article. Here we describe some of the steps involved in the treatment of the J-PLUS data presented in this paper.
During the execution of J-PAS and J-PLUS, the OAJ telescopes will produce thousands of images per night, amounting to several terabytes of data during a single typical observing night. To digest such a data rate, the pipelines have been designed to work automatically, that is, without human supervision. The OAJ hosts a set of dedicated servers that manage the transmission of the images from the camera servers to the OAJ storage and processing unit, where they are processed online processing. This first processing uses a lightweight version of the pipeline for real-time visual inspection and first-order diagnosis. Immediately after image acquisition, raw data are also automatically transferred to the UPAD at CEFCA for archival and a complete processing. This is done through a dedicated radio-link that connects the OAJ with CEFCA headquarters.
When the raw data reach the main UPAD archive, they are automatically uploaded to a management database that stores all the metadata of the collected images. This database also stores all the processes done on the data, and is used to control whether the inputs for each stage are ready and to automatically prepare the jobs to be executed. On a daily basis, the Data Management Software automatically processes the data collected during the last night in order to check their quality. It next updates the survey databases and feeds the Scheduler to compute the telescope targets of the following nights. Eventually, in order to optimize the scientific quality of the data, the pipelines reprocess all the images with the optimal master calibration frames (CFs) when they are available.
The image processing pipelines have three main stages. The first is related to the generation of master CFs, which are used to correct for the instrumental imprint on the individual images at a later stage. These CFs consist of a master bias, the master dome or sky flats, a fringing pattern, and the illumination correction maps. To compute any of these CFs, the pipeline requires as input the time interval and the instrumental configuration (telescope, camera and detector parameters, read-out configuration, etc.). With this information in hand, the pipeline queries the database for the required images and processes the master CFs. When the CFs are generated, they are made available through a web service, together with relevant information that allows assessing their quality. Finally, the master CFs require human validation to be used in further processing of science images.
The second stage is related to the processing of the different individual images. The pipeline corrects the instrumental signature using the validated CFs. The corrections (bias, flat fielding, fringing, etc.) that need to be applied to each image type are stored in the configuration files. Since the proper CFs for each image depend upon the required corrections, the observing epoch, and the instrumental configuration, the pipeline must query the management database in order to assign the correct CFs. The pipeline also computes and assigns cold and hot pixel masks to every image while generating masks for other contaminants (e.g., cosmic rays and satellite traces). If required, the pipeline can also interpolate the masked areas. For the detection and masking of cosmic ray hits, the pipeline uses an implementation of L.A.Cosmic (van Dokkum 2001). During the processing of the individual images, the pipeline calibrates the astrometry and the photometry (Bertin 2006), and generates a point spread function (PSF) map and a master PSF for each individual frame. When the individual images are processed, a first catalog is created over the individual images using SExtractor (Bertin & Arnouts 1996).
At the final stage, the pipeline combines the processed images from the same sky area to provide a deeper photometrically calibrated image for each filter. The pipeline makes use of the packages Scamp (Bertin 2006) and Swarp (Bertin et al. 2002) to perform the astrometric calibration and image coadding. The combined images for a given tile in the whole set of filters constitute a datacube. SExtractor source catalogs are extracted from the final tiles and datacubes and are stored in an internal database system. Two types of catalogs are produced. In the first, the source detection and segmentation are made independently for the combined images in each filter. In the second, the detection and aperture definition is made in the r band, which is used as a reference image. Prior to computing the final catalogs, the PSF of each filter image is homogenized to match the PSF of the r filter, defined as reference filter in J-PLUS. This technique has been used before to produce the photometric catalogs for the ALHAMBRA survey (Aparicio Villegas et al. 2010; Molino et al. 2014).
The J-PAS and J-PLUS data are archived and processed in a dedicated data center. The data center infrastructure and processing software are designed to handle the enormous data flow produced by the OAJ panoramic cameras, and especially to minimize the time required to transfer the images to the processing nodes and to read/write data from/to disks. The main storage uses two different technologies. In order to feed data to the processing nodes, the data that are accessed frequently by the pipelines are kept in a disk storage cluster. The storage cluster runs a distributed file system providing access to the data through several servers, and together with the core network, they provide an aggregated bandwidth above 50 Gbps to the processing servers. The data are permanently archived and backed up in a robotic tape library. To process the J-PLUS images, the UPAD hosts dedicated nodes that have a large RAM to operate with the images without writing intermediate products to disk. The UPAD also counts with a large internal disk scratch used to store copies of the frequently required data, such as the CFs. More information on the facilities employed to process the J-PLUS data is provided in Cristóbal-Hornillos et al. (2014).
2.6. J-PLUS photometric calibration
The photometric calibration of J-PLUS faces two main challenges: the variety of observational conditions in which J-PLUS images are taken, and the use of a unique set of purposely defined filters. However, the difficulty of these tasks is to some extent alleviated by the large amount of external data made available by projects such as SDSS (York et al. 2000), PanSTARRS (Kaiser et al. 2002), and Gaia (Gaia Collaboration 2016).
In this context, with the ultimate goal of being able to calibrate J-PLUS under the widest variety of observing conditions, we chose to apply a battery of calibration procedures rather than relying on a single calibration technique. While the details of the calibration procedures will be presented in an upcoming work (Varela et al., in prep.), here we briefly outline the calibration procedures that are currently applied on current J-PLUS data:
-
SDSS spectroscopy. This is done by convolving the SDSS spectra with the spectral response for each filter of J-PLUS, yielding synthetic magnitudes whose comparison to the observed one provides estimates for the ZPs. Although the sky coverage of the SDSS spectra is smaller and sparser than J-PLUS photometry, it has the advantage that it can be used to calibrate those J-PLUS bandpasses that have no photometric counterpart. In particular, given the spectral coverage of the SDSS spectra, these are used to calibrate the J-PLUS bandpasses from J0395 to J0861, including g, r and i. With the installation of the BOSS spectrograph, the wavelength range of the spectra was extended to the blue, thus allowing the calibration of the J0378 band in areas of the sky for which BOSS spectra are available. However, u and z bands still fall out of the covered range by SDSS spectroscopy. Given the large FoV of T80Cam at JAST/T80 (2 deg2), dozens of high-quality SDSS stellar spectra in a single J-PLUS pointing are frequent.
-
SDSS photometry. The significant (∼80%) overlap between J-PLUS and SDSS footprints allows calibrating the J-PLUS broad-band observations against the corresponding ones in SDSS, after applying the requisite color-term corrections. This calibration technique is used to calibrate the u and z bands, which are not covered by SDSS spectra. Because of differences in the effective transmission curves between SDSS and J-PLUS photometric systems, color-term corrections need to be applied to the SDSS photometry to obtain the corresponding J-PLUS photometry. These corrections are of particular importance in the case of the u band, where filters are known to be significantly different.
-
Spectrophotometric standard stars. The observation of spectrophotometric standard stars (hereafter SSSs) is the only procedure that allows calibrating the full J-PLUS bandpass system as long as the SSS spectra cover the full spectral range of the J-PLUS filter system. The main sources for the SSSs are the spectral libraries CALSPEC5, the Next Generation Spectral Library6, and STELIB (Le Borgne et al. 2003). Following the classical calibration procedure based on Bouguer fitting lines, each SSS is observed at different airmasses throughout the night to derive the extinction coefficient and the photometric ZP of the system. As is well known, for this procedure to be accurate, the atmospheric conditions must be very stable. The SSS technique is critical in the calibration of the J0378 filter because neither SDSS photometry nor SDSS spectroscopy cover this bandpass.
The current procedures are thought to be applied to any single exposure or any combination of exposures in a given filter, independently of the observations in any other band. However, by combining the information from different bands, it should also be possible to apply methods that enable anchoring the calibration throughout the spectral range. One particularly promising approach is the use of the stellar locus (Covey et al. 2007; High et al. 2009; Kelly et al. 2014), which optimally suits in systems with large FoVs such as those at the OAJ. This procedure profits from the way stars with different stellar parameters populate color-color diagrams, defining a well-limited region (stellar locus) whose shape depends on the specific colors used. A specific stellar locus approach for the calibration of J-PLUS has been developed, obtaining consistent ZP calibrations over the full J-PLUS spectral range with σZP ≲ 0.02. The details of this procedure and its application to J-PLUS data will be presented in a future work.
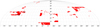 |
Fig. 7. Footprint of the J-PLUS DR1. Red squares represent each of the 511 pointings of 2 deg2 provided by the T80Cam. Black squares indicate the subset of 18 pointings that constitute the EDR. Overall, the DR1 amounts effectively to ∼900 deg2 after masking low-exposure regions, the surroundings of bright stars, observational reflections or artifacts, and overlapping areas. |
In Table 4 we summarize the median ZPs for each J-PLUS filter. We also present the typical uncertainty in the calibration of the EDR, ranging from σZP ∼ 0.06 at the bluer to ∼0.04 at the redder bands. These uncertainties were estimated from the comparison of duplicated sources in the J-PLUS overlapping areas, and should be accounted for in the photometry error budget of all sources. In addition, we also include the ZP uncertainties obtained for the DR1 through the use of stellar locus techniques. A significant improvement in such ZP uncertainties is reported: in all cases ≤0.026, and as small as 0.010, demonstrating the power of the stellar locus to calibrate large photometric datasets.
Planned limiting magnitudes of J-PLUS for point-like sources in a circular aperture of 3 arcsec and S/N > 5, presented together with the averaged limiting magnitudes obtained for the EDR and DR1.
3. J-PLUS data releases
The two public releases of J-PLUS data that were made since the beginning of the survey constitute the basis of the data presented in this paper. This section describes these data releases and their main characteristics.
3.1. J-PLUS EDR and DR1
The J-PLUS EDR is an initial subset of J-PLUS tiles representative of the J-PLUS project in terms of photometric depths, PSFs, and image quality, with a preliminary photometric calibration. It comprises 18 J-PLUS pointings that amount to 31.7 deg2 after masking. The tiles belonging to the J-PLUS EDR were selected as those with a limiting magnitude as close as possible to the final J-PLUS goal in all the filters simultaneously, and without evident issues in the photometry or in the source catalogs. They are distributed in a relatively small region of the sky, in the range 105 deg < RA < 145 deg and 30 deg < Dec < 42 deg.
The EDR constituted the first J-PLUS data set on the basis of which the first science of the project was developed. Its main catalog includes ∼400 thousand entries, with ∼150 thousand stars and ∼101 thousand galaxies at r < 21. It has been publicly available at the J-PLUS web portal7 since October 2017.
The J-PLUS DR1 surpasses the EDR in sky coverage and photometric quality. DR1 essentially comprises most J-PLUS tiles observed from the start of the survey up to the beginning of 2018, that is, 511 tiles amounting to 1022 deg2 (∼900 deg2 after masking), with more than ∼13 million entries in the catalog and ∼8.4 million objects at r < 21. The DR1 has been available at the J-PLUS web portal8 since July 2018.
The FWHM and ellipticity distributions of the J-PLUS DR1 and EDR in r band are shown in Fig. 8. The mean values are reasonably consistent among the two data releases, demonstrating the reliability and stability of the system conducting the survey. It is worth noting that unlike EDR, DR1 includes all J-PLUS tiles regardless of their final image qualities. This explains the tails >1.5 arcsec and <0.98 in the FWHM and ellipticity distributions, respectively. They do not affect the average quality of the DR1 data strongly, however.
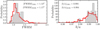 |
Fig. 8. FWHM and ellipticity (b/a ratio) statistics of the J-PLUS DR1 (red hatched histograms) and EDR (gray histograms) as measured in r band on objects classified as stars. Histograms are normalized and thus represent probability. |
The DR1 and EDR limiting magnitude (5σ in 3 arcsec aperture) distributions in the 12 J-PLUS bands are presented in Table 4 and in Fig. 9, where the targeted J-PLUS limits are indicated by vertical dotted lines. The limiting magnitudes in the two data releases on average fulfill the targeted depths. The DR1 includes all tiles of the survey that have been acquired so far and also incorporate a few that were observed deeper in some bands at the beginning of the survey, when the system performance was tested. They appear as a secondary, fainter peak in the depth distribution of DR1 (see, e.g., the u, J0378, g, r, J0660, J0861, and z bands). The slightly shallower depth in the i band arises from a former error in the ZP in that band that affected the exposure time calculation during the beginning of the survey. This is thus more apparent for the EDR. For the DR1, the typical scatter in the survey depths is ∼0.2–0.3, depending on the band. This scatter reflects the intrinsic variations in observing conditions from night to night, mainly in transparency and PSF. These conditions determine to a great extent the final S/N of the tiles in each band.
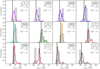 |
Fig. 9. Normalized distribution of the limiting magnitudes (5σ, 3 arcsec aperture) of the J-PLUS DR1 (511 tiles, colored hatched histograms) and the EDR (18 tiles, gray histograms). The black dashed vertical lines mark the targeted J-PLUS limiting magnitudes as reported in Table 4. The legend in the panels provides the median of the limiting magnitudes in the two data releases, as well as the rms of the distribution for the DR1. |
The completeness for stars (point-like sources) and galaxies (extended sources) in DR1 was computed by injecting simulated sources in the images and computing their recovery rate. The simulated point-like sources were position-dependent PSF models, and the simulated extended sources were observational galaxy models provided by GALSIM (Rowe et al. 2015) convolved with the corresponding position-dependent PSF. The median 50% completeness in J-PLUS DR1 is reached at r = 21.8 for stars and r = 21.5 for galaxies. For reference, the median 95% completeness is reached at r = 21.3 for stars and r = 20.8 for galaxies.
In addition to several calibrated magnitudes for each source, the DR1 also comprises a set of value-added properties: a Bayesian star/galaxy classification, with a prior based on Gaia data for the sources with a parallax measured with S/N > 3 classified as stars (for further details, see López-Sanjuan et al. 2019), effective temperature estimates for MW stars (Sect. 4.1.1; see also Whitten et al. 2019), and photometric redshift for galaxies (Sect. 4.2.1).
J-PLUS is an ongoing project that continues to take data on a regular basis. At the time of writing, J-PLUS amounts to more than ∼1400 deg2. The next data releases are scheduled to cover approximately twice the sky area of the previous ones. That is, after DR1, forthcoming data releases will roughly provide ∼2000 deg2, ∼4000 deg2, and ∼8000 deg2.
3.2. J-PLUS science verification data
In addition to the J-PLUS EDR and DR1 presented in the previous section, several tiles belonging to the J-PLUS science verification data (hereafter SVD) are also released with the present paper. These data were acquired before the beginning of J-PLUS, targeting particularly well-known objects to test and challenge the science capabilities of J-PLUS. A particular case of J-PLUS SVD is given in Fig. 10, which in turn illustrates the kind of photometric data that J-PLUS consists of.
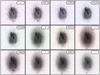 |
Fig. 10. NGC4470 in the 12 J-PLUS bands. This nearby galaxy is ideal to illustrate how a typical HII galaxy is seen by J-PLUS, with many young star-forming knots highlighted on the bluest filters (u and J0378; covering [O II] emission line) and J0660 (covering Hα and [N II] emission lines). As expected, these knots are essentially absent in the reddest bands, which instead trace the underlying old stellar population of the galaxy. |
The J-PLUS SVD pointings released with this paper9 are listed below.
-
One pointing centered at the MW globular cluster M15 (Bonatto et al. 2019).
-
Three pointings that continuously cover the galaxy clusters A2589 (z = 0.0414) and A2593 (z = 0.0440). The analysis of these data is presented in Molino et al. (2019).
-
Three pointings for the M101, M49, and the Arp313 triplet of galaxies. The nearby galaxies in these pointings, including NGC4470 (z = 0.0079; Fig. 10), are studied in Logroño-García et al. (2019) and San Roman et al. (2019).
-
One pointing centered at the Coma cluster of galaxies, on the basis of which the intracluster light is analyzed (Jiménez-Teja et al. 2019).
-
Six pointings targeting several Milky Way planetary nebulae.
We stress that the J-PLUS SVD are not strictly considered J-PLUS data because (i) the photometric depths and observing conditions may be slightly different to those set for J-PLUS; (ii) the observed fields can be either outside the J-PLUS footprint or have different coordinates than the predefined J-PLUS tiles; (iii) no versioning of the SVD is performed, that is, the data of the different projects could have been processed with different versions of the pipeline; (iv) the source catalogs are not necessarily the official catalogs created by the UPAD inside the J-PLUS collaboration, but could have been produced by different J-PLUS members; and (v) the database back-end is neither available nor designed for these data. Still, the J-PLUS SVD provides a very interesting data set to help illustrate some science cases that can be developed within this survey.
4. J-PLUS science cases
The J-PLUS coverage of the optical SED with 12 photometric bands permits a great variety of studies, including MW stars (Sect. 4.1), both nearby and much more distant galaxies at specific redshift windows (Sects. 4.2 and 4.3), and variable objects (Sect. 4.4). In the next subsections we present representative examples of some of these topics, demonstrating the capabilities and the potential of J-PLUS. For illustration throughout this section, the color composite of the J-PLUS tile 4951 is presented in Fig. 11.
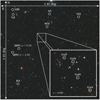 |
Fig. 11. Color composite of the J-PLUS tile 4951. Several astrophysical objects analyzed in the present paper are labeled in the figure: four MW stars of different spectral types (A0, G2, K3, and M2); one white dwarf, a minor body of the solar system, four galaxies belonging to a z = 0.068 nearby cluster (Gal1, Gal2, Gal3, and Gal4), and two high-z quasars (QSOs). |
4.1. Exploring the MW halo
In the next years, the Gaia mission will provide the most detailed view ever made of the 3D structure of the MW, improving our knowledge on its composition, formation, and evolution. Because of its survey strategy and performance, J-PLUS can help to complement the Gaia science on the MW halo. For instance, J-PLUS expands the Gaia wavelength coverage to the near-IR and the UV. This extension in the UV range is of particular interest since the Gaia spectrophotometric system is not very efficient below 400 nm. In this sense, the bluest J-PLUS filters can help to distinguish the determinations of extinction (Av) and effective temperature (Teff) by Gaia at fainter magnitudes and in the low-metallicity regime. In addition, since the J-PLUS astrometry is anchored to that of Gaia, and provided the time baseline of more than 20 years between on the one hand and the Tycho-2 and SDSS catalogs on the other hand, J-PLUS will be able to provide proper motion determinations down to a fainter limit of g ∼ 22 mag by combining the new J-PLUS epochs with previous work, including more recent determinations such as those from PanSTARRS (see, e.g., Tian et al. 2017).
In general terms, the halo of the MW provides a unique laboratory to explore the nature of galaxy assembly in exquisite detail, the relation between the globular clusters and field star populations, the formation and evolution of the first generations of stars, and the nucleosynthesis in the early Universe, to name a few topics. Below we summarize a few examples that show the potential of J-PLUS on these fronts.
4.1.1. Stellar parameters of MW stars
With the advent of narrow-band photometric surveys such as J-PLUS, it is possible to provide a method for obtaining the photometric stellar parameter estimates required by the next generation of stellar population studies. The narrow- and intermediate-band filters implemented by J-PLUS are centered on key stellar absorption features, which are sensitive to stellar parameters and chemical abundances, including effective temperature (Teff), surface gravity (logg), metallicity ([Fe/H]), and the carbon ([C/Fe]) and magnesium abundances ([Mg/Fe]). Examples include the Ca II H & K lines, the CH G-band molecular feature close to Hδ, and the Mg triplet, associated with the J0395, J0430, and J0515 filters, respectively. An illustration of the SEDs of different stellar spectral types as seen by J-PLUS is presented in Fig. 12.
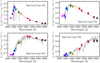 |
Fig. 12. J-PLUS photospectra of the four stars marked in Fig. 11. The gray lines show the SDSS spectra of these stars. |
While the J-PLUS filters are optimally placed along the SED to enable detection of key absorption features, mapping their behavior to overall estimates of temperature, metallicity, and the elemental abundances of C and Mg presents a highly degenerate problem. For example, at higher temperatures, (Teff ≳ 6000 K), the CH molecule dissociates, while the Hδ line broadens to the extent of disrupting the carbon feature. The Ca II K line provides an ideal indicator for stellar metallicity, but also exhibits a temperature dependence that prevents the direct use of line widths for estimating the metallicity.
One particular approach to solve this degeneracy problem relies on the use of artificial neural networks (ANN). When this method is applied to the J-PLUS DR1, it can produce estimates of Teff with a typical rms of 91 K in the range 4500 K < Teff < 8500 K, while the sensitivity to metallicity is at the level of σFe/H] = 0.31 dex. Contraints on the surface gravity can also be set by examining the J0378–J0410 color. We refer to Whitten et al. (2019) for further details.
Another alternative approach for the estimation of Teff, logg, and [Fe/H] consists of a direct interpolation in stellar model libraries, as described in Allende Prieto (2016) and Allende Prieto et al. (2018), for instance. Preliminary tests based upon the FERRE code (Allende Prieto et al. 2006, and subsequent updates) yield typical uncertainties in the recovered parameters of 135 K in Teff, 0.6 dex in logg, and 0.4 dex in [Fe/H] that are similar to those provided by the ANN approach in Whitten et al. (2019).
After testing and proving the capabilities of determining stellar parameters with J-PLUS, a number of topics can be explored:
-
Search fo metal-poor stars. With fewer than 50 ultra metal-poor stars (UMP; [Fe/H] < −4.0) known to date (Placco et al. 2015; Sestito et al. 2019), these stars are crucial for understanding the first mass function and constraining Galactic chemical-evolution models (Salvadori et al. 2010). It is anticipated that with J-PLUS data, estimates of metallicity down to [Fe/H]∼ −3.5 will be achieved, which would represent a major improvement from previous broad-band photometric methods, where SDSS photometry reached saturation at [Fe/H] < −2 (e.g., Ivezić et al. 2008), or [Fe/H] < −2.7 (An et al. 2015).
-
Ultracool dwarfs. Defined as dwarf stars with spectral types later than M6, they include both very low-mass stars and brown dwarfs. We consider three different approaches to identify ultracool dwarfs in J-PLUS data, which are based upon (i) a photometric search in J-PLUS data in combination with existing virtual observatory tools and catalogs (see Fig. 13 for the SED of a confirmed candidate found in this way); (ii) a kinematic search that profits from the high relative motion of these faint (and thus preferentially nearby) objects; and (iii) a search based upon artificial intelligence techniques that profits from the large number of colors present in J-PLUS data. We estimate that J-PLUS will provide around 1600–2400 new candidates by the end of the survey.
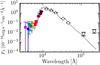
Fig. 13. J-PLUS photospectrum of a confirmed ultracool dwarf in the EDR footprint. J-PLUS measurements (colored symbols) are complemented by 2MASS (white triangles) and WISE (white diamonds) data. The (smoothed) best-fit model is provided by the gray line.
-
Detection and characterization of white dwarfs (WDs). The bluest J-PLUS bands permit characterizing the WD population. As an example, we present the J-PLUS photospectrum of a spectroscopically confirmed WD in Fig. 14. From the experience from the Sloan and the Gaia surveys, we expect that J-PLUS will characterize about 3 WDs per square degree, or about 30 000 WDs for a final area of 8500 deg2.
-
Search for stellar streams in the MW halo. The efficiency of detecting stellar streams in the MW halo is heavily dependent on the possibilities to filter out candidate sub-populations from the background halo stars, which in general have very similar properties: they are also old, low in mass, and poor in metals. While already the SDSS broad-band filters have allowed searching for and detecting stellar streams using the Hess diagrams (Grillmair & Dionatos 2006), the stellar parameters based on the J-PLUS filter set are even more promising for such a work, especially in combination with the powerful but shallower data set of stellar kinematics from the Gaia mission.
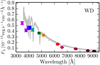 |
Fig. 14. J-PLUS photospectra of the white dwarf marked in Fig. 11. The gray lines show the BOSS spectra of this object. |
4.1.2. Searching for planetary nebulae and symbiotic stars
Here we address the study of distinct families of systems, namely planetary nebulae (PNe) and symbiotic systems (SySts). These two both involve the ionization of circumstellar gas, either ejected and ionized by a WD itself (PNe), or associated with the stellar wind of a red giant that is ionized by high-energy photons generated in the accretion onto a companion star (SySts).
A continuum marked by emission lines is the optical fingerprint of both PNe and SySts. The PNe and the population of known SySts revealed in optical surveys usually present strong hydrogen and helium recombination lines (e.g., Hα, He I, and He II) as well as a number of low- and high-excitation lines (e.g., [O III], or even [Fe VII] and [O VI] in the case of SySts; Gonçalves et al. 2015). They are thus ideal targets to be searched for by J-PLUS in the direction of the northern Galactic halo. Moreover, the SySts spectra (see, e.g., Munari & Zwitter 2002) are also rich in absorption features such as TiO, VO, and others, which is due to the presence of the cool companion (with M, K, or G spectral types).
J-PLUS will profit from the large number of colors derived from the 12 filters and optimize them in order to enlarge the catalog of known PNe and SySts in the Galactic halo, in which only very few detected sources belong to these two families. In Fig. 15 we present the J-PLUS photospectra of two known halo PNe, H 4-1 and PNG 135.9+55.9, in which the Hα emission line is easily perceptible. In the case of SySts candidates, additional clues can also be provided from observations available in X-rays surveys (e.g., XMM-Newton, Chandra, and Swift), especially for objects that display weak emission lines (Mukai et al. 2016). These sources can represent a significant fraction of SySts that have remained invisible to current optical surveys.
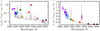 |
Fig. 15. J-PLUS photospectra of the PNe H 4-1 (left panel) and PNG 135.9+55.9 (right panel). The strong Hα emission is easily perceptible in the two panels. |
4.1.3. Galactic globular clusters: the case of M15
The wide-field capabilities of JAST/T80Cam are an excellent tool for studying a wide range of integrated properties of Galactic globular clusters (GGCs), such as mass and luminosity segregation, luminosity functions (LF), and total mass. In addition, the data can also be used to search for multiple stellar populations that have been detected in a large portion of GGCs (see, e.g., Gratton et al. 2012; Bastian 2015), in different regions of the clusters, as well as any large-scale effects that may be related to them, such as disruption seen in the form of tidal tails. We expect to find around 10 GGCs in the footprint of J-PLUS.
To illustrate this science case, M 15 has been observed during J-PLUS science verification well beyond the tidal radius (Rtidal = 21.5 arcmin, Harris 2010) with uniform photometry. The full analysis for this cluster using J-PLUS SVD is presented in Bonatto et al. (2019). In this work, a study of the color-magnitude diagram (CMD) J0378 versus (J0378 − J0861) yields the detection of a clear split in the RGB into two distinct sequences, suggesting a link to light element abundances (since the J0378 and J0861 filters are sensitive to N and Ca). Further details are provided in Bonatto et al. (2019).
4.2. Studies in the nearby Universe
Large spectroscopic surveys of galaxies at low redshifts fail to map the whole extent of spatially resolved galaxies and their close environment. To solve the first issue, systematic studies based on integrated field units (IFUs) have been conducted (e.g., the Sauron project, de Zeeuw et al. 2002; ATLAS3D, Cappellari et al. 2011; CALIFA, Sánchez et al. 2012; SAMI, Croom et al. 2012; MaNGA, Bundy et al. 2015). With these, galaxies as a whole can be alanyzed and gradients or trends in specific properties can be searched for. However, while spectroscopy is usually less efficient and more time-consuming than photometric studies, IFU studies tend to be limited to bright and size-selected objects.
Half-way between classical photometry and spectroscopy, J-PLUS will build a formidable legacy data set by delivering low-resolution spectroscopy for every pixel over a large, contiguous area of the sky. This IFU-like character, allowing a 2D pixel-by-pixel investigation of extended galaxies, will lead to much larger galaxy samples than classical multi-object spectroscopic surveys. In addition, no sample selection criteria other than the photometric depth in the detection band will result in a uniform and non-biased spatial sampling, thus allowing for environmental studies. Furthermore, provided that direct imaging is more efficient than spectroscopy, J-PLUS will generally be deeper than traditional spectroscopic studies, enabling better access to galaxy outskirts and fainter companions.
Figure 17 shows the limits of J-PLUS for studies in the nearby Universe. It represents the plane defined by the mean effective surface brightness ⟨μe, r⟩ and the apparent magnitude in the r band for more than 28 000 DR1 galaxies10 belonging to eight representative J-PLUS pointings, both in depth and FWHM. We note that down to r = 20.5, J-PLUS can detect galaxies brighter than ⟨μe, r⟩ = 25.0. In addition, objects down to r = 21.5 have been observed by J-PLUS with ⟨μe.r⟩ brighter than ≈23.5. This depth makes J-PLUS an ideal survey to select targets for spectroscopic follow-ups by future surveys such as WEAVE11, MANGA12, or DESI13.
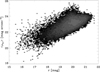 |
Fig. 17. Typical distribution of J-PLUS galaxies in the plane defined by mean effective surface brightness ⟨μe, r⟩ and apparent magnitude, both in the r band. The galaxy subsample illustrated in this plot consists of more than 28 000 objects with a galaxy probability >0.99, taken from eight representative DR1 tiles for which 1.05 < FWHM < 1.15, and the 5σ limiting magnitude is r ∼ 21.5. |
In this section, we demonstrate J-PLUS capabilities to study the properties of nearby galaxies, focusing on their photometric redshift (Sect. 4.2.1), 2D star formation rate (hereafter SFR, Sect. 4.2.2), 2D stellar content (Sect. 4.2.3), and environment (pairs, groups, and clusters; Sect. 4.2.4).
4.2.1. Photometric redshifts
Photometric redshifts (or photo-zs) are estimates of the redshifts of extragalactic sources based upon their SEDs as it is inferred from their apparent magnitudes provided by a particular filter system. Photo-zs have become an essential tool in modern astronomy since they represent a quick and almost inexpensive way of retrieving redshift estimates for many galaxies in a reasonable amount of observational time.
Although redshift estimates from galaxy colors are more uncertain than those obtained from spectroscopy, this situation is certainly being mitigated. The strong dependency between the wavelength resolution (number and type of passbands) and the achievable precision of photo-zs (e.g., Hickson et al. 1994; Benítez et al. 2009) has inspired the design of a whole generation of medium-to-narrow multi-band photometric redshift surveys. Surveys such as COMBO-17, COSMOS, ALHAMBRA, PAU, or SHARDS have used a combination of broad-, medium-, and narrow-band filters to increase the sensitivity to emission lines with moderate equivalent widths, providing photo-zs as accurate as δz/(1 + z) < 0.01 for galaxies with high S/N. As demonstrated in Benitez et al. (2014), the upcoming new generation of >50 narrow-band photometric surveys will push this technique yet further, reaching a photo-z precision level of δz/(1 + z)∼0.003 or 0.3%, equivalent to a resolution of R ≃ 50 from a real spectrograph.
The main uncertainties in the estimation of photo-zs for optical surveys such as J-PLUS come from (i) the available wavelength resolution (number and type of pass-bands), and (ii) the limited photometric depth of the observations. In this sense, it is worth noting that the J-PLUS photometric system is well designed to recover accurate photo-z information of nearby galaxies with z ≲ 0.2, thanks to continuous covering of the 4000 Å break and the presence of particular emission lines. To illustrate this, Fig. 16 shows a representative example of J-PLUS photospectra for four cluster galaxies located at z ∼ 0.065 in tile 4951. These nearby photospectra are found to be in good agreement with the outputs from spectroscopy (gray lines).
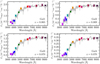 |
Fig. 16. J-PLUS photospectrum of the four galaxies marked in Fig. 11. The SDSS spectra, scaled to match the r-band total magnitude from J-PLUS, are presented in gray. |
Photometric redshifts for J-PLUS DR1 galaxies have been computed using BPZ214, LePhare15, and TPZ16. These three sources are provided individually in the DR1 catalogs. A quantitative comparison between J-PLUS DR1 photo-zs from BPZ2 and SDSS spectroscopic values is provided in Fig. 18. As we show in Fig. 19, the spectroscopic values are retrieved without significant bias (|Δz|≡|zphot − zspec|< 0.005 for r-band magnitude <20) and with a typical error δz/(1 + z) in the range 0.005–0.03 for r ∈ [16, 20.0]. In particular, δz/(1 + z)< 0.02, 0.03 and 0.05 for z ≤ 0.1, 0.3 and 0.5, respectively.
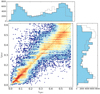 |
Fig. 18. J-PLUS photometric redshifts vs. SDSS spectroscopic redshifts for the sources in common with the J-PLUS DR1. The side panels show the projection in redshift space of the photometric (right panel) and spectroscopic (top panel) values. Photometric redshifts were computed using BPZ2. |
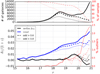 |
Fig. 19. Characterization of the J-PLUS photometric redshifts derived from BPZ2 for the J-PLUS DR1 galaxies in comparison with SDSS spectroscopic redshifts. Upper panel: total number of objects in each magnitude bin (black) and their corresponding percentages (red) used in the comparison for the whole sample and for two cuts in the odd parameter, as indicated in the label. Lower panel: bias (black), the scatter measured by the normalized median absolute deviation (nmad; blue) as described in Hoaglin et al. (1983), and the percentage of outliers (red) for the J-PLUS photometric redshifts as a function of magnitude. |
These results are in agreement with those presented in Molino et al. (2019), obtained from two nearby clusters contained in the J-PLUS SVD. This work also demonstrates the benefit of extending the classical 5 broad-band surveys (such as SDSS) to the 12 J-PLUS bands. Both the direct comparison with SDSS spectroscopic information and the simulations from Molino et al. (2019) found a significant improvement in the photo-z precision at all magnitude bins. This reaches a gain of factor as high as 2.5 when the S/N in the narrow-band filters is high enough. Interestingly, as pointed out in Molino et al. (2019), SDSS-like surveys cannot surpass a certain precision in the photo-z estimates, regardless of the S/N of the galaxies. This limitation is imposed by the poor wavelength resolution provided by broad bands, causing a degeneracy in the color-redshift space. Although J-PLUS observations are shallower in terms of photometric depth than those of SDSS, they are indeed deeper in terms of photometric redshift depth because the seven narrow bands were added to the filter system.
4.2.2. 2D SFR
As an alternative to spectroscopy, narrow-band filters offer a great opportunity to conduct systematic studies of ELGs, sacrificing the precision that spectroscopy offers for much larger data samples with significantly better statistics. The SFR is known to correlate with the emission of Hα by the heated gas in star-forming regions (Kennicutt 1998). The large sky coverage and the specific rest-frame Hα filter J0660 make J-PLUS a very powerful survey to study the integrated and the spatially resolved SFR at z < 0.017.
In order to further illustrate the J-PLUS potential in the study of Hα emission, we present the analysis of one NGC5486 HII region in Fig. 21. J-PLUS photometry at the location of the SDSS fibre is consistent with the SDSS spectra, and presents a clear flux excess in the J0660 band due to the Hα+[N II] emission of the region. The J0378 band is also raised because of the nebular [O II] emission. Finally, the J-PLUS J0660 − r image of NGC5486 shows a population of HII regions lacking spectral information. The study of spatial gradients within these galaxies, together with individual HII regions in a large, nearby galaxy sample will be possible after J-PLUS completion. As a bonus, it will also be possible to address the impact of the environment on these systems.
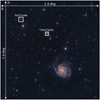 |
Fig. 20. One of the J-PLUS SVD pointings, including M101 and several NGC galaxies, two of which are indicated in white boxes as they are discussed in this paper. |
 |
Fig. 21. NGC5486 as seen in the J-PLUS J0660 − r image (left panel). The panel shows a 53.3 arcmin2 area. The red dot marks the position of an HII region observed spectroscopically by SDSS. The J-PLUS photospectrum and the SDSS spectrum of this region are shown in the right panel. The data sets are normalized to have the same r-band magnitude. The J0660 and J0378 fluxes are raised because of the Hα and [O II] nebular emission. |
Vilella-Rojo et al. (2015) and Logroño-García et al. (2019) showed that the J-PLUS filter set allows unbiasedly recovering the Hα fluxes after correcting for extinction and the [N II] contamination. A comparison with SDSS spectroscopic and CALIFA data in 46 HII regions in common yields consistency (a median flux ratio  for the SDSS case, see Logroño-García et al. 2019, for further details).
4.2.3. 2D stellar populations
The spatial variations of stellar population properties within a galaxy are intimately linked to their formation process. Therefore, spatially resolved studies of galaxies are critical to uncover the history of formation and assembly of local galaxies. Although the arrival of integral field spectroscopy (IFS) surveys constitutes a significant breakthrough in the field, recent techniques that combine photometric multi-filter surveys with spectral fitting diagnostics have opened a new way to distinguish the stellar population of unresolved extended galaxies, and with a relatively low-cost compared to IFU surveys.
Current generations of IFS surveys allow detailed internal analyses through multiple spectra of each galaxy by creating a 2D map of the object. While these surveys are very powerful, there are still limitations in terms of accessible redshift ranges and galactocentric distances. For example, MaNGA aims to obtain spatially resolved spectroscopy of 10 000 galaxies, but it will be limited to resolving galaxies spatially out to R = 1.5 Reff (with a subsample reaching R = 2.5 Reff; the effective radius Reff is defined as the radius containing half of the total light emitted by the galaxy), and with a median redshift of z ∼ 0.03. For the SAMI survey, redshifts are limited to z < 0.095 and the data typically reach 1.7 Reff (2 Reff for 40% of the sample). These limitations do not apply to multi-narrow-band photometric surveys, which instead suffer from limited precision in the SED determination. A technique for studying 2D stellar populations in multi-narrow-band photometric surveys has been presented in San Roman et al. (2018), where resolved galaxies in the ALHAMBRA survey are divided into different regions via a centroid Voronoi tessellation, each of which is characterized by multi-color photometry SED fitting (Díaz-García et al. 2015). The application of this technique on J-PLUS data on a subset of galaxies in common with the CALIFA survey is presented in San Roman et al. (2019).
4.2.4. Environmental studies in the nearby Universe
One of the main strengths of large-area photometric surveys is the continuous information provided throughout the field. This enables the analysis of environmental effects, ranging from close pairs and nearby interactions to clusters and large-scale structure.
The photometric redshift accuracy reached by J-PLUS in the nearby Universe, with an uncertainty level δz ∼ 0.02 (Sect. 4.2.1), will improve our knowledge about local groups and clusters, and about their galaxy members. The potential of J-PLUS in this topic was demonstrated in Molino et al. (2019), where J-PLUS SVD of the two nearby galaxy clusters A2589 (z = 0.0414) and A2593 (z = 0.044) were analyzed. As shown in that work, this unbiased, high-quality, photo-z estimation for galaxies in the cluster fields opens the way to statistical studies of cluster membership, while providing valuable data for optimal target selection in spectroscopic follow-ups. In particular, photo-zs produced by J-PLUS will be used by the WEAVE cluster surveys in the process of target selection. It is expected that J-PLUS photo-zs will increase the number of selected cluster galaxy members by a factor 2–3. This improvement is particularly relevant in the range of faint magnitudes and in the outskirts of galaxy clusters.
J-PLUS is also suitable to study the intracluster light (ICL), generally defined as the luminous component of galaxy clusters belonging to stars that are gravitationally bound to the cluster gravitational potential, but not locked in any of the individual member galaxies. They are believed to be released through dynamical stripping of stars during the hierarchical process of cluster assembly and growth (Contini et al. 2014). The ICL fraction and its properties are thus key to understanding the formation history of galaxy clusters (e.g., Feldmeier et al. 2004; Rudick et al. 2011; Montes & Trujillo 2014), as well as to determining the correct baryon fraction to be compared to cosmological estimates (e.g., Lin & Mohr 2004).
The J-PLUS filter system and the large contiguous area covered by the survey for the first time enable studying the ICL colors of nearby clusters using narrow bands. This yields low-resolution information on the SED of the ICL, and provides key information about the origin of this stellar component. Jiménez-Teja et al. (2019) presented the first estimation of the ICL fraction with J-PLUS SVD on the Coma cluster. This yielded 24% of ICL with respect to the total cluster light at a radius of approximately 0.5 Mpc. Further details are given in that work.
4.3. Redshift windows in the distant Universe
The filter set configuration of J-PLUS, including several narrow-band filters, allows for a unique search of high-redshift targets that display emission lines. The wide area coverage of the survey compensates for its shallow magnitude limit, thus opening a window for exploring the abundance and properties of statistical samples of bright ELGs at different redshifts. Many redshift windows provided by the narrow-band filters can be used to target a strong optical emission line. Most notably, (i) z ∼ 0.77, when the [O II] λλ3726, 3729 doublet enters the J0660 filter; (ii) z ≈ 2.1 (2.2), when the Lyα line enters the J0378 (J0395) filter, and (iii) z ∼ 4.4, when the Lyα line enters the J0660 filter.
Typical searches for ELGs using narrow bands are significantly affected by interlopers, that is, by line confusion. With J-PLUS data, all the 12 filters can be used to gain color information that mitigates the impact of emitters at undesired redshifts.
4.3.1. [O II] emission at z = 0.77
The ELGs at z ∼ 0.77 are currently being targeted by several ongoing and planned multi-object spectroscopic (MOS) cosmological surveys, such as 4MOST, DESI, PFS, and eBOSS (de Jong et al. 2012; Weinberg et al. 2013; Takada et al. 2014; Delubac et al. 2017). Broad-band target selection designed to select ELGs at z ∼ 0.77 can deliver success rates on the order of 70% because of the completeness and purity of the broad-band photometry that is used to define their targets (Raichoor et al. 2017). Since J-PLUS is a photometric survey, its selection function only depends on the depth of the images and the ability to assign the correct redshift to an object with flux excess in a narrow-band filter. Thus, the characterization of the ELG population with J-PLUS data is expected to be highly complementary to that coming from MOS facilities.
Assuming a minimum observed equivalent width EW=100 Å, we estimate that we can reach the [O II] line emission down to the luminosity of ∼1 × 1042 erg s−1. These objects will be used to characterize the abundance and clustering properties of star-forming galaxies at z = 0.77 (Orsi et al., in prep.)
4.3.2. Lyα emission at z = 2.2 and 4.4
At higher redshifts, detections are strongly limited by the survey depth. Star-forming Lyα emitting galaxies (Lyα emitters, or LAEs in short) at z ∼ 2 are expected to be detected down to Lyα luminosities of ∼5 × 1043 erg s−1 assuming a minimum observed EW of 100 Å. At z = 4.4, we expect to detect LAEs down to ∼9 × 1043 erg s−1.
Sobral et al. (2015) have spectroscopically confirmed an extremely luminous LAE at z = 6.604, named CR7, with Lyα luminosity of 8.3 × 1043 erg s−1. A thorough census of these extreme objects has not yet been possible because of the prohibitively large volume that is required. The J-PLUS data set can thus perform an unprecedented search for these extremely bright emitters at high redshifts (Fig. 22). Furthermore, J-PLUS is also expected to detect Lyα blobs (LABs) among the usual high-z, star-forming, Lyα emitting, compact galaxies. LABs are an extremely rare class of Lyα emitters (comoving number density nc < 10−6 Mpc−4) showing spatially extended Lyα emission (∼30–200 kpc, see e.g., Smailagić et al. 2016).
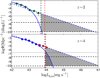 |
Fig. 22. Bright end of the LAE LF accessible by J-PLUS. The gray shaded areas in both panels show the region of the LF that can be probed with the J-PLUS area and flux depth (dark gray for a Schechter-like LF, light gray for a power-law LF). The horizontal dotted/dashed lines represent the lowest possible value of the LF achievable with the J-PLUS EDR/full survey. The black vertical dashed line shows the limiting luminosity of J-PLUS at redshifts 2.2 (top panel) and 4.4 (bottom panel). The vertical red dashed line shows the luminosity of CR7 at z = 6.604 (Sobral et al. 2015) for illustration. Green circles in the top panel show the Lyα LF from Sobral et al. (2017). Blue and red circles correspond to the UDS+COSMOS and SA22 samples from Matthee et al. (2015). The solid blue and dashed lines correspond to Schechter and power-law fits to the data, respectively. |
We recall, however, that the emission in a single J-PLUS narrow band is not sufficient to distinguish among the different sources of Lyα emission (star-forming galaxies and QSOs), nor can interlopers at other redshifts be rejected based on this information. QSOs constitute a large portion of the LAE population that is detectable at the depth of J-PLUS (Fig. 23). While a significant number of z ∼ 2 QSOs has been observed within SDSS spectroscopic programs, we expect to be able to identify candidate QSOs that were missed by automatized spectroscopic target selection because we select candidates based on their Lyα emission. This may turn out to be particularly relevant for QSOs in the range of magnitudes r = 12–15, where SDSS stellar images are usually saturated and J-PLUS photometry can play a unique role.
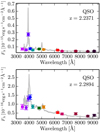 |
Fig. 23. J-PLUS photospectrum of two QSOs with SDSS spectra (marked in Fig. 11), located at α = 110.11167, δ = 40.23105, z = 2.2371 (top panel), and α = 110.22740, δ = 40.14428, z = 2.2894 (bottom panel). The Lyα broad-line emission is clear in both sources and is captured by the J0410 filter, showing a relative excess with respect to the continuum traced by both broad bands and rightmost narrow-band filters. |
In summary, the J-PLUS filter configuration allows selecting samples of ELGs and QSOs in narrow redshift ranges when the line emission can be isolated and characterized. From a preliminary analysis of the J-PLUS EDR, for example, we selected a sample of ∼30 LAE candidates consistent with z ≈ 2 Lyα emitting sources, including galaxies and QSOs, which we plan to analyze with spectroscopic follow-up.
4.4. Variable sources
Exposures on each J-PLUS filter are acquired sequentially, and this provides sensitivity to source variability (either in flux and/or sky position) on timescales shorter than approximately one hour. This timescale corresponds to the typical time interval between the first and last exposure of the same pointing, taking into account all the filters, as explained in Sect. 2.4. In this sense, J-PLUS is for instance well-suited to trace a wide range of objects that vary their position, such as solar system minor bodies, for which a specific J-PLUS science case is later on presented in this section. A clear example for the position variability of a minor body in our solar system is presented in Fig. 24. Other transients with typical periods much longer than the typical J-PLUS observing sequence are not optimal for J-PLUS, except to provide precise photometric information in a new epoch that can be exploited together with external data archives. This is the case of flux variations of cataclysmic variables and variable RR Lyrae stars, for example. Figures 26 and 27 illustrate two examples of theses types of stars as seen by J-PLUS.
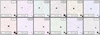 |
Fig. 24. Twelve J-PLUS band images of the minor body marked in Fig. 11. The observing sequence spans 39.4 min, starting with the i band and ending with the z band. |
To enhance the time-domain capabilities of J-PLUS without affecting its progress efficiency, a specific observing program for the T80Cam has been defined to revisit several J-PLUS pointings in different epochs, with only a subset of the J-PLUS filters. This program, namely J-VAR, is mainly focused on supernovae and pulsating and active stars. It started to gather data in 2017 as a filler program for the T80Cam and used observing time when the weather conditions were not stable enough to conduct J-PLUS. Its definition and first results will be presented in a forthcoming dedicated paper (Ederoclite et al., in prep.).
All-sky photometric surveys like J-PLUS will necessarily observe a large number of minor bodies of the solar system during normal operation. The majority of the known minor bodies are found in the main asteroid belt, with their orbits confined between those of Mars and Jupiter.
The composition of minor bodies has a direct relation to the region of the protoplanetary disk where they formed. A crucial feature to shed light on this topic is the broad, shallow phyllosilicate band at 0.7 μm, which indicates that the object was originally rich in water, and that its interior reached temperatures capable of sustaining the presence of liquid water for an extended period of time. The low spectral resolution of broad-band filter systems tends to render the detection of the 0.7 μm band unreliable (Rivkin 2012). This feature has been studied spectroscopically in a relatively small sample of asteroids, but can be better detected with J-PLUS as the spectral interval covered by the band is sampled by two narrow-band filters in addition to the r, i, and z filters. For illustration, the reflectance spectrum of asteroid (1024) Hale, obtained from observations taken during normal survey conditions, is shown in Fig. 25.
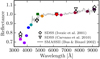 |
Fig. 25. Reflectance spectrum of the hydrated asteroid (1024) Hale obtained from J-PLUS observations, together with two sets of reflectance spectra from SDSS observations (Ivezić et al. 2001; Carvano et al. 2010) and another obtained with low-dispersion spectroscopy (Bus & Binzel 2002). All spectra are normalized at the r band. The J-PLUS observations were made during normal survey operation on 2017-01-07, while the asteroid had V = 15.2 mag. The solar colors used to obtain the J-PLUS reflectance spectrum were calculated using a reference solar spectrum from Chance & Kurucz (2010). The resulting error bars are smaller than the size of the points in the figure. |
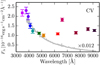 |
Fig. 26. J-PLUS photospectrum of the cataclysmic variable J0743+4106. The blue side of the spectrum is dominated by the WD emission, while the red side is dominated by the secondary star. The J0660 filter shows the prominent Hα emission of the disk. For comparison, the spectrum from SDSS DR12 is shown in gray (but multiplied by a factor 0.012 to match the bluest filters). This spectrum was clearly obtained during a high mass-accretion phase, while the J-PLUS photometry was obtained during a low mass-accretion phase. |
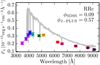 |
Fig. 27. J-PLUS photospectrum of the RR Lyrae star of type RRc (α = 123.6246 deg, δ = 31.188 deg). The gray line shows the SDSS spectrum of this star. The J-PLUS photospectrum and the SDSS spectrum were acquired at different pulsation phases ϕ, as labeled in the panel, with ϕ = 0, 1 corresponding to the maximum flux of the source (i.e., the entire period is covered by the ϕ range of values ϕ ∈ [0, 1). The SDSS spectrum was taken not far from its maximum brightness. |
Using data from the observations obtained so far, it is possible to estimate the depth at which asteroids can be expected to be observed during the survey. We find that the detection efficiency at the bluer filters starts to fall around V = 17.5 mag, but for the filters involved in the detection of the 0.7 μm band, the detection efficiency remains high up to V = 19 mag. Simulations indicate that during the survey execution time, over ten thousands known asteroids brighter than V = 19 mag will be observed. Therefore the J-PLUS data set of minor bodies will provide a valuable tool for probing the distribution of hydration in the main asteroid belt when it is complete.
5. Summary and conclusions
This paper is devoted to present and illustrate the J-PLUS survey and its main scientific applications. J-PLUS is a 12-band photometric survey of thousands of square degrees in the Northern Hemisphere that is being conducted at the OAJ. The most remarkable characteristics of the survey rely on the 2 deg2 FoV of T80Cam at the JAST/T80 telescope and on a unique system of 12 optical filters, including broad-band, medium-width, and narrow-band optical filters in the range 3500–10 000 Å. This filter system has been designed to optimally extract rest-frame spectral features that are key to characterizing the stellar types in our MW as well as to perform stellar population and star formation studies in nearby galaxies. Overall, J-PLUS provides, unprecedentedly, a low resolution photospectrum of 12 points for every pixel of the sky in the footprint of the survey.
The paper also releases the first ∼1000 deg2 of J-PLUS data, amounting to ∼4.3 million stars and ∼3 million galaxies at r < 21 mag observed in 12 broad, intermediate, and narrow optical bands. This data set is used to illustrate some of the science cases that will be addressed by J-PLUS. At the time of writing, J-PLUS has mapped more than 1400 deg2, providing unprecedented information of the SED for millions of stars and galaxies.
With a choice of narrow- and medium-width filters that are strategically placed to render accurate stellar type information (the 3700–4000 Å Balmer break region, Hδ, Ca H+K, the G band, and the Mg b and Ca triplets), the addition of narrow-band filters centered upon the Hα/λ6563 and [O II]/λ3727 lines constitutes a powerful window to the star formation activity in the local Universe, and also to bright emission lines at higher redshifts. Consequently, J-PLUS is providing a unique data set with direct applications in the characterization of the stellar populations of our Galaxy, including metal-poor stars, WDs, ultracool dwarfs, PNe, symbiotic stars, cataclismic variables, and globular clusters. The same set of filters enables IFU-like 2D studies in nearby (z < 0.017) galaxies with unprecedented quality and statistics, and provides high-quality photo-z estimates (with an error amplitude of δz ∼ 0.01–0.03 for r < 21 mag) for extragalactic objects. In addition, in the extragalactic sky, the narrow-band filters of J-PLUS provide sensitivity to particular redshift shells in the Universe that correspond to the rest-frame frequency of power lines like Lyα or [O II]/λ3727.
A great part of the added value of J-PLUS resides, in addition to its large-scale/panoramic character owed to its 2 deg2 FoV, in the medium-width and narrow-band filters. These place J-PLUS in the league of other spectrophotometric surveys that use multiple band imaging as an alternative to spectroscopy. The nature of this approach, which drastically simplifies selection biases, and the significantly larger statistics of the resulting catalogs constitute two powerful arguments supporting this strategy. While the upcoming J-PAS project can be seen as the definite test where all these expectations will be compared with real data, J-PLUS is currently paving exactly the same way, but with more modest instrumentation. Nonetheless, despite the intrinsic scientific interest of J-PLUS, we here found it to be an ideal strategical test bed for J-PAS as most technical and software developments of J-PLUS will apply very similarly to J-PAS. In addition, all these efforts are being complemented by the twin project S-PLUS, which, from Cerro Tololo, is scanning the Southern Hemisphere with a replica of the J-PLUS telescope, camera, and filter system.
The combination of this type of surveys with spectroscopic ones for calibration and comparison purposes, and from other surveys at other wavelength ranges such as X-ray or γ-ray, should significantly improve our knowledge of the SEDs for practically all families of sources in our Universe. Furthermore, if systematics are kept below the required level, this spectrophotometric approach should also open the possibility of studying the unresolved emission associated with particular emission lines at particular redshift shells (also known as intensity mapping, Kovetz et al. 2017), thus providing a new way to conduct tomography of the Universe in the optical range.
To conclude, J-PLUS may thus be opening an exciting and interesting new phase in optical, large-scale, astrophysical surveys. Ultimately, J-PLUS will become a powerful multicolor view of the nearby Universe that will observe and characterize tens of millions of galaxies and stars of the MW halo, with a wide range of astrophysical applications and a striking potential for bringing unexpected discoveries to our knowledge of the Universe. The J-PLUS data will be made public progressively in subsequent data releases, an expression of its commitment to become a major legacy project for the astronomy and astrophysics of the next decades.
Defined as objects with total_prob_star < 0.01. This flag, that can be found in the DR1 database table jplus.stargalclass, provides the probability of an object for being a star based upon morphological arguments. See López-Sanjuan et al. (2019) for further details.
Acknowledgments
We thank the anonymous referee for providing useful suggestions that have improved the overall quality of this paper. Funding for the J-PLUS Project has been provided by the Governments of Spain and Aragón through the Fondo de Inversiones de Teruel, by the Spanish Ministry of Economy and Competitiveness (MINECO; under grants AYA2012-30789, AYA2013-40611-P, AYA2015-66211-C2-1-P, AYA2015-66211-C2-2, AYA2016-77846-P, AYA2016-77237-C3-1-P, AYA2016-75931-C2-1-P, AYA2017-86274-P, AGAUR grant SGR-661/2017, and ICTS-2009-14), by the Government of Aragon, through the Grupo de Investigación E16_17R, and by European FEDER funding (FCDD10-4E-867, FCDD13-4E-2685). Further support has been provided by the Ramón y Cajal programmes RYC-2016-20254, RYC-2011-08262 and RYC-2011-08529. This research has made use of the Spanish Virtual Observatory (http://svo.cab.inta-csic.es) supported from the Spanish MINECO through grant AYA2014-55216. We also acknowledge Spanish CSIC (I-COOP+ 2016 program) through grant COOPB20263. The Brazilian agencies FAPESP and the National Observatory of Brazil have also contributed to this project. We acknowledge financial support from the Fundação Carlos Chagas Filho de Amparo à Pesquisa do Estado do Rio de Janeiro – FAPERJ (fellowship Nota 10, PDR-10), from CNPq through BP grant 312307/2015-2 and Universal Grants 459553/2014-3, PQ 302037/2015-2, and PDE 200289/2017-9), FINEP grants REF. 1217/13 – 01.13.0279.00 and REF 0859/10 – 01.10.0663.00, from FAPERJ grant E-26/202.835/2016, and CAPES (Science without Borders program, Young Talent Fellowship, BJT) through grants A062/2013 and CAPES-PNPD 2940/2011. The FAPESP grants no. 2015/12745-6, 2014/11338-5, 2014/07684-5, 2013/04582-4 and 2009/54202-8 are also acknowledged. Finally, the authors acknowledge partial support from grant PHY 14-30152; Physics Frontier Center/JINA Center for the Evolution of the Elements (JINA-CEE), awarded by the US National Science Foundation.
References
- Allende Prieto, C. 2016, A&A, 595, A129 [NASA ADS] [CrossRef] [EDP Sciences] [Google Scholar]
- Allende Prieto, C., Beers, T. C., Wilhelm, R., et al. 2006, ApJ, 636, 804 [NASA ADS] [CrossRef] [Google Scholar]
- Allende Prieto, C., Koesterke, L., Hubeny, I., et al. 2018, A&A, 618, A25 [NASA ADS] [CrossRef] [EDP Sciences] [Google Scholar]
- An, D., Beers, T. C., Santucci, R. M., et al. 2015, ApJ, 813, L28 [NASA ADS] [CrossRef] [Google Scholar]
- Aparicio Villegas, T., Alfaro, E. J., Cabrera-Caño, J., et al. 2010, AJ, 139, 1242 [NASA ADS] [CrossRef] [Google Scholar]
- Bailer-Jones, C. A. L. 2004, A&A, 419, 385 [NASA ADS] [CrossRef] [EDP Sciences] [Google Scholar]
- Bastian, N. 2015, ArXiv e-prints [arXiv:1510.01330] [Google Scholar]
- Benitez, N., Dupke, R., Moles, M., et al. 2014, ArXiv e-prints [arXiv:1403.5237] [Google Scholar]
- Benítez, N., Moles, M., Aguerri, J. A. L., et al. 2009, ApJ, 692, L5 [NASA ADS] [CrossRef] [Google Scholar]
- Bertin, E. 2006, in Astronomical Data Analysis Software and Systems XV, eds. C. Gabriel, C. Arviset, D. Ponz, & S. Enrique, ASP Conf. Ser., 351, 112 [NASA ADS] [Google Scholar]
- Bertin, E., & Arnouts, S. 1996, A&AS, 117, 393 [NASA ADS] [CrossRef] [EDP Sciences] [Google Scholar]
- Bertin, E., Mellier, Y., Radovich, M., et al. 2002, in Astronomical Data Analysis Software and Systems XI, eds. D. A. Bohlender, D. Durand, & T. H. Handley, ASP Conf. Ser., 281, 228 [NASA ADS] [Google Scholar]
- Bonatto, C., Chies-Santos, A. L., Coelho, P. R. T., et al. 2019, A&A, 622, A179 [NASA ADS] [CrossRef] [EDP Sciences] [Google Scholar]
- Bundy, K., Bershady, M. A., Law, D. R., et al. 2015, ApJ, 798, 7 [NASA ADS] [CrossRef] [Google Scholar]
- Bus, S. J., & Binzel, R. P. 2002, Icarus, 158, 106 [CrossRef] [Google Scholar]
- Cappellari, M., Emsellem, E., Krajnović, D., et al. 2011, MNRAS, 413, 813 [NASA ADS] [CrossRef] [Google Scholar]
- Cardamone, C. N., van Dokkum, P. G., Urry, C. M., et al. 2010, ApJS, 189, 270 [NASA ADS] [CrossRef] [Google Scholar]
- Carrasco, J. M. 2006, Diseño y caracterización del sistema fotométrico de la misión Gaia de la Agencia Espacial Europea (Barcelona: Universitat de Barcelona) [Google Scholar]
- Carvano, J. M., Hasselmann, P. H., Lazzaro, D., & Mothé-Diniz, T. 2010, A&A, 510, A43 [NASA ADS] [CrossRef] [EDP Sciences] [Google Scholar]
- Cenarro, A. J., Moles, M., Cristóbal-Hornillos, D., et al. 2010, SPIE Conf. Ser., 7738 [Google Scholar]
- Cenarro, A. J., Moles, M., Cristóbal-Hornillos, D., et al. 2012, SPIE Conf. Ser., 8448 [Google Scholar]
- Cenarro, A. J., Moles, M., Marín-Franch, A., et al. 2014, SPIE Conf. Ser., 9149 [Google Scholar]
- Chance, K., & Kurucz, R. L. 2010, J. Quant. Spectr. Rad. Transf., 111, 1289 [NASA ADS] [CrossRef] [Google Scholar]
- Chueca, S., Marín-Franch, A., Cenarro, A. J., et al. 2012, SPIE Conf. Ser., 8450 [Google Scholar]
- Contini, E., De Lucia, G., Villalobos, Á., & Borgani, S. 2014, MNRAS, 437, 3787 [NASA ADS] [CrossRef] [EDP Sciences] [Google Scholar]
- Covey, K. R., Ivezić, Ž., Schlegel, D., et al. 2007, AJ, 134, 2398 [NASA ADS] [CrossRef] [Google Scholar]
- Cristóbal-Hornillos, D., Varela, J., Ederoclite, A., et al. 2014, in Software and Cyberinfrastructure for Astronomy III, Proc. SPIE, 9152, 91520O [CrossRef] [Google Scholar]
- Croom, S. M., Lawrence, J. S., Bland-Hawthorn, J., et al. 2012, MNRAS, 421, 872 [NASA ADS] [Google Scholar]
- Cuillandre, J. C. J., Withington, K., & Hudelot, P. 2012, in Observatory Operations: Strategies, Processes, and Systems IV, Proc. SPIE, 8448, 84480M [NASA ADS] [CrossRef] [Google Scholar]
- de Jong, R. S., Bellido-Tirado, O., Chiappini, C., et al. 2012, in Ground-based and Airborne Instrumentation for Astronomy IV, Proc. SPIE, 8446, 84460T [Google Scholar]
- de Zeeuw, P. T., Bureau, M., Emsellem, E., et al. 2002, MNRAS, 329, 513 [NASA ADS] [CrossRef] [Google Scholar]
- Delubac, T., Raichoor, A., Comparat, J., et al. 2017, MNRAS, 465, 1831 [NASA ADS] [CrossRef] [Google Scholar]
- Díaz-García, L. A., Cenarro, A. J., López-Sanjuan, C., et al. 2015, A&A, 582, A14 [NASA ADS] [CrossRef] [EDP Sciences] [Google Scholar]
- Feldmeier, J. J., Mihos, J. C., Morrison, H. L., et al. 2004, ApJ, 609, 617 [NASA ADS] [CrossRef] [Google Scholar]
- Fukugita, M., Ichikawa, T., Gunn, J. E., et al. 1996, AJ, 111, 1748 [NASA ADS] [CrossRef] [Google Scholar]
- Gaia Collaboration (Prusti, T., et al.) 2016, A&A, 595, A1 [NASA ADS] [CrossRef] [EDP Sciences] [Google Scholar]
- Gonçalves, D. R., Magrini, L., de la Rosa, I. G., & Akras, S. 2015, MNRAS, 447, 993 [NASA ADS] [CrossRef] [Google Scholar]
- Gratton, R. G., Carretta, E., & Bragaglia, A. 2012, A&ARv, 20, 50 [CrossRef] [Google Scholar]
- Grillmair, C. J., & Dionatos, O. 2006, ApJ, 643, L17 [NASA ADS] [CrossRef] [Google Scholar]
- Harris, W. E. 2010, ArXiv e-prints [arXiv:1012.3224] [Google Scholar]
- Hickson, P., Gibson, B. K., & Callaghan, K. A. S. 1994, MNRAS, 267, 911 [NASA ADS] [CrossRef] [Google Scholar]
- High, F. W., Stubbs, C. W., Rest, A., Stalder, B., & Challis, P. 2009, AJ, 138, 110 [NASA ADS] [CrossRef] [Google Scholar]
- Hoaglin, D.C., Mosteller, F., & Tukey, J.W. 1983, Understanding Robust and Exploratory Data Anlysis (New York: Wiley) [Google Scholar]
- Ilbert, O., Capak, P., Salvato, M., et al. 2009, ApJ, 690, 1236 [NASA ADS] [CrossRef] [Google Scholar]
- Ivezić, Ž., Tabachnik, S., Rafikov, R., et al. 2001, AJ, 122, 2749 [NASA ADS] [CrossRef] [Google Scholar]
- Ivezić, Ž., Sesar, B., Jurić, M., et al. 2008, ApJ, 684, 287 [NASA ADS] [CrossRef] [Google Scholar]
- Jiménez-Teja, Y., Dupke, R., de Lopes Oliveira, R., et al. 2019, A&A, 622, A183 [NASA ADS] [CrossRef] [EDP Sciences] [Google Scholar]
- Jordi, C., Høg, E., Brown, A. G. A., et al. 2006, MNRAS, 367, 290 [NASA ADS] [CrossRef] [Google Scholar]
- Kaiser, N., Aussel, H., Burke, B. E., et al. 2002, in Survey and Other Telescope Technologies and Discoveries, eds. J. A. Tyson, & S. Wolff, Proc. SPIE, 4836, 154 [Google Scholar]
- Kelly, P. L., von der Linden, A., Applegate, D. E., et al. 2014, MNRAS, 439, 28 [NASA ADS] [CrossRef] [Google Scholar]
- Kennicutt, Jr., R. C. 1998, ARA&A, 36, 189 [Google Scholar]
- Kovetz, E.D., Viero, M.P., Lidz, A., et al. 2017, ArXiv e-prints [arXiv:1709.09066] [Google Scholar]
- Le Borgne, J.-F., Bruzual, G., Pelló, R., et al. 2003, A&A, 402, 433 [NASA ADS] [CrossRef] [EDP Sciences] [Google Scholar]
- Lin, Y.-T., & Mohr, J. J. 2004, ApJ, 617, 879 [NASA ADS] [CrossRef] [Google Scholar]
- Logroño-García, R., Vilella-Rojo, G., López-Sanjuan, C., et al. 2019, A&A, 622, A180 [NASA ADS] [CrossRef] [EDP Sciences] [Google Scholar]
- López-Sanjuan, C.,Vázquez Ramió, H., Varela, J., et al. 2019, A&A, 622, A177 [NASA ADS] [CrossRef] [EDP Sciences] [Google Scholar]
- Marín-Franch, A., Taylor, K., & Cepa, J. 2012a, SPIE Conf. Ser., 8446 [Google Scholar]
- Marín-Franch, A., Chueca, S., Moles, M., et al. 2012b, SPIE Conf. Ser., 8450 [Google Scholar]
- Marín-Franch, A., Taylor, K., Cenarro, J., Cristobal-Hornillos, D., & Moles, M. 2015, IAU General Assembly, 22, 2257381 [NASA ADS] [Google Scholar]
- Martí, P., Miquel, R., Castander, F. J., et al. 2014, MNRAS, 442, 92 [NASA ADS] [CrossRef] [Google Scholar]
- Matthee, J., Sobral, D., Santos, S., et al. 2015, MNRAS, 451, 400 [NASA ADS] [CrossRef] [Google Scholar]
- Moles, M., Benítez, N., Aguerri, J. A. L., et al. 2008, AJ, 136, 1325 [Google Scholar]
- Moles, M., Sánchez, S. F., Lamadrid, J. L., et al. 2010, PASP, 122, 363 [NASA ADS] [CrossRef] [Google Scholar]
- Molino, A., Benítez, N., Moles, M., et al. 2014, MNRAS, 441, 2891 [NASA ADS] [CrossRef] [Google Scholar]
- Molino, A., Costa-Duarte, M. V., Mendes de Oliveira, C., et al. 2019, A&A, 622, A178 [NASA ADS] [CrossRef] [EDP Sciences] [Google Scholar]
- Montes, M., & Trujillo, I. 2014, ApJ, 794, 137 [NASA ADS] [CrossRef] [Google Scholar]
- Mukai, K., Luna, G. J. M., Cusumano, G., et al. 2016, MNRAS, 461, L1 [NASA ADS] [CrossRef] [Google Scholar]
- Munari, U., & Zwitter, T. 2002, A&A, 383, 188 [NASA ADS] [CrossRef] [EDP Sciences] [Google Scholar]
- Pérez-González, P. G., Cava, A., Barro, G., et al. 2013, ApJ, 762, 46 [NASA ADS] [CrossRef] [Google Scholar]
- Placco, V. M., Frebel, A., Lee, Y. S., et al. 2015, ApJ, 809, 136 [NASA ADS] [CrossRef] [Google Scholar]
- Postman, M., Coe, D., Benítez, N., et al. 2012, ApJS, 199, 25 [NASA ADS] [CrossRef] [Google Scholar]
- Raichoor, A., Comparat, J., Delubac, T., et al. 2017, MNRAS, 471, 3955 [NASA ADS] [CrossRef] [Google Scholar]
- Rivkin, A. S. 2012, Icarus, 221, 744 [NASA ADS] [CrossRef] [Google Scholar]
- Rowe, B. T. P., Jarvis, M., Mandelbaum, R., et al. 2015, Astron. Comput., 10, 121 [NASA ADS] [CrossRef] [Google Scholar]
- Rudick, C. S., Mihos, J. C., & McBride, C. K. 2011, ApJ, 732, 48 [Google Scholar]
- Salvadori, S., Ferrara, A., Schneider, R., Scannapieco, E., & Kawata, D. 2010, MNRAS, 401, L5 [NASA ADS] [Google Scholar]
- San Roman, I., Cenarro, A. J., Díaz-García, L. A., et al. 2018, A&A, 609, A20 [NASA ADS] [CrossRef] [EDP Sciences] [Google Scholar]
- San Roman, I., Sánchez-Blázquez, P., Cenarro, A. J., et al. 2019, A&A, 622, A181 [NASA ADS] [CrossRef] [EDP Sciences] [Google Scholar]
- Sánchez, S.F., Kennicutt, R.C., & de Gil Paz, A. 2012, A&A, 538, A8 [NASA ADS] [CrossRef] [EDP Sciences] [Google Scholar]
- Sestito, F., Longeard, N., Martin, N. F., et al. 2019, MNRAS, 484, 2166 [NASA ADS] [CrossRef] [Google Scholar]
- Smailagić, M., Micic, M., & Martinović, N. 2016, MNRAS, 459, 84 [NASA ADS] [CrossRef] [Google Scholar]
- Sobral, D., Matthee, J., Darvish, B., et al. 2015, ApJ, 808, 139 [NASA ADS] [CrossRef] [Google Scholar]
- Sobral, D., Matthee, J., Best, P., et al. 2017, MNRAS, 466, 1242 [NASA ADS] [CrossRef] [Google Scholar]
- Takada, M., Ellis, R. S., Chiba, M., et al. 2014, PASJ, 66, R1 [NASA ADS] [CrossRef] [Google Scholar]
- Tian, H.-J., Gupta, P., Sesar, B., et al. 2017, ApJS, 232, 4 [NASA ADS] [CrossRef] [Google Scholar]
- Tonry, J. L., Stubbs, C. W., Lykke, K. R., et al. 2012, ApJ, 750, 99 [NASA ADS] [CrossRef] [Google Scholar]
- van Dokkum, P. G. 2001, PASP, 113, 1420 [NASA ADS] [CrossRef] [Google Scholar]
- Varela, J., Cristóbal-Hornillos, D., Cenarro, J., et al. 2014, in Statistical Challenges in 21st Century Cosmology eds. A. Heavens, J.-L. Starck, & A. Krone-Martins, IAU Symp., 306, 359 [NASA ADS] [Google Scholar]
- Vilella-Rojo, G., Viironen, K., López-Sanjuan, C., et al. 2015, A&A, 580, A47 [NASA ADS] [CrossRef] [EDP Sciences] [Google Scholar]
- Weinberg, D., Bard, D., Dawson, K., et al. 2013, ArXiv e-prints [arXiv:1309.5380] [Google Scholar]
- Whitten, D. D., Placco, V. M., Beers, T. C., et al. 2019, A&A, 622, A182 [NASA ADS] [CrossRef] [EDP Sciences] [Google Scholar]
- Wolf, C., Meisenheimer, K., Rix, H.-W., et al. 2003, A&A, 401, 73 [NASA ADS] [CrossRef] [EDP Sciences] [Google Scholar]
- Xavier, H. S., Abramo, L. R., Sako, M., et al. 2014, MNRAS, 444, 2313 [NASA ADS] [CrossRef] [Google Scholar]
- York, D. G., Adelman, J., Anderson, Jr., J. E., et al. 2000, AJ, 120, 1579 [CrossRef] [Google Scholar]
All Tables
Main technical performances of the T80Cam panoramic camera at the JAST/T80 telescope.
Planned limiting magnitudes of J-PLUS for point-like sources in a circular aperture of 3 arcsec and S/N > 5, presented together with the averaged limiting magnitudes obtained for the EDR and DR1.
All Figures
|
Fig. 1. View of the JAST/T80 telescope inside its dome at the Observatorio Astrofísico de Javalambre. |
| In the text | |
|
Fig. 2. Left panel: T80Cam 3D model design completely assembled. The top part of the instrument represents the filter and shutter unit, containing the shutter and the two filter wheels. The gray cylindrical object below the filter and shutter unit represents the cryogenic camera. Center panel: same view of the T80Cam model after cover removal, showing the two filter wheels and the shutter. Right panel: T80Cam integrated at the Cassegrain focus of the JAST/T80 telescope. |
| In the text | |
|
Fig. 3. Overall transmission curves measured for the set of 12 J-PLUS filters, including the effect of the entire system (sky, mirrors, lenses, and CCD). |
| In the text | |
|
Fig. 4. Mean sky background at the OAJ in bands J0430 (green), J0660 (yellow), and J0861 (red) as a function of the distance to the Moon and the phase of the Moon: 100% (Full Moon; thickest line), 90% (medium thickness), and 0% (New Moon; thinnest line). This information, computed empirically in advance for all J-PLUS bands, is employed to derive the exposure times in real time that are required to reach the planned J-PLUS limiting magnitudes. |
| In the text | |
|
Fig. 5. Typical photometric uncertainties in the 12 J-PLUS bands as a function of magnitude for a random set of 10 J-PLUS tiles in common with the EDR (gray dots) and the DR1 (colored dots). The black dashed line indicates the DR1 limiting magnitude in each band. At fixed magnitude, the width of the error distribution accounts for different observing conditions in terms of final PSF, sky transparency, and so on. |
| In the text | |
|
Fig. 6. J-PLUS footprint. It is split into two main contiguous areas, indicated in gray, in the Northern and Southern Galactic hemispheres (left and right panels, respectively). The Galactic plane, shown as the green dashed line, is avoided as part of the J-PLUS strategy. The three priority areas of the J-PLUS footprint, NGC-PA1, NGC-PA2, and SGC-PA, are indicated in different colors as given in the labels, together with the footprints or fields from other surveys that entirely or partially match the J-PLUS sky coverage: e.g., Alhambra (ALH; http://www.alhambrasurvey.com; Moles et al. 2008), the Canada-France-Hawaii Telescope Legacy Survey (CFHTLS; http://www.cfht.hawaii.edu/Science/CFHTLS/; e.g., Cuillandre et al. 2012), the Galaxy and Mass Assembly (GAMA; http://www.gama-survey.org), the DEEP2 redshift survey (DEEP2; http://deep.ps.uci.edu/), the Deep Lens Survey (DLS; http://matilda.physics.ucdavis.edu/working/website/techinfo.html), the Extended Groth Strip (EGS; http://aegis.ucolick.org/tech_overview.html), the Great Observatories Origins Deep Survey (GOODS; http://www.stsci.edu/science/goods/), the Hyper Suprime-Cam Subaru Strategic Program (HSC; http://hsc.mtk.nao.ac.jp/ssp/), and the SDSS Legacy Survey (SDSS; https://classic.sdss.org/legacy/index.html). The J-PLUS footprint is fully included in the footprint of the Pan-STARRS 3π survey (Tonry et al. 2012), which observed the whole sky for Dec > −30 deg. |
| In the text | |
|
Fig. 7. Footprint of the J-PLUS DR1. Red squares represent each of the 511 pointings of 2 deg2 provided by the T80Cam. Black squares indicate the subset of 18 pointings that constitute the EDR. Overall, the DR1 amounts effectively to ∼900 deg2 after masking low-exposure regions, the surroundings of bright stars, observational reflections or artifacts, and overlapping areas. |
| In the text | |
|
Fig. 8. FWHM and ellipticity (b/a ratio) statistics of the J-PLUS DR1 (red hatched histograms) and EDR (gray histograms) as measured in r band on objects classified as stars. Histograms are normalized and thus represent probability. |
| In the text | |
|
Fig. 9. Normalized distribution of the limiting magnitudes (5σ, 3 arcsec aperture) of the J-PLUS DR1 (511 tiles, colored hatched histograms) and the EDR (18 tiles, gray histograms). The black dashed vertical lines mark the targeted J-PLUS limiting magnitudes as reported in Table 4. The legend in the panels provides the median of the limiting magnitudes in the two data releases, as well as the rms of the distribution for the DR1. |
| In the text | |
|
Fig. 10. NGC4470 in the 12 J-PLUS bands. This nearby galaxy is ideal to illustrate how a typical HII galaxy is seen by J-PLUS, with many young star-forming knots highlighted on the bluest filters (u and J0378; covering [O II] emission line) and J0660 (covering Hα and [N II] emission lines). As expected, these knots are essentially absent in the reddest bands, which instead trace the underlying old stellar population of the galaxy. |
| In the text | |
|
Fig. 11. Color composite of the J-PLUS tile 4951. Several astrophysical objects analyzed in the present paper are labeled in the figure: four MW stars of different spectral types (A0, G2, K3, and M2); one white dwarf, a minor body of the solar system, four galaxies belonging to a z = 0.068 nearby cluster (Gal1, Gal2, Gal3, and Gal4), and two high-z quasars (QSOs). |
| In the text | |
|
Fig. 12. J-PLUS photospectra of the four stars marked in Fig. 11. The gray lines show the SDSS spectra of these stars. |
| In the text | |
|
Fig. 13. J-PLUS photospectrum of a confirmed ultracool dwarf in the EDR footprint. J-PLUS measurements (colored symbols) are complemented by 2MASS (white triangles) and WISE (white diamonds) data. The (smoothed) best-fit model is provided by the gray line. |
| In the text | |
|
Fig. 14. J-PLUS photospectra of the white dwarf marked in Fig. 11. The gray lines show the BOSS spectra of this object. |
| In the text | |
|
Fig. 15. J-PLUS photospectra of the PNe H 4-1 (left panel) and PNG 135.9+55.9 (right panel). The strong Hα emission is easily perceptible in the two panels. |
| In the text | |
|
Fig. 17. Typical distribution of J-PLUS galaxies in the plane defined by mean effective surface brightness ⟨μe, r⟩ and apparent magnitude, both in the r band. The galaxy subsample illustrated in this plot consists of more than 28 000 objects with a galaxy probability >0.99, taken from eight representative DR1 tiles for which 1.05 < FWHM < 1.15, and the 5σ limiting magnitude is r ∼ 21.5. |
| In the text | |
|
Fig. 16. J-PLUS photospectrum of the four galaxies marked in Fig. 11. The SDSS spectra, scaled to match the r-band total magnitude from J-PLUS, are presented in gray. |
| In the text | |
|
Fig. 18. J-PLUS photometric redshifts vs. SDSS spectroscopic redshifts for the sources in common with the J-PLUS DR1. The side panels show the projection in redshift space of the photometric (right panel) and spectroscopic (top panel) values. Photometric redshifts were computed using BPZ2. |
| In the text | |
|
Fig. 19. Characterization of the J-PLUS photometric redshifts derived from BPZ2 for the J-PLUS DR1 galaxies in comparison with SDSS spectroscopic redshifts. Upper panel: total number of objects in each magnitude bin (black) and their corresponding percentages (red) used in the comparison for the whole sample and for two cuts in the odd parameter, as indicated in the label. Lower panel: bias (black), the scatter measured by the normalized median absolute deviation (nmad; blue) as described in Hoaglin et al. (1983), and the percentage of outliers (red) for the J-PLUS photometric redshifts as a function of magnitude. |
| In the text | |
|
Fig. 20. One of the J-PLUS SVD pointings, including M101 and several NGC galaxies, two of which are indicated in white boxes as they are discussed in this paper. |
| In the text | |
|
Fig. 21. NGC5486 as seen in the J-PLUS J0660 − r image (left panel). The panel shows a 53.3 arcmin2 area. The red dot marks the position of an HII region observed spectroscopically by SDSS. The J-PLUS photospectrum and the SDSS spectrum of this region are shown in the right panel. The data sets are normalized to have the same r-band magnitude. The J0660 and J0378 fluxes are raised because of the Hα and [O II] nebular emission. |
| In the text | |
|
Fig. 22. Bright end of the LAE LF accessible by J-PLUS. The gray shaded areas in both panels show the region of the LF that can be probed with the J-PLUS area and flux depth (dark gray for a Schechter-like LF, light gray for a power-law LF). The horizontal dotted/dashed lines represent the lowest possible value of the LF achievable with the J-PLUS EDR/full survey. The black vertical dashed line shows the limiting luminosity of J-PLUS at redshifts 2.2 (top panel) and 4.4 (bottom panel). The vertical red dashed line shows the luminosity of CR7 at z = 6.604 (Sobral et al. 2015) for illustration. Green circles in the top panel show the Lyα LF from Sobral et al. (2017). Blue and red circles correspond to the UDS+COSMOS and SA22 samples from Matthee et al. (2015). The solid blue and dashed lines correspond to Schechter and power-law fits to the data, respectively. |
| In the text | |
|
Fig. 23. J-PLUS photospectrum of two QSOs with SDSS spectra (marked in Fig. 11), located at α = 110.11167, δ = 40.23105, z = 2.2371 (top panel), and α = 110.22740, δ = 40.14428, z = 2.2894 (bottom panel). The Lyα broad-line emission is clear in both sources and is captured by the J0410 filter, showing a relative excess with respect to the continuum traced by both broad bands and rightmost narrow-band filters. |
| In the text | |
|
Fig. 24. Twelve J-PLUS band images of the minor body marked in Fig. 11. The observing sequence spans 39.4 min, starting with the i band and ending with the z band. |
| In the text | |
|
Fig. 25. Reflectance spectrum of the hydrated asteroid (1024) Hale obtained from J-PLUS observations, together with two sets of reflectance spectra from SDSS observations (Ivezić et al. 2001; Carvano et al. 2010) and another obtained with low-dispersion spectroscopy (Bus & Binzel 2002). All spectra are normalized at the r band. The J-PLUS observations were made during normal survey operation on 2017-01-07, while the asteroid had V = 15.2 mag. The solar colors used to obtain the J-PLUS reflectance spectrum were calculated using a reference solar spectrum from Chance & Kurucz (2010). The resulting error bars are smaller than the size of the points in the figure. |
| In the text | |
|
Fig. 26. J-PLUS photospectrum of the cataclysmic variable J0743+4106. The blue side of the spectrum is dominated by the WD emission, while the red side is dominated by the secondary star. The J0660 filter shows the prominent Hα emission of the disk. For comparison, the spectrum from SDSS DR12 is shown in gray (but multiplied by a factor 0.012 to match the bluest filters). This spectrum was clearly obtained during a high mass-accretion phase, while the J-PLUS photometry was obtained during a low mass-accretion phase. |
| In the text | |
|
Fig. 27. J-PLUS photospectrum of the RR Lyrae star of type RRc (α = 123.6246 deg, δ = 31.188 deg). The gray line shows the SDSS spectrum of this star. The J-PLUS photospectrum and the SDSS spectrum were acquired at different pulsation phases ϕ, as labeled in the panel, with ϕ = 0, 1 corresponding to the maximum flux of the source (i.e., the entire period is covered by the ϕ range of values ϕ ∈ [0, 1). The SDSS spectrum was taken not far from its maximum brightness. |
| In the text | |
Current usage metrics show cumulative count of Article Views (full-text article views including HTML views, PDF and ePub downloads, according to the available data) and Abstracts Views on Vision4Press platform.
Data correspond to usage on the plateform after 2015. The current usage metrics is available 48-96 hours after online publication and is updated daily on week days.
Initial download of the metrics may take a while.