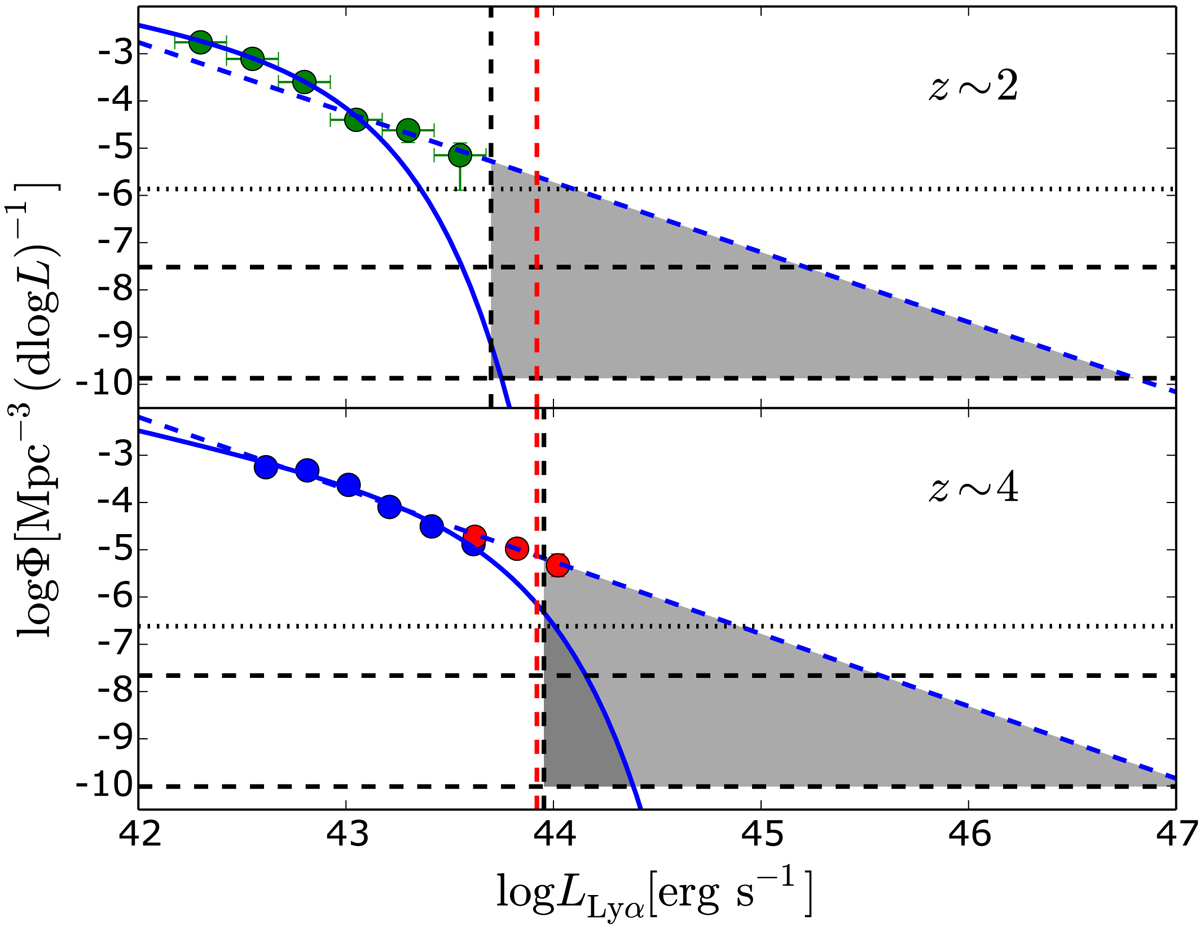
Fig. 22.

Bright end of the LAE LF accessible by J-PLUS. The gray shaded areas in both panels show the region of the LF that can be probed with the J-PLUS area and flux depth (dark gray for a Schechter-like LF, light gray for a power-law LF). The horizontal dotted/dashed lines represent the lowest possible value of the LF achievable with the J-PLUS EDR/full survey. The black vertical dashed line shows the limiting luminosity of J-PLUS at redshifts 2.2 (top panel) and 4.4 (bottom panel). The vertical red dashed line shows the luminosity of CR7 at z = 6.604 (Sobral et al. 2015) for illustration. Green circles in the top panel show the Lyα LF from Sobral et al. (2017). Blue and red circles correspond to the UDS+COSMOS and SA22 samples from Matthee et al. (2015). The solid blue and dashed lines correspond to Schechter and power-law fits to the data, respectively.
Current usage metrics show cumulative count of Article Views (full-text article views including HTML views, PDF and ePub downloads, according to the available data) and Abstracts Views on Vision4Press platform.
Data correspond to usage on the plateform after 2015. The current usage metrics is available 48-96 hours after online publication and is updated daily on week days.
Initial download of the metrics may take a while.


