Fig. 6.
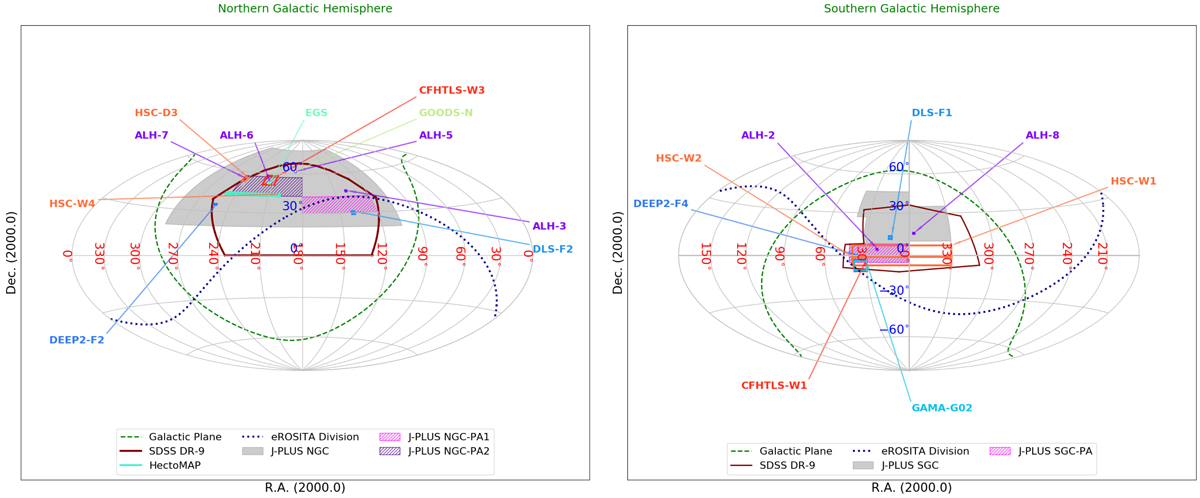
J-PLUS footprint. It is split into two main contiguous areas, indicated in gray, in the Northern and Southern Galactic hemispheres (left and right panels, respectively). The Galactic plane, shown as the green dashed line, is avoided as part of the J-PLUS strategy. The three priority areas of the J-PLUS footprint, NGC-PA1, NGC-PA2, and SGC-PA, are indicated in different colors as given in the labels, together with the footprints or fields from other surveys that entirely or partially match the J-PLUS sky coverage: e.g., Alhambra (ALH; http://www.alhambrasurvey.com; Moles et al. 2008), the Canada-France-Hawaii Telescope Legacy Survey (CFHTLS; http://www.cfht.hawaii.edu/Science/CFHTLS/; e.g., Cuillandre et al. 2012), the Galaxy and Mass Assembly (GAMA; http://www.gama-survey.org), the DEEP2 redshift survey (DEEP2; http://deep.ps.uci.edu/), the Deep Lens Survey (DLS; http://matilda.physics.ucdavis.edu/working/website/techinfo.html), the Extended Groth Strip (EGS; http://aegis.ucolick.org/tech_overview.html), the Great Observatories Origins Deep Survey (GOODS; http://www.stsci.edu/science/goods/), the Hyper Suprime-Cam Subaru Strategic Program (HSC; http://hsc.mtk.nao.ac.jp/ssp/), and the SDSS Legacy Survey (SDSS; https://classic.sdss.org/legacy/index.html). The J-PLUS footprint is fully included in the footprint of the Pan-STARRS 3π survey (Tonry et al. 2012), which observed the whole sky for Dec > −30 deg.
Current usage metrics show cumulative count of Article Views (full-text article views including HTML views, PDF and ePub downloads, according to the available data) and Abstracts Views on Vision4Press platform.
Data correspond to usage on the plateform after 2015. The current usage metrics is available 48-96 hours after online publication and is updated daily on week days.
Initial download of the metrics may take a while.