Fig. 17.
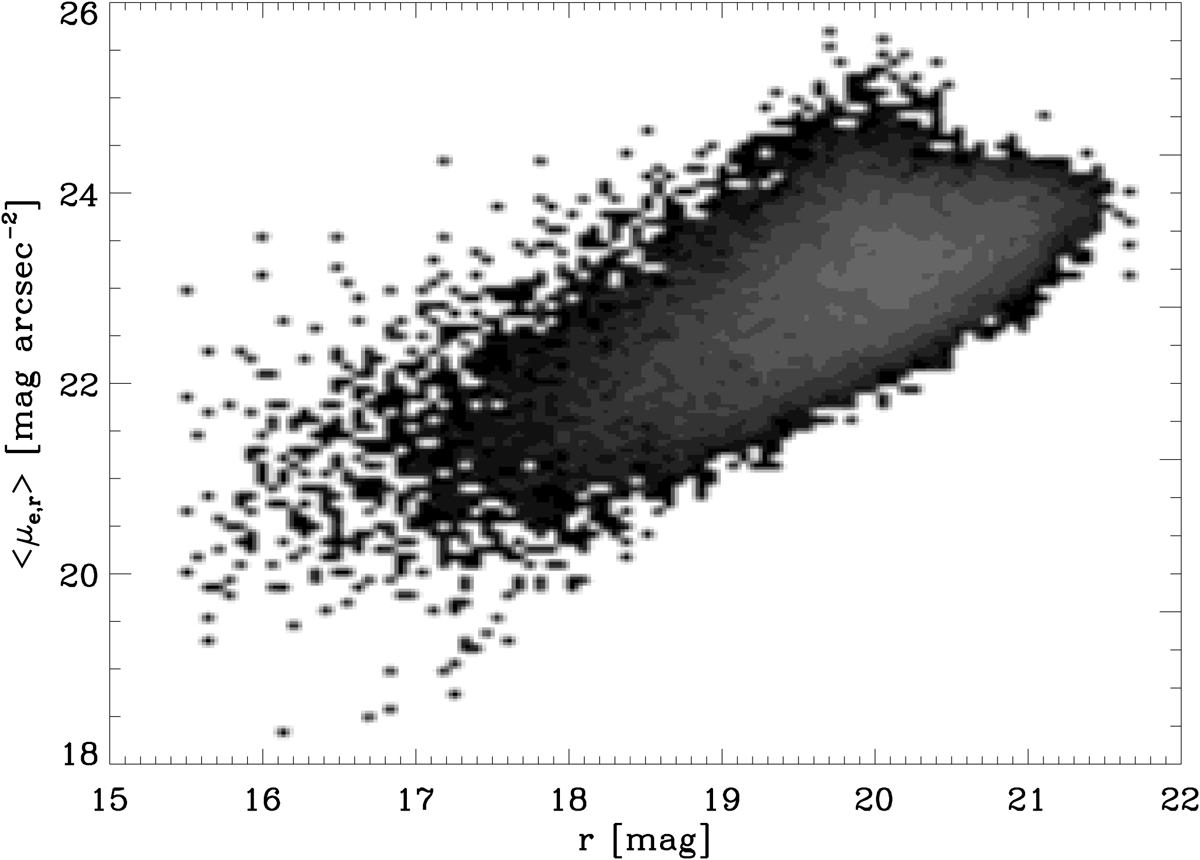
Typical distribution of J-PLUS galaxies in the plane defined by mean effective surface brightness ⟨μe, r⟩ and apparent magnitude, both in the r band. The galaxy subsample illustrated in this plot consists of more than 28 000 objects with a galaxy probability >0.99, taken from eight representative DR1 tiles for which 1.05 < FWHM < 1.15, and the 5σ limiting magnitude is r ∼ 21.5.
Current usage metrics show cumulative count of Article Views (full-text article views including HTML views, PDF and ePub downloads, according to the available data) and Abstracts Views on Vision4Press platform.
Data correspond to usage on the plateform after 2015. The current usage metrics is available 48-96 hours after online publication and is updated daily on week days.
Initial download of the metrics may take a while.