Fig. 9.
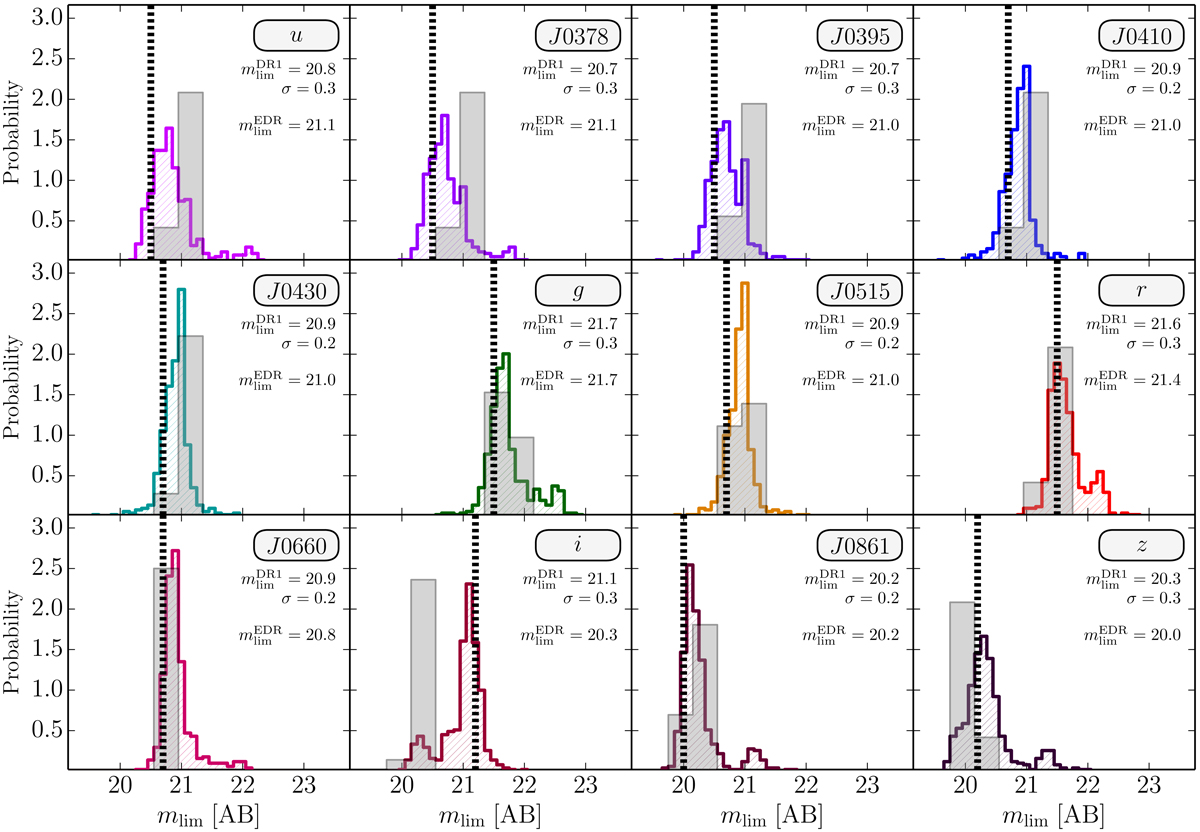
Normalized distribution of the limiting magnitudes (5σ, 3 arcsec aperture) of the J-PLUS DR1 (511 tiles, colored hatched histograms) and the EDR (18 tiles, gray histograms). The black dashed vertical lines mark the targeted J-PLUS limiting magnitudes as reported in Table 4. The legend in the panels provides the median of the limiting magnitudes in the two data releases, as well as the rms of the distribution for the DR1.
Current usage metrics show cumulative count of Article Views (full-text article views including HTML views, PDF and ePub downloads, according to the available data) and Abstracts Views on Vision4Press platform.
Data correspond to usage on the plateform after 2015. The current usage metrics is available 48-96 hours after online publication and is updated daily on week days.
Initial download of the metrics may take a while.