Fig. 21.
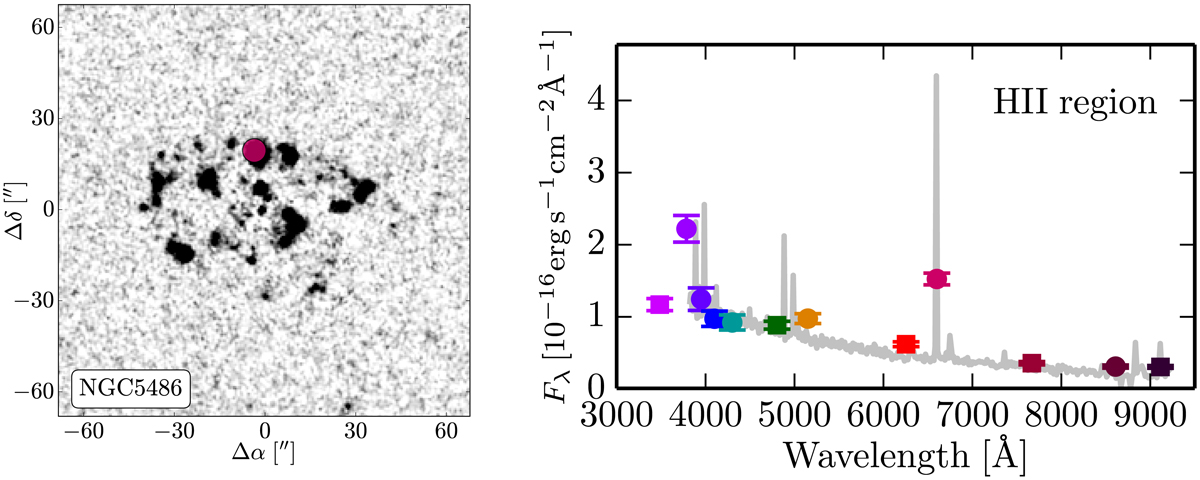
NGC5486 as seen in the J-PLUS J0660 − r image (left panel). The panel shows a 53.3 arcmin2 area. The red dot marks the position of an HII region observed spectroscopically by SDSS. The J-PLUS photospectrum and the SDSS spectrum of this region are shown in the right panel. The data sets are normalized to have the same r-band magnitude. The J0660 and J0378 fluxes are raised because of the Hα and [O II] nebular emission.
Current usage metrics show cumulative count of Article Views (full-text article views including HTML views, PDF and ePub downloads, according to the available data) and Abstracts Views on Vision4Press platform.
Data correspond to usage on the plateform after 2015. The current usage metrics is available 48-96 hours after online publication and is updated daily on week days.
Initial download of the metrics may take a while.