Fig. 19.
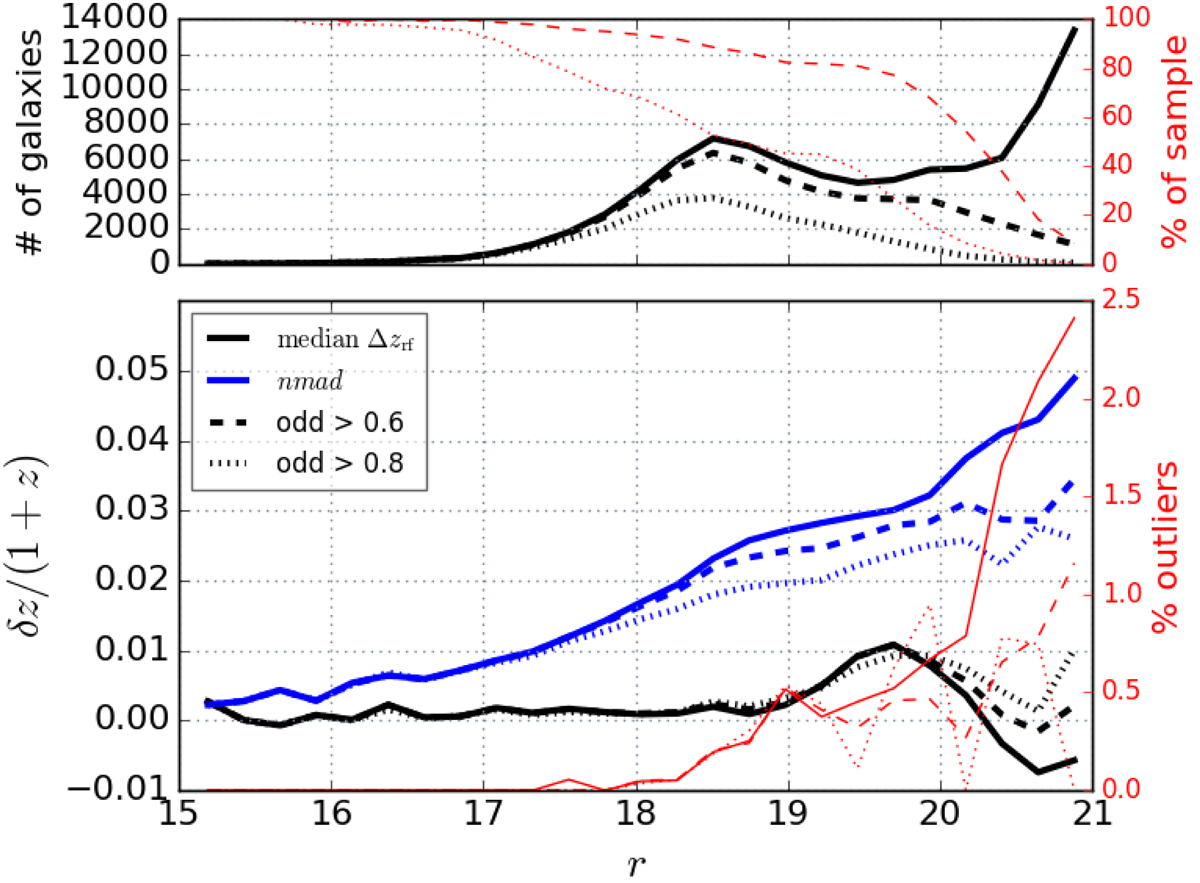
Characterization of the J-PLUS photometric redshifts derived from BPZ2 for the J-PLUS DR1 galaxies in comparison with SDSS spectroscopic redshifts. Upper panel: total number of objects in each magnitude bin (black) and their corresponding percentages (red) used in the comparison for the whole sample and for two cuts in the odd parameter, as indicated in the label. Lower panel: bias (black), the scatter measured by the normalized median absolute deviation (nmad; blue) as described in Hoaglin et al. (1983), and the percentage of outliers (red) for the J-PLUS photometric redshifts as a function of magnitude.
Current usage metrics show cumulative count of Article Views (full-text article views including HTML views, PDF and ePub downloads, according to the available data) and Abstracts Views on Vision4Press platform.
Data correspond to usage on the plateform after 2015. The current usage metrics is available 48-96 hours after online publication and is updated daily on week days.
Initial download of the metrics may take a while.