| Issue |
A&A
Volume 616, August 2018
|
|
|---|---|---|
| Article Number | A118 | |
| Number of page(s) | 29 | |
| Section | Catalogs and data | |
| DOI | https://doi.org/10.1051/0004-6361/201832737 | |
| Published online | 28 August 2018 | |
New database for a sample of optically bright lensed quasars in the northern hemisphere★
1
Departamento de Física Moderna, Universidad de Cantabria (UC),
Avda. de Los Castros s/n,
39005
Santander, Spain
e-mail: r.gilmerino@gmail.com; goicol@unican.es; vshal@ukr.net
2
Institute for Radiophysics and Electronics, National Academy of Sciences of Ukraine,
12 Proskura St.,
61085
Kharkov, Ukraine
3
Instituto de Astrofísica de Canarias (IAC),
c/ Vía Láctea s/n,
38205
La Laguna, Spain
4
Departamento de Astrofísica, Universidad de La Laguna,
38200
La Laguna, Spain
Received:
31
January
2018
Accepted:
17
May
2018
In the framework of the Gravitational LENses and DArk MAtter (GLENDAMA) project, we present a database of nine gravitationally lensed quasars (GLQs) that have two or four images brighter than r = 20 mag and are located in the northern hemisphere. This new database consists of a rich variety of follow-up observations included in the GLENDAMA global archive, which is publicly available online and contains 6557 processed astronomical frames of the nine lens systems over the period 1999−2016. In addition to the GLQs, our archive also incorporates binary quasars, accretion-dominated radio-loud quasars, and other objects, where about 50% of the non-GLQs were observed as part of a campaign to identify GLQ candidates. Most observations of GLQs correspond to an ongoing long-term macro-programme with 2−10 m telescopes at the Roque de los Muchachos Observatory, and these data provide information on the distribution of dark matter at all scales. We outline some previous results from the database, and we additionally obtain new results for several GLQs that update the potential of the tool for astrophysical studies.
Key words: astronomical databases: miscellaneous / gravitational lensing: strong / gravitational lensing: micro / galaxies: general / quasars: general / cosmological parameters
Tables 4–6, 8–11, and 13–16 (lightcurves and spectra) are only available at the CDS via anonymous ftp to cdsarc.u-strasbg.fr (130.79.128.5) or via http://cdsarc.u-strasbg.fr/viz-bin/qcat?J/A+A/616/A118
© ESO 2018
1 Introduction
A quasar is a distant active galactic nucleus (AGN) of high luminosity powered by accretion into a super-massive black hole (e.g. Rees 1984). The UV thermal emission is generated by hot gas orbiting the central black hole: the continuum comes from tiny sources and shows variability over several timescales, while broad emission lines are produced in regions around the continuum sources (e.g. Peterson 1997; Krolik 1999). Only rarely is the same quasar seen at different positions on the sky. These positions are close together, and they are located around a massive galaxy acting as a lens. The gravitational field of the foreground galaxy bends the light from the background quasar and often produces two or four images of the distant AGN. Although a gravitationally lensed quasar (GLQ) is a rare phenomenon, observations of GLQs provide very valuable information about the structure of accretion flows, the distribution of mass in lensing galaxies, and the physical properties of the Universe as a whole (e.g. Schneider et al. 1992, 2006).
A significant part of the UV emission of quasars at redshift z > 1 is observed at optical wavelengths, and thus optical photometric monitoring of GLQs revealed a wide diversity of intrinsic flux variations. These variations were used, among other things, to determine accurate time delays between quasar images, which in turn led to constraints on the Hubble constant and the dark components of the Universe (e.g. Oguri 2007; Sereno & Paraficz 2014; Wei et al. 2014; Rathna Kumar et al. 2015; Yuan & Wang 2015; Pan et al. 2016; Bonvin et al. 2017), as well as on lensing mass distributions (e.g. Goicoechea & Shalyapin 2010). Stars in lensing galaxies are also responsible for microlensing effects in optical light curves and spectra of GLQs, and the observed extrinsic variations and spectral distortions constrained the size of continuum and broad-line sources, the structure of emitting regions, the mass of super-massive black holes, and the composition of intervening galaxies (e.g. Shalyapin et al. 2002; Kochanek 2004; Richards et al. 2004; Morgan et al. 2008; Sluse et al. 2012; Guerras et al. 2013; Motta et al. 2017). Deep imaging and spectroscopy of GLQs are also key tools to discuss the distribution of mass, dust, and gas in lensing objects (e.g. Schneider et al. 2006). In addition, optical polarimetry may help to better understand the physical scenarios (e.g. Wills et al. 1980; Chae et al. 2001; Hutsemékers et al. 2010).
Since 1998, the Gravitational LENses and DArk MAtter (GLENDAMA) project is planning, conducting, and analysing (mainly) optical observations of GLQs and related objects. In the first decade of the current century, the advent of a robotic 2 m telescope (Steele et al. 2004) to the Roque de los Muchachos Observatory (RMO) represented a revolution on the observational side of GLQs. A main advantage is the possibility of a rapid reaction in observations scheduling with a variety of available instruments. Along with the installation of the robotic telescope, the start of the scientific operational phase of a 10 m telescope (Alvarez et al. 2006) paved the way to ambitious gravitational lensing programmes at the RMO. We thus focused on the construction of a comprehensive database for a sample of ten GLQs with bright images (r < 20 mag) at 1 <z < 3. The selectedlens systems have different morphologies and angular separations between their images. In this paper, we introduce the current version of the database, including ready-to-use (processed) frames of nine targets. This astronomical material has been collected over 17 yr, using facilities at the RMO, the Teide Observatory (TO), and space observatories (Swift and Chandra monitoring campaigns of the first lensed quasar; Gil-Merino et al. 2012). Our tenth and last target has been discovered in 2017 (PS J0147+4630; Berghea et al. 2017; Lee 2017; Rubin et al. 2018), and we are starting to observe this GLQ, in which three out of its four images are arranged in an arc-like configuration. We wish to perform an accurate follow-up of each target over 10−30 yr, since observations on 10- to 30-yr timescales are crucial to detect significant microlensing effects in practically all objects in the sample (Mosquera & Kochanek 2011).
In addition to thousands of astronomical frames in a well-structured datastore that is publicly available online, the website of the GLENDAMA project offers high-level data products (light curves, calibrated spectra, polarisation measures, etc). We remark that the GLENDAMA observing programme does not only focus on imaging lens systems andlight curves construction. The robotic telescope allows us to follow up the spectroscopic and polarimetricactivity of some targets, and additionally, we obtain deep near-infrared (NIR) imaging with several 2−4 m telescopes. Here, we present new results for six of the nine targets. Results for the other three lens systems have been published very recently. Despite of the existence of high-resolution spectra of some images of GLQs in the Sloan Digital Sky Survey (SDSS) database (the SDSS spectroscopic database includes observations of the Baryon Oscillation Spectroscopic Survey − BOSS; Smee et al. 2013), we also conduct a programme with the very large telescope at the RMO to acquire spectra of unprecedented signal quality (e.g. Goicoechea & Shalyapin 2016; Shalyapin & Goicoechea 2017).
The paper is organised as follows: in Sect. 2, we present an overview of the global archive and then describe the GLQ observations in detail. In Sect. 3, we review relevant intermediate results and discuss their astrophysical impact. New light curves, polarisations, and spectra at optical wavelengths (and deep NIR imaging of QSO B0957+561) are also presented and placed into perspective in Sect. 3. The summary and future prospects appear in Sect. 4.
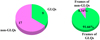 |
Fig. 1 Distribution of targets and frames in the GLENDAMA archive. |
2 GLQ database in the GLENDAMA archive
2.1 Overview of the archive
The global archive consists of a datastore of 40 GB in size, whose content is organised and visualised by using MySQL/PHP/ JavaScript/HTML5 software1. A web user interface2 (WUI) allows users to surf the archive, see all its content, and freely download any dataset. This interface is a three-step tool, where the first step is to select an object and then click the submit button to see the datasets available for the selected target. In this second screen, it is possible to select a dataset and press the retrieve button to view its details (telescope, instrument, file names, observation dates, exposure times, etc). In the third step of the WUI, the user can download the frames of interest3. The GLENDAMA datastore incorporates more than 7000 ready-to-use astronomical frames of 26 targets falling into two classes: GLQs, and non-GLQs (binary quasars, accretion-dominated radio-loud quasars, and others). In spite of this, our observational effort was mainly concentrated on the construction of a GLQ database (see Fig. 1). The full sample of GLQs and the bulk of data are described in detail in Sect. 2.2.
The datastore includes many frames of non-GLQs. There are optical frames of four accretion-dominated radio-loud quasars in the sample of Landt et al. (2008): RX J0254.6+3931, RX J2256.5+2618, RX J2318.5+3048, and 1WGA J2347.6+0852. Deep NIR imaging, optical spectroscopy, and a short-term r-band monitoring of the binary quasar SDSS J1116+4118 (Hennawi et al. 2006, 2010) are also available. This target and another two binary systems, 1WGA J1334.7+3757 and QSO B2354+1840 (Borra et al. 1996; McHardy et al. 1998; Zhdanov & Surdej 2001), were observed to discuss the physical scenario for widely separated pairs of quasars at similar redshift. In addition, we observed several systems that initially were selected as double-image quasar candidates through searches in the SDSS-III data releases (Ahn et al. 2012, 2014; Paris et al. 2012, 2014): SDSS J0240−0208 (quasar-quasar pair), SDSS J0734+2733 (quasar-? pair)4, SDSS J0735+2036 (quasar-star pair), SDSS J0755+1400 (quasar-? pair)4, SDSS J1617+3827 (GLQ?)5, SDSS J1642+3200 (quasar-AGN pair), SDSS J1655+1948 (quasar-star pair), and SDSS J2153+2732 (binary quasar). PS1 J2241+4734(star-galaxy pair) and M87 also belong to the non-GLQ class. This last object is a well-known radio galaxy whose optical images can be used to analyse the isophotes and the jet emerging from its active nucleus.
The GLENDAMA database covers the period 1999−2016 (it was updated on 1 October 2016), and we have used many telescopes and a varied instrumentation throughout the past 17 yr. In addition to an X-ray monitoring campaign of a lensed quasar in 2010 (see Sect. 2.2), the archive incorporatesframes (imaging, polarimetry, and spectroscopy) that were taken with facilities operating in the near-ultraviolet (NUV)-visible-NIR spectral region. Such facilities and some additional details (filters, grisms, gratings, etc) are given in Table 1. Users can also access information about air mass and seeing values (when available in file headers). Seeing values are not equally accurate through all the observations: for some instruments (e.g. RATCam, IO:O, RINGO2, and RINGO3), the full-width at half-maximum (FWHM) of the seeing disc is directly estimated from frames, and thus is a reliable reference. However, FWHM values in FRODOSpec and SPRAT files are estimated before spectroscopic exposures, so these foreseen values may appreciably differ from true values. For spectroscopic observations, we offer frames of the science target and a calibration star. These files for the main target and the star have labels including the expressions “obj” and “std”, respectively.
NUV-visible-NIR facilities.
2.2 Sample of GLQs
We focused on nine GLQs in the northern hemisphere (see Table 2). Every GLQ in our sample has two or four images with r < 20 mag. The source redshifts vary between 1.24 and 2.57 (⟨z⟩~ 1.9), and the sample includes five relatively compact systems and four wide separation double quasars. These last GLQs have two images separated by Δθ ≥ 2′′. Over the first ten years of our follow-up observations (1999−2008), the target selections were based on the GLQs known in 1999. From 2009 on, we have also studied SDSS GLQs. Thus, we try to achieve a deeper knowledge of some classical targets, such as QSO B0909+532, FBQS J0951+2635, QSO B0957+561, QSO B1413+117, and QSO B2237+0305, and simultaneously, characterise other recently discovered systems (see Tables 2 and 3). We have also been involved in a search for new double quasars in the SDSS-III database with the purpose of “going the whole way”: discovery, and subsequent characterisation (Sergeyev et al. 2016). After selecting three superb candidates through Maidanak Astronomical Observatory (MAO) deep imaging under good seeing conditions (i.e. quasar-companion pairs showing evidence for the existence of a near lensing galaxy, as well as parallel flux variations on a long timescale), Sergeyev et al. (2016) corfirmed the GLQ nature of SDSS J1442+4055 (see also More et al. 2016). This object is being intensively observed to unveil its physical properties. Follow-up observations of the second superb candidate (SDSS J1617+3827) also led to the discovery of a faint double quasar (Shalyapin et al., in prep.). However, in this paper, the newly discovered GLQ is treated as an unconfirmed GLQ and incorporated into the non-GLQ class (see Sect. 2.1). The third superb candidate (SDSS J1642+3200) turned out to be a system consisting of a quasar and a different AGN.
After normal LT and GTC science operations at the RMO, most GLQ observations were carried out with these two telescopes. In a parallel effort, processing tools for some LT instruments (photometric pipelines for CCD imagers and specific software for FRODOSpec) and LT-GTC science products (several light curves and calibrated spectra) were made available to the community. However, the full set of NUV-visible-NIR frames of GLQs comes from a variety of observing programmes with the GTC, IAC80, INT, LT, NOT, TNG, and UVOT (see Table 3). In 2010, we also performed space-based observations of QSO B0957+561 with the Chandra X-ray Observatory6. In this X-ray (0.1−10 keV) monitoring campaign, we used the Advanced CCD Imaging Spectrometer-S3 chip. The GLQ database consists of a total of 6557 processed frames, which are not homogeneously distributed among the nine objects (see Fig. 2) for different reasons. For example, we used the first lensed quasar as a pilot target to check the performance of the majority of the instruments involved in the project, and therefore 50% of the GLQ frames correspond to QSO B0957+561. In general, dates of discovery, scientific aims, technical constraints, opportunities arising at some time periods, and decisions of time allocation committees are key factors to explain the pie chart in Fig. 2. Unfortunately, the EOCA monitoring campaign of QSO B0909+532 (Ullán et al. 2006), QuOC-Around-The-Clock observations of QSO B0957+561 (Colley et al. 2003) and the GLITP optical monitoring of QSO B2237+0305 (Alcalde et al. 2002) could not be assembled in our disc-based storage for technical reasons.
All frames in Table 3 are ready to use because they were processed with standard techniques (sometimes as part of specific pipelines) or more sophisticated reduction procedures. For example, the LT website (see notes to Table 1) presents pipelines for RATCam, IO:O, FRODOSpec, SPRAT, RINGO2, and RINGO3, which contain basic instrumental reductions. We offer outputs from the LT pipelines for RATCam, IO:O, RINGO2, and RINGO3 without any extra processing. Thus, potential users should carefully consider whether supplementary tasks are required, for instance, cosmic ray cleaning, bad pixel mask, or defringing. We do not offer outputs from the standard L2 pipeline for the 2D spectrograph FRODOSpec (12 × 12 square lenslets bonded to 144 optical fibres), but multi-extension FITS files, each consisting of four extensions: [1] ≡ [L1] (output from the CCD processing pipeline L1, which performs bias subtraction, overscan trimming, and CCD flat fielding), [2] ≡ [RSS] (144 row-stacked wavelength-calibrated spectra from the non-standard L2LENS software7), [3] ≡ [CUBE] (spectral data cube giving the 2D flux in the 12 × 12 spatial array at each wavelength pixel), and [4] ≡ [COLCUBE] (datacube collapsed over its entire wavelength range). The main differences between the standard L2pipeline (Barnsley et al. 2012) and the L2LENS reduction tool are described in Shalyapin & Goicoechea (2014b). We remark that the LT is a unique facility for photometric, polarimetric, and spectroscopic monitoring campaigns of GLQs. However, taking into account the spatial resolution (pixel size of ~0.′′4−0.′′5) of RINGO2, RINGO3, and SPRAT, we are currently tracking the evolution of broad-band fluxes for almost all systems, whereas we are only obtaining spectroscopic and/or polarimetric data of the wide separation double quasars: QSO B0957+561 (LSS & POL), SDSS J1001+5027 (LSS), SDSS J1442+4055 (LSS), and SDSS J1515+1511 (LSS).
The long-slit spectroscopy (SPRAT, OSIRIS, ALFOSC, and IDS) was processed using standard methods of bias subtraction, trimming, flat-fielding, cosmic-ray rejection, sky subtraction, and wavelength calibration. The reduction steps of the StanCam frames included bias subtraction and flat-fielding using sky flats, while the combined frames for deep-imaging observations with ALFOSC were obtained in a standard way. We also applied standard reduction procedures to the IAC80 original data, although only the final V R datasets contain WCS information in the FITS headers. These most relevant data were also corrected for cosmic-ray hits on the CCD. The NICS frames were processed with the SNAP software8, and different types of instrumental reductions are applied to Swift and Chandra observations before data are made available to users. These space-based observatories perform specific processing tasks that are outlined in dedicated websites.
Objects in the GLQ database.
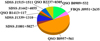 |
Fig. 2 Distribution of GLQ frames. |
GLQ frames in the NUV-visible-NIR spectral region.
3 Results from the GLQ database
3.1 Previous results
Through frames in the database, as well as through those that could not be incorporated into the datastore for technical reasons (see Sect. 2.2), we obtained light curves and spectra that led to many astrophysical outcomes. Most of these are grouped into Sects. 3.1.1–3.1.4.
3.1.1 Quasar accretion flows
The RATCam/r light curves of QSO B0909+532 in 2005−2006 indicated that symmetric triangular flares in an accretion disc (AD) is the best scenario (of those tested by us) to account for the variability of the MUV (~2600 Å) continuum emission from the quasar (Goicoechea et al. 2008). In addition, combining RATCam/gr and United States Naval Observatory (USNO)/r data of QSO B0909+532 over the period 2005−2012, Hainline et al. (2013) found prominent microlensing events and constrained the size of the MUV continuum source in the AD, deriving a typical half-light radius of r1∕2 ~ 20−50 Schwarzschild radii9. Regarding QSO B0957+561, old IAC80/R data, the RATCam/r brightness records spanning 2005−2007, and the USNO/r dataset in 2008−2011 were used by Hainline et al. (2012) to detect a microlensing event and measure the size of the continuum source emitting at ~2600 Å (see, however, Shalyapin et al. 2012). Their 1σ interval for the size (r1∕2) of this MUVsource was 1016−1017 cm (inclination of 60°). There is also strong evidence supporting the presence of a centrally irradiated AD in the heart of QSO B0957+561. A Chandra-UVOT-LT monitoring campaign from late 2009 to mid-2010 suggested that a central EUV source drives the variability of the first GLQ, so EUV flares originated in the immediate vicinity of the black hole are thermally reprocessed in the AD at 20−30 Schwarzschild radii from the dark object10 (Gil-Merino et al. 2012; Goicoechea et al. 2012). Interpreting the reverberation-based size of the 2600 Å source as a flux-weighted emitting radius (e.g. Fausnaugh et al. 2016), we obtained r1∕2 = (1.1 ± 0.2) × 1016 cm (1σ interval), and thus the source size from the microlensing analysis of Hainline et al. (2012) is marginally consistent with this measurement. Our accurate value of r1∕2 is in good agreement with the overlapping region between the Hainline et al. interval and the microlensing-based constraint obtained by Refsdal et al. (2000).
RATCam-IO:O light curves and OSIRIS spectra of SDSS J1339+1310 indicated that this system is likely the main microlensing factory discovered so far (Shalyapin & Goicoechea 2014a; Goicoechea & Shalyapin 2016). Thus, data of SDSS J1339+1310are very promising tools to reveal fine details of the structure of its accretion flow. In particular, we have shown how microlensing magnification ratios of the continuum can be used to check the structure of the AD, and we have reported some physical properties of broad line emitting regions: the Fe III region is more compact than the Fe II region, while the C IV region has an anisotropic structure and a size probably not much larger than the AD. There is also clear evidence that high-ionisation regions have smaller sizes than low-ionisation regions. This was found using high-ionisation emission lines in OSIRIS spectra of SDSS J1339+1310 (Si IV/O IV and C IV; Goicoechea & Shalyapin 2016) and SDSS J1515+1511 (C IV and He II; Shalyapin & Goicoechea 2017), in good agreement with the results in Guerras et al. (2013) from a sample of 16 GLQs. We also showed that the GLITP light curve of a microlensing high-magnification event in the A image of QSO B2237+0305 (Alcalde et al. 2002), alone or in conjunction with data from the OGLE collaboration (Woźniak et al. 2000), can be used to prove the structure of the inner accretion flow in the distant quasar (Shalyapin et al. 2002; Goicoechea et al. 2003; Gil-Merino et al. 2006). This accurate microlensing curve (from October 1999 to early February 2000) has been discussed by several other groups (e.g. Kochanek 2004; Bogdanov & Cherepashchuk 2004; Vakulik et al. 2004; Moreau et al. 2005; Udalski et al. 2006; Koptelova et al. 2007; Alexandrov & Zhdanov 2011; Abolmasov & Shakura 2012; Mediavilla et al. 2015).
3.1.2 Lensing mass distributions
Deep I-band imaging (ALFOSC) and spectroscopic (OSIRIS) observations of SDSS J1339+1310 allowed us to reliably reconstruct the mass distribution acting as a strong gravitational lens (Shalyapin & Goicoechea 2014a). Using a singular isothermal ellipsoid (SIE) to model the mass of the main lensing galaxy (e.g. Koopmans et al. 2006), we obtained an offset between light and mass position angles. This misalignment suggests that SDSS J1339+1310 is affected by external shear γ arising from the environment of the main lens (early-type galaxy) at z = 0.61 (e.g. Gavazzi et al. 2012). We then considered an SIE + γ mass model, where the SIE was aligned with the light distribution of the main lens. Although the uncertainty in the SIE mass scale was below 10%, new observational constraints on the macrolens flux ratio and the time delay (e.g. Goicoechea & Shalyapin 2016) must produce a much more accurate SIE + γ solution. A cross-correlation analysis of the RATCam light curves of the four images of QSO B1413+117 yielded three independentdelays, which were also used to improve the lens solution for this system and to estimate the previously unknown lens redshift (Goicoechea & Shalyapin 2010). The mass model consisted of an SIE (main lensing galaxy), a singular isothermal sphere (secondary lensing galaxy), and external shear (MacLeod et al. 2009), and we derived a lens redshift of z = 1.88 (1σ interval; see also Akhunov et al. 2017). Additionally, from OSIRIS spectroscopy of field objects in the external shear direction, we identified an emission line galaxy at z ~ 0.57 that is responsible for <2% of γ~ 0.1 (Shalyapin & Goicoechea 2013).
Very recently, IO:O light curves and OSIRIS-SPRAT spectra of SDSS J1515+1511 have been used to obtain strong constraints on its time delay and its macrolens flux ratio (Shalyapin & Goicoechea 2017). Inada et al. (2014) tentatively associated the main lensing galaxy with an Fe/Mg absorption system at z = 0.74 (intervening gas), therefore we have assumed the existence of intervening dust at this redshift to measure themacrolens flux ratio. Our observational constraints practically did not modify the previous SIE + γ solution (Rusu et al. 2016). Moreover, the redshift of the lensing mass was found to be consistent with z = 0.74, which confirmed the putative value of z for the mainlens (edge-on disc-like galaxy). From the OSIRIS data, we also extracted the spectrum of an object that is ~15′′ away from the quasar images. This early-type galaxy at z = 0.54 may account for <10% of the large external shear (γ ~ 0.3).
3.1.3 Dust and metals in main lensing galaxies
We probed the intervening medium along the lines of sight towards the two images A and B of QSO B0957+561 with great effort. The light rays associated with these images pass through two separate regions within a giant elliptical (lens) galaxy at z = 0.36 (see Table 2). Although there is no evidence of Mg II absorption at z = 0.36 (Young et al. 1981b), we studied the possible presence of dust in the cD galaxy during a long quiescent phase of microlensing activity (e.g. Shalyapin et al. 2012). Using continuum delay-corrected flux ratios B∕A from Hubble Space Telescope (HST) spectra and GLITP/V R photometric data in 1999−2001, we found a chromatic behaviour resembling extinction laws for galaxies in the Local Group (Goicoechea et al. 2005). While the macrolens flux ratio is 0.75 (e.g. Garrett et al. 1994), the continuum ratios were greater than 1, indicating that the A image is more affected by dust. We obtained a differential visual extinction Δ AAB(V) = AB(V) − AA(V) ~ −0.3 mag, which can be interpreted in different ways. For example, the simplest scenario is the presence of a dust cloud in front of the image A, at ~26 kpc from the centre of the cD galaxy. This cloud must be compact enough to produce a negligible extinction over the broad line emitting regions, since emission-line flux ratios agree reasonably well with B∕A ~ 0.75 (e.g. Schild & Smith 1991; Goicoechea et al. 2005).
Time-domain observations of QSO B0957+561 were even more intriguing than those made in the spectral domain. RATCam/gr light curves in 2008−2010 showed well-sampled, sharp intrinsic fluctuations with an unprecedentedly high signal-to-noise ratio. These allowed us to measure very accurate g-band and r-band time delays, which were inconsistent with each other: the r-band delay exceeded the 417-d delay in the g-band by about 3 d (Shalyapin et al. 2012). In two periods of violent activity, we also detected an increase in the continuum flux ratios B∕A, as well as a correlation between B∕A values and flux level of B. This posed the question whether the dust cloud affecting the A image might be responsible for all these time-domain anomalies. Shalyapin et al. (2012) naively suggested that chromatic dispersion (e.g. Born & Wolf 1999) might account for a three-day lag between g-band and r-band signals crossing a dusty region. However, it is hard to reconcile an interband lag of some days with a structure belonging to the giant elliptical galaxy and containing standard dust. In addition, the increase in the flux ratios (diminution of A relative to B) during violent episodes was associated with highly polarised light passing through a dust-rich region with aligned elongated dust grains. This light may suffer from a higher extinction than that of weakly polarised light in periods of normal activity. In Sect. 3.2.3 (Overview), we revise our previous crude interpretation for the chromatic time delay and the continuum flux ratios between the two images of QSO B0957+561.
The main lens in SDSS J1339+1310 is an early-type galaxy at z = 0.61, and SDSS-OSIRIS spectra of both quasar images display Fe II, Mg II, and Mg I absorption lines at the lens redshift. These metals are not uniformly distributed inside the galaxy, since the Mg II absorption is stronger in the A image. From OSIRIS spectra of A and B, we also inferred a typical value Δ AAB(V) = −0.27 mag for the differential visual extinction in the system (Goicoechea & Shalyapin 2016). Hence, we find that A is the most reddened image, supporting the notion that the more metal-rich the gas, the higher the dust content. Inada et al. (2014) also carried out observationsof the A and B images of SDSS J1515+1511 with the DOLORES spectrograph on the TNG. Their data revealed the existence of strong Mg II absorption at the lens redshift in the spectrum of B. This finding was corroborated by our OSIRIS data of the B image, displaying Fe I, Fe II, and Mg II absorption in the edge-on disc-like galaxy at z = 0.74. Such absorption features were not detected in the OSIRIS spectrum of the A image. We consistently obtained that B is affected more by dust extinction than A, and Δ AAB(V) = 0.130 ± 0.013 mag (1σ interval; Shalyapin & Goicoechea 2017). We also note that Elíasdóttir et al. (2006) studied the differential visual extinction in ten lensing galaxies at z ≤ 1, reporting many values ranging from 0.1 to 0.3 mag.
3.1.4 Cosmology
A time delay of a GLQ enables us to measure the current expansion rate of the Universe (the so-called Hubble constant H0), provided the lensing mass distribution and its redshift are reasonably well constrained through additional data (e.g. Jackson 2015). Thus, we obtained accurate time delays (with a mean error of 3−4 d) between the images of 5 GLQs: QSO B0909+532, QSO B0957+561, SDSS J1339+1310, QSO B1413+117, and SDSS J1515+1511 (see Cols. 7 and 8 in Table 2), which can potentially be used to determine H0. Our first time delay estimation of QSO B0909+532 (Ullán et al. 2006) was used by Oguri (2007) and Paraficz & Hjorth (2010) to find H0 values around 66−70 km s−1 Mpc−1 for a flat universe. They performed a simultaneous analysis of 16−18 GLQs, adopting a flat universe model with standard amounts of matter (Ω M) and dark energy (Ω Λ) that satisfy Ω M + ΩΛ = 1. Sereno & Paraficz (2014) confirmed these H0 values using weaker constraints on the matter and dark energy parameters, while Rathna Kumar et al. (2015) also inferred H0 = 68.1 ± 5.9 km s−1 Mpc−1 (Ω M = 0.3, Ω Λ = 0.7) from 10 GLQs with relative astrometry, lens redshift, and time delays sufficiently accurate, as well as with a simple lensing mass. This last study was partially based on the LT delays of QSO B0909+532 and QSO B0957+561. In addition to the determination of H0, our time delays have also been used to discuss different cosmological and gravity models (e.g. Tian et al. 2013; Wei et al. 2014; Yuan & Wang 2015; Pan et al. 2016).
Recently, we have determined the time delay in the two double quasars SDSS J1339+1310 and SDSS J1515+1511(see Table 2), and it is easy to probe the impact of these delays on the estimation of H0 via gravitational lensing. For example, assuming a self-consistent lens redshift z = 0.742 in SDSS J1515+1511, and a flat universe with ΩM = 0.27 and ΩΛ = 0.73, the best-fit value for H0 was 72 km s−1 Mpc−1 (Shalyapin & Goicoechea 2017). Taking an external convergence κext ~ 0.015 (due to a galaxy that is ~15′′ away from the quasar images) and  (e.g. Sereno & Paraficz 2014) into account, the Hubble constant is decreased by ~1.5% until it reaches about 71 km s−1 Mpc−1. Therefore, the time delay of SDSS J1515+1511 leads to H0 values supporting previous estimates from other lens systems. Our delay database has a size and quality similar to those of the COSMOGRAIL collaboration (e.g. Bonvin et al. 2016, and references therein), which is a complex effort involving several 1−2 m telescopes at different sites. The LT monitoring offers a unique opportunity to obtain homogeneous and accurate light curves of GLQs, and thus time delays with an uncertainty of a few days.
3.2 New photometric, polarimetric, and spectroscopic results
In this section, we introduce new results for six objects in the GLQ database. For three objects that have been updated in recent papers, i.e. SDSS J1339+1310, SDSS J1442+4055, and SDSS J1515+1511, we do not include science data derived from frames in the database.
3.2.1 QSO B0909+532
The RATCam photometry in the r-band over the period between January 2005 and June 2011 (198 epochs) has been published in Goicoechea et al. (2008) and Hainline et al. (2013). Here, we present additional r-band photometric data of the two quasar images A and B, which were obtained from RATCam frames in February–April 2012 (18 epochs), as well as using the IO:O camera in the period spanning from October 2012 to June 2016 (128 epochs; see Table 3). This new camera has a 10′ × 10′ field of view and a pixel scale of ~ 0.′′30 (binning 2 × 2), and we set the exposure time to 200 or 150 s. After some initial processing tasks, including cosmic-ray removal and bad pixel masking, a crowded-field photometry pipeline produced magnitudes of A and B for every IO:O frame. Our pipeline relies on IRAF11 packages and the IMFITFITS software (McLeod et al. 1998). As the lensing galaxy is not apparent in optical frames of QSO B0909+532, a simple photometric model can describe the crowded region associated with such GLQ. This model only consists of two close stellar-like sources, where each source is described by an empirical point-spread function (PSF). To perform the PSF fitting of the double quasar, we mostly considered the 2D profile of the “b” field star as the PSF, after removing the local background to clean its distribution of instrumental flux. However, when this bright star was saturated in certain frames, the PSF was derived from the profile of the “c” field star (e.g. Kochanek et al. 1997).
To obtain the IO:O light curves, we removed magnitudes when the signal-to-noise ratio (S/N) of the “c” field star fell below 30. This star has a brightness close to that of the A image, and the S/N was measured through an aperture of radius equal to twice the FWHM of the seeing disc. By visual inspection of the pre-selected brightness records, we then found that the magnitudes of A and B at a few epochs strongly deviate from adjacent data. These outliers were also discarded. The whole selection procedure yielded a rejection rate of about 6% (8 out of 136 epochs). In a last step, assuming the root-mean-square deviations between magnitudes on consecutive nights as errors, the uncertainties were 0.011 and 0.017 mag for A and B. The RATCam-IO:O light curves of A and B covering the period 2005–2016 are available in tabular format at the CDS: Table 4 includes r-SDSS magnitudes and their errors at 344 epochs. Column 1 lists the observing date (MJD−50 000), Cols. 2 and 3 give photometric data for the quasar image A, and Cols. 4 and 5 give photometric data for the quasar image B. Thus, we combined all our r-band measurements in a machine-readable ASCII file, using MJD−50 000 dates instead of JD−24 50 000 ones. Now, in all the GLENDAMA light curves, the origin of the time axis is MJD−50 000. The r-band data collected by us and the USNO group during a 12-yr period are also displayed in the top panel of Fig. 3. The new 146 epochs of magnitudes (after day 5959) lead to new microlensing variability in the difference light curve (DLC; see the middle and bottom panels of Fig. 3). Although this variability has an amplitude of ~0.1 mag, is not as strong as in the previous period between days 4000 and 5400 (see the bottom panel in Fig. 3 of Hainline et al. 2013). The new extrinsic signal might better constrain the size of the continuum source emitting at ~2600 Å (see Sect. 3.1.1).
3.2.2 FBQS J0951+2635
Jakobsson et al. (2005) monitored the double quasar FBQS J0951+2635 soon after its discovery in 1998 (Schechter et al. 1998), measuring a time delay of about 16 d and reporting evidence for microlensing in the period 1999−2001 (see also Paraficz et al. 2006). We also presented R-band light curves of the two images of the GLQ (Shalyapin et al. 2009). These last records (37 epochs), based on Uzbekistan MAO observations between 2001 and 2006, indicated the existence of a long-timescale microlensing fluctuation. The MAO monitoring programme was conducted by an international collaboration of astronomers from Russia, Ukraine, Uzbekistan, and other countries. Here, we analyse new LT photometric observations made during an 8-yr period (2009−2016), which allow us to draw the evolution of the extrinsic variation over this century. Our database contains 72 frames in the r-band, divided into two groups (see Table 3): 29 RATCam frames in 2009−2012 (for each monitoring night, we usually obtained three consecutive 300 s exposures) and 43 IO:O frames in 2013−2016 (typically, two consecutive 250 s exposures per monitoring night). To fill the LT gap in 2010, 3 × 300 s ALFOSC exposures of the lens system were taken with the Bessel R filter on 8 February 2010. We also analyse these frames, which are not included in the database.
The lensing galaxy is too faint to be detected with a red filter, and thus the system was described as two stellar-like objects, that is, two PSFs. The S1 field star was used to estimate the PSF, whereas we considered the S3 field star to check the reliability of the quasar brightness fluctuations (see the finding chart in Fig. 1 of Shalyapin et al. 2009). We used IMFITFITS to obtain PSF-fitting photometry for the two quasar images and the field stars. Most of the LT frames (64 of 72) led to reasonable photometric results, and these usable frames were then combined on a nightly basis to produce r-band magnitudes at 28 epochs. For each object, the typical photometric error for an individual exposure was determined from the intra-night scatter of the magnitude values measured on the individual frames. These intra-night scatters were 0.007 mag (A), 0.025 mag (B), and 0.033 mag (S3); B is fainter than A in ~1.3 mag (and only 1.′′1 away from the brightest image A), and S3 is fainter than B in ~1.2 mag. The errors for combined frames were reduced by a factor of N1∕2, where N = 2−3 is the number of individual exposures. After constructing the LT r-band brightness records, we merged this new dataset and the NOT R-band data at day 5236 (MJD−50 000; derived from the ALFOSC exposures on 8 February 2010) using an r − RNOT offset of 0.153 mag. We also found an r − RMAO offset of 0.489 mag, and merged the LT-NOT and the MAO data in 2001−2006. We remark that both magnitude offsets were calculated from the records of the non-variable star S3.
The top panel of Fig. 4 shows the LT-NOT-MAO r-band light curves of the double quasar and the comparison star S3. The brightness changes of A and B are significantly greater than the observational noise level in the record of S3, which is appreciably fainter than both quasar images. In addition, the almost parallel behaviour ofA and B indicates the presence of intrinsic variations. In Table 5 at the CDS, using the same format as Table 4, we include the r-SDSS magnitudes of A and B (and their errors) at 66 epochs over the period 2001−2016. Column 1 contains the observing dates (MJD−50 000), Cols. 2 and 3 give the magnitudes and magnitude errors of A, and Cols. 4 and 5 give the magnitudes and magnitude errors of B. Regarding the extrinsic signal in the r-band, the DLC and the single-epoch differences are shown in the bottom panel of Fig. 4. It is apparent that the DLC values basically agree with single-epoch differences close to them. However, it is not clear whether the microlensing variation that was observed in the period 1999−2006 (Jakobsson et al. 2005; Paraficz et al. 2006; Shalyapin et al. 2009) is completed or not. Although the DLC in 2009−2016 is roughly consistent with a quiescent phase of microlensing activity, the single-epoch differences suggest an active phase, in which the current r-band flux ratio could be similar to the single-epoch Mg II flux ratio as measured in 2001 by Jakobsson et al. (2005).
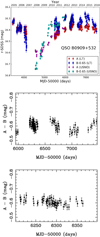 |
Fig. 3 Light curves of QSO B0909+532 in the r-band. Top panel: LT-USNO brightness records of both quasar images. The brightness of B is offset by −0.65 mag to facilitate comparison, and the new LT data correspond to our monitoring in 2012−2016. Middle panel: DLC between 2012 and 2016, and bottom panel: zoomed-in DLC around day 6300. To construct the DLC, the data of the A image have been shifted by −50 d (time delay), and then binned around the dates of the B image (using bins with a semisize of 10 d). Only bins including two or moredata have been taken into account to compute differences between A and B. |
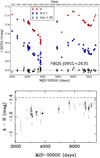 |
Fig. 4 Light curves of FBQS J0951+2635 in the r-band. Top panel: LT-NOT-MAO brightness records of both quasar images and the faint star S3. There is a gap of about 1000 d between the MAO monitoring campaign (before day 4000) and the LT-NOT follow-up observations starting in 2009. The records of B and S3 are offset by −0.70 and −1.35 mag, respectively. Bottom panel: DLC (black data points), where the data of the B image have been shifted by −16 d (time delay) and binned around the dates of the A image (using bins with a semisize of 4 d). We also show the single-epochmagnitude differences (grey data points), as well as the single-epoch flux ratio of the Mg II emission line in magnitudes (horizontal dashed line). |
3.2.3 QSO B0957+561
Optical photometry
We observed QSO B0957+561 in red passbands from 1996 to 2016, that is, for 21 yr. We used the IAC80 Telescope during the first observing period (1996−2005), while we monitored the double quasar with the LT from 2005 to 2016. The IAC80-CCD frames in the R-band for the period 1996−2001 were previously processed using the PHO2COM photometric task (Serra-Ricart et al. 1999; Oscoz et al. 2002). Here, we focus on the most recent IAC80-CCD R-band frames taken between January 1999 and November 2005, which are included in our database (see Table 3). The CCD camera covered an area of about 7′ × 7′ on the sky, with a pixel scale of ~ 0.′′43. This field of view allowed us to simultaneously image the AB components of the GLQ and the YXRFGEDH field stars (see the top panel of Fig. 5). The typical exposure time was 300 s, although longer combined exposures of 900−1200 s were also used. We selected 515 R-band frames with a reasonable size of the seeing disc, and then performed PSF photometry on the field stars and lens system with the IMFITFITSsoftware. As usual, the clean 2D profile of the H star was considered as the empirical PSF and the lens system was modelled as two stellar-like sources (i.e. two PSFs) plus a de Vaucouleurs profile convolved with the PSF. For these R-band frames, we found evidence of inhomogeneity over the field of view and carried out a frame-to-frame inhomogeneity correction based on the idea by Gilliland & Brown (1988). When we performed photometry on frames of any lens system, we paid special attention to colour and inhomogeneity terms, as well as other atmospheric and instrumental effects (e.g. Shalyapin et al. 2008).
We thus obtained new photometric data of QSO B0957+561 from 515 IAC80-CCD frames in the R-band over a seven-year period in 1999−2005. After an S∕N > 70 selection (the S/N values were calculated within circles of 7-pixel radius centred on the quasar image A), the number of frames was reduced to 441. To estimate typical photometric errors, we computed magnitude differences between consecutive nights. These night-to-night brightness variations led to an uncertainty of 0.014 mag for both A and B, meaning that photometry to 1.4% was achieved for the lensed quasar. If there were several measurements on the same night, they were grouped to get more accurate light curves. This grouping produced 367 magnitudes for each quasar image. We also rejected outliers, so that the new IAC80 dataset contains 347 epochs. We note that it is important to merge the old IAC80 data (PHO2COM light curves in Fig. 1 of Oscoz et al. 2002) and the new IAC80 brightness records, as well as the new IAC80 data and the LT r-band light curves over 2005−2010 (Shalyapin et al. 2008, 2012). Before constructing a global IAC80 database in the R-band, we applied an outlier detection, data cleaning, and intra-night grouping method to the old photometry. Thus, we found small Rnew − Rold offsets of 0.004 mag in A and 0.031 mag in B, and merged the old (1996−2001) and the new (1999−2005) data. The shifted old magnitudes in 1999−2001 were then replaced by our new photometric data in that period. In addition, to transform the R-band magnitudes (Rnew) into the r-band of the SDSS photometric system, we found similar r − Rnew offsets of −0.236 mag in A and −0.233 mag in B.
After building the light curves in the r-band until 2010 (942 epochs), the next step was to incorporate all the available data for the period 2011−2016. We fully processed and analysed the RATCam r-band frames between 2011 and 2014 (RATCam was decommissioned at the end of February 2014), which have provided magnitudes in 34 additional nights. We also obtained photometric outputs from 95 IO:O frames in the r-band. Because this optical camera has a high sensitivity, the brightest stars in its field of view are often saturated. Hence, we used the H star to build the PSF in two-thirds of the frames, while the Y star was used in the remaining one-third of the frames (see the PSF1 and PSF2 stars in the top panel of Fig. 5). Following the standard selection procedure of IO:O data, we removed quasar magnitudes for three frames in which the S/N of image A was below 30. Fortunately, we did not detect any outlier, and thus added 91 new magnitude epochs (two frames were taken on the same night). The IO:O monitoring is characterised by a mean sampling rate of about one frame every 7−10 d, and this precludes an estimation of the variability on consecutive nights. For a given quasar image, we made trios of consecutive data within time intervals shorter than 14.5 d. We also performed a linear interpolation to the initial and final magnitudes in each trio to generate an interpolated magnitude at the same epoch as that of the central data point, and we then derived a typical photometric error by comparing measured and interpolated central magnitudes. This method produces reasonable errors of 0.010 mag in A and 0.013 mag in B, which are consistent with the uncertainty in the magnitude of the control star R (0.011 mag; A, B, and R have similar brightness).
The IAC80-LT r-band light curves over the 21-yr period 1996−2016 are available at the CDS: the format of Table 6 is similar to those of Tables 4 and 5, including r-SDSS magnitudes and errors of A and B at 1067 epochs (MJD−50 000). These records are shown in the middle and bottom panels of Fig. 5, which indicate that the variability of the GLQ has increased over the last data decade. While the quasi-constancy of the delay-corrected flux ratio B∕A in red passbands between 1987 and 2007 (dates of the trailing image B) is well known, for B∕A ~ 1.03 (e.g. Oscoz et al. 2002; Shalyapin et al. 2008), there is some controversy on the behaviour of the flux ratio in more recent years when higher variability occured (Hainline et al. 2012; Shalyapin et al. 2012). Using LT-USNO r-band data, Hainline et al. (2012) suggested the existence of a slow increase in B∕A over days 4100−5700 (epochs of B). However, a reanalysis of LT-USNO data revealed an oscillating behaviour between days 4100 and 5400 (see the rectangle with dashed sides in the top panel of Fig. 6) that calls into question the presence of a microlensing gradient during these epochs (Shalyapin et al. 2012). To try to remedy this problem, we derived the r-band flux ratio in 20 time segments of B covering the full photometric monitoring campaign from the IAC80-LT light curves (see Appendix A.1).
In the top panel of Fig. 6, we present the long-term evolution of B∕A (see Table A.1), where the ⟨tB⟩ values are the average epochs for the overlapping periods between the time-delay shifted flux record of A and the time segments of B. The error bars represent formal 2σ confidence intervals, and the grey highlighted rectangle is the 2σ measurement of the r-band B∕A from HST spectra in 1999−2000 (Goicoechea et al. 2005). Although we detect a low-amplitude variability over the first 5000 days of data, the values of B∕A are outside the HST band from day 6000. Hence, although the DLC in Hainline et al. (2012) likely has a biased shape, the new results support their claim that a microlensing event occurred in recent years. An extrinsic event (decrease in B∕A) with similar amplitude has only been detected in the first years of the 1980s (e.g. Pelt et al. 1998), so this new accurately measured fluctuation offers a unique opportunity to unveil physical properties of the source and the primary lensing galaxy. In the bottom panel of Fig. 6, we also show the lack of correlation between B∕A and the average flux ⟨B⟩. Based on four measurements of B∕A from LT observations in 2005−2010 (see the rectangle with dashed sides in the top panel), we have previously found evidence of a correlation between flux ratio and variability of B. However, from this larger collection of data, we did not find any clear B∕A − σB relationship, where the σB values are the standard deviations of the flux of B in the overlapping periods between A(+420 d) and B.
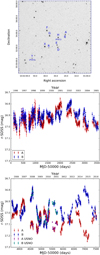 |
Fig. 5 Photometric monitoring of QSO B0957+561. Top panel: IO:O r-band frame taken on 21 January 2015. In this typical frame in terms of seeing (FWHM = 1.′′ 45), the two quasar images and several field stars are properly labelled (these objects, except for star Y, are depicted on the finding chart of Ovaldsen et al. 2003). Middle and bottom panels: IAC80-LT light curves in the r-band in two different monitoring periods. The first period includes IAC80 data (middle panel), while the vast majority of data in the second period correspond to LT observations (bottom panel). For comparison purposes, the bottom panel also contains the USNO brightness records in 2008−2011 using our own estimate for the rLT − rUSNO magnitude offset (14.430 mag instead of the 14.455 mag offset used by Hainline et al. 2012). |
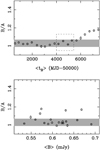 |
Fig. 6 Delay-corrected r-band flux ratio of QSO B0957+561. The 2σ measurements of B∕A are obtained in the overlapping periods between A(+420 d) and B. Here, the ⟨tB ⟩ and ⟨B⟩ values are the epochs and fluxes of B averaged over these periods. The grey highlighted rectangles illustrate the r-band flux ratio from HST spectra in 1999−2000 (2σ confidence interval), while the rectangle with dashed sides highlights the oscillating trend from LT photometric data in 2005−2010. The top panel shows the yearly variability and the bottom panel displays the dependence of B∕A on ⟨B⟩. |
Imaging polarimetry
As part of a pilot programme to probe the suitability of the main instruments on the LT for studying GLQs, we also conducted polarimetric and spectroscopic monitorings of QSO B0957+561 with the 2 m robotic telescope. For polarimetric follow-up observations, we used the imaging polarimeters RINGO2 and RINGO3. The basic idea behind these instruments is to take eight consecutive exposures of the same duration for eight different rotor positions of a rapidly rotating polaroid. The data are then stacked for each rotor position to produce eight final frames in a given optical band (e.g. Jermak 2016, and references therein). Combining photometric measurements in the eight frames allows determining the polarisation (Clarke & Neumayer 2002). RINGO2 saw first light in June 2009 and was decommissioned in October 2012. This optical polarimeter used an EMCCD composed of 512 × 512 pixels (pixel scale of ~ 0.′′45) and a hybrid V + R filter covering the wavelength range 460 to 720 nm. We obtained 8 × 200 s frames on each of the first two nights of observation (21 December 2011 and 13 January 2012), and performed slightly longer imaging-polarimetry observations(8 × 300 s frames) on 23 January 2012 and 26 March 2012. The data on 13 January 2012 are not usable because the PSF is very elongated along a specific direction as a result of tracking problems. The RINGO3 multicolour polarimeter was brought into service in January 2013, and it incorporates a pair of dichroic mirrors that split the light into three beams to simultaneously obtain exposures in three broad-bands using three different 512 × 512 pixel EMCCDs (Arnold et al. 2012): B (350−640 nm), G (650−760 nm), and R (770−1000 nm). We obtained useful data (8 × 300 s frames with each EMCCD) on 16 out of 18 observing nights over the period 2013−2017. As polarimetric observations have been interrupted in late February 2017, we analysed all available frames, even those not yet included in our GLQ database.
In Appendix A.2, we present details on the reduction of RINGO2 and RINGO3 observations of QSO B0957+561. After removing main instrumental biases, the Stokes parameters (qA, uA) and (qB, uB) at different observing epochs are depicted in Figs. A.3 and A.5. Although the construction of polarisation curves of the two quasar images is a very attractive possibility, we should firstly check whether the scatters in these q − u diagrams are caused by true variability. Accordingly, scatters in parameter distributions of the quasar images were compared to scatters in distributions of Stokes parameters for the non-variable field stars E and D (see the top panel of Fig. 5). We concentrated on RINGO2 and RINGO3/B data, which are based on the best observationsin terms of S/N, and deduced that deviations from the mean values in Fig. A.3 and the top panel of Fig. A.5 are essentially due to random noise. Thus, for a given observational configuration (polarimeter and optical band), the polarisation of each image is characterised by mean values ( , ū) and standard errors (
 , σū). The polarisation degree and polarisation angle were derived as
  and
and  , respectively (e.g. Clarke & Neumayer 2002). We also estimated a common random error for
  and ū of both images (σpol) through the average of the four standard errors, and obtained σPD = σpol and σPA = 0.5 (σpol∕PD) from a standard propagation of uncertainties.
Table 7 includes our main results for the two quasar images in the four observational configurations: RINGO2, RINGO3/B, RINGO3/G, and RINGO3/R. We note two important details: first, there are only three individual observations from RINGO2, and with just three data points (q, u) for each image, the σpol value is 50% uncertain. To account for this extra uncertainty, the errors in the first data row of Table 7 are increased by 50%. Second, as the PD of weakly polarised sources is systematically overestimated (e.g. Simmons & Stewart 1985), we also report the corrected polarisation degree (PDcorr). For PD∕σPD lower than or similar to 1, the best estimate of the actual polarisation amplitude is zero: PDcorr = 0 (e.g. Simmons & Stewart 1985). Otherwise, we use the estimator described by Wardle & Kronberg (1974). The results in Table 7 indicates that the polarisation of QSO B0957+561 has remained at low levels during the 5.2-yr polarimetric follow-up. Contrary to what Shalyapin et al. (2012) proposed to explain certain time-domain observations of the first GLQ (see Sect. 3.1.3), we have not found evidence for high-polarisation states in epochs of violent activity. While the RINGO3 data of B are consistent with zero polarisation (or PD ≤ 0.3% from the weighted average over the three bands), the data of A suggest a polarisation amplitude of about 0.5%. The detection of this 0.5% polarisation in A (which could depend on wavelength; see the PDcorr values in the third column of Table 7) deserves more attention. Before this work, Wills et al. (1980) conducted polarimetric observations of QSO B0957+561 using unfiltered white light. They reported PD = 0.7 ± 0.4% (PDcorr = 0.6%) for A and PD = 1.6 ± 0.4% (PDcorr = 1.5%) for B. Therefore, the current polarisation degree of image A agrees well with the 1980 value of Wills et al., while the current PD of image B does not. Dolan et al. (1995) also studied the polarisation of A and B in the UV. However, their HST data led to large uncertainties of ~1.5% in the PD of both images, and no reliable detection was obtained.
Polarimetric results from RINGO2 and RINGO3 observations of QSO B0957+561.
Spectroscopy
Our spectroscopic monitoring of QSO B0957+ 561 includesmany observing epochs with FRODOSpec on the LT. This spectrograph is equipped with an integral field unit that consists of 12 × 12 lenslets each 0.′′ 83 on sky, covering a field of view of 9.′′84 × 9.′′ 84. However, the FRODOSpec programme in 2010−2014 was not as successful asexpected, and only ~25% of the 2500−2700 s exposures led to usable spectra of both quasar images. The difficulty in placing in a robotic mode two sources separated by 6.′′ 1 within a square of side ~10′′ was one of the main reasons for a relatively low efficiency of the IFS monitoring. We obtained 16 reasonably good individual exposures with FRODOSpec, and one of them (on 1 March 2011) was exhaustively analysed by Shalyapin & Goicoechea (2014b). This paper addressed the whole processing method we used to obtain flux-calibrated spectra of sources in crowded fields from FRODOSpec observations12. For both the IFS and the LSS (in this subsection and in Sect. 3.2.4), we almost always compared quasar spectral fluxes averaged over the g and/or r passbands with corresponding concurrent fluxes from RATCam/IO:O frames. This comparison has permitted us to check the initial calibration of spectra and recalibrate them when required. Here, we concentrated on the Mg II emission at 2800 Å observed at red wavelengths because the red grating of the integral-field spectrograph provides the highest S/N values. The red grating spectra of A, B, and the primary lensing galaxy (GAL) are available at the CDS: Table 8 includes wavelengths (Å) along with fluxes of A, B, and GAL (10−17 erg cm−2 s−1 Å−1) for each of the 16 observing dates (yyyymmdd).
We conducted additional LSS, with the long slit in the direction joining A and B. At each wavelength bin, the spectroscopic data along the slit were fitted to an 1D model consisting of two Gaussian profiles with a fixed separation between them. This procedure provided spectra for A and B. As the data were not taken along the parallactic angle, differential atmospheric refraction (DAR) produced chromatic offsets of both quasar images across the slit (Filippenko 1982), and thus wavelength-dependent slit losses. We assumed that the two sources were exactly centred on the slit at ~6200 Å (acquisition frame in the r-band), and then derived DAR-induced slit losses and corrected original spectra. Using g-band and/or r-band fluxes from RATCam/IO:O frames (see above), we also accounted for weak spectral contaminations by GAL. Observations with SPRAT at five epochs between 2015 and 2017 (the last two are not included in the current version of the GLQ database) were used to study the Mg II line at 21 epochs. The SPRAT spectra show the Mg II and C III] emission lines, as well as several absorption features (see Fig. 7). Table 9 at the CDS is structured in the same manner as Table 8, but incorporating the fluxes of A and B from the observations with SPRAT. Although NOT/ALFOSC spectroscopic data in 2009−2013 (four epochs) contain Mg II, C III] and C IV emission features, the Mg II line is near the red edge of the NOT/ALFOSC/#7 spectra. We were not able to accurately calibrate the NOT/ALFOSC spectroscopy on 29 January 2009, therefore, we only extracted usable spectra at three epochs. These NOT/ALFOSC data are presented in Tables 10 (grism 7) and 11 (grism 14) at the CDS, using the same format and units as Table 9. In addition, we were unfortunately unable to infer reliable results for any emission line from the INT/IDS spectroscopy on 31 March 2008 because of poor atmospheric seeing.
In Appendix A.3, we analyse the profiles, fluxes and single-epoch flux ratios of the Mg II, C III], and C IV emission lines. The single-epoch Mg II flux ratios are marked with red circles in Fig. 8. We also show their average value (dashed red line) and standard deviation (red band). The average flux ratio is  = 0.77 ± 0.02, in good agreement with the macrolens (radio core) flux ratio (0.75 ± 0.02; Garrett et al. 1994) and the first estimation of the delay-corrected Mg II flux ratio (0.75 ± 0.02; Schild & Smith 1991). Although the red circles in Fig. 8 come from fluxes of A and B that are not separated by the time delay between the two images, the distribution of single-epoch flux ratios can be used to determine the delay-corrected value of B∕A. The unaccounted line variability yields biases in both directions (underestimates and overestimates), and thus generates a random noise. As we only have three measures of the C IV flux ratio (see the blue triangles in Fig. 8),
  = 0.91 ± 0.09 could be a biased estimator of the delay-corrected value. However, the statistical result based on about ten observing epochs of the C III] line is noteworthy (see the green squares, the dashed green line, and the green band in Fig. 8):
 ![$\langle B/A \rangle_{\textrm{[C\,III]}}$](/articles/aa/full_html/2018/08/aa32737-18/aa32737-18-eq10.png) = 0.77 ± 0.02.
= 0.77 ± 0.02.
From spectroscopic observations separated by ~425 d, that is, a time lag very close to the measured delays between A and B, we can obtain delay-corrected values of  and
and ![$(B/A)_{\textrm{C\,III]}}$](/articles/aa/full_html/2018/08/aa32737-18/aa32737-18-eq12.png) (see Tables A.2 and A.3). Thus, the FRODOSpec spectra of A and B on 21 December 2011 and 20 February 2013, respectively, were used to calculate a typical value
(see Tables A.2 and A.3). Thus, the FRODOSpec spectra of A and B on 21 December 2011 and 20 February 2013, respectively, were used to calculate a typical value  = 0.71 in the first half of this decade. More recent SPRAT spectra also allowed us to determine two delay-corrected flux ratios for each emission line:
  = 0.76 and
 ![$(B/A)_{\textrm{C\,III]}}$](/articles/aa/full_html/2018/08/aa32737-18/aa32737-18-eq15.png) = 0.80 from the spectra in Fig. 7, and
= 0.80 from the spectra in Fig. 7, and  = 0.73 and
 ![$(B/A)_{\textrm{[C\,III]}}$](/articles/aa/full_html/2018/08/aa32737-18/aa32737-18-eq17.png) = 0.69 from the spectrum of A on 21 November 2015 and the spectrum of B on 18 January 2017. A basic statistics leads to
= 0.69 from the spectrum of A on 21 November 2015 and the spectrum of B on 18 January 2017. A basic statistics leads to  = 0.73 ± 0.02 and
 ![$\langle B/A \rangle_{\textrm{C\,III]}}$](/articles/aa/full_html/2018/08/aa32737-18/aa32737-18-eq19.png) = 0.75. These measures and the single-epoch flux ratios for both lines are consistent with previous estimates based on analyses of magnesium and carbon emissions (e.g. Schild & Smith 1991; Goicoechea et al. 2005, and ⟨B∕A⟩ = 0.72 ± 0.04 from Fig. 13 of Motta et al. 2012), as well as the macrolens flux ratio of ~0.75. Therefore, although the behaviour of the C IV flux ratio during the initial phase of the ongoing microlensing event in thecontinuum is not a clear matter (see above), there is strong evidence that the Mg II and C III] emitting regions have not been affected by dust extinction and microlensing during the past 30 yr.
= 0.75. These measures and the single-epoch flux ratios for both lines are consistent with previous estimates based on analyses of magnesium and carbon emissions (e.g. Schild & Smith 1991; Goicoechea et al. 2005, and ⟨B∕A⟩ = 0.72 ± 0.04 from Fig. 13 of Motta et al. 2012), as well as the macrolens flux ratio of ~0.75. Therefore, although the behaviour of the C IV flux ratio during the initial phase of the ongoing microlensing event in thecontinuum is not a clear matter (see above), there is strong evidence that the Mg II and C III] emitting regions have not been affected by dust extinction and microlensing during the past 30 yr.
Deep NIR imaging
NIR frames of QSO B0957+561 were obtained on 28 December 2007 with the TNG using the instrument NICS in imaging mode. All frames were taken with the small field camera, which provides a pixel scale of 0.′′ 13 and a field of view of 2.′2 × 2.′2. We also used three different filters JHK covering the spectral range of 1.27−2.20 μm, that is, ~5260−9110 Å in the quasar rest frame, and combined individual exposures in each passband to produce final frames with subarcsec spatial resolution. The left panels of Fig. 9 show the strong-lensing region encompassing the three science targets A, B, and GAL. The total exposure times are 3120, 2200, and 4500 s in the J-, H-, and K-bands, respectively. Each combined frame of QSO B0957+561 incorporates the lens system and the bright reference star H (which does not appear in Fig. 9), so that the PSF can be finely sampled and an accurate PSF-fitting photometry of the lens system can be performed.
As usual, the lens system was modelled as two PSFs (A and B) plus a de Vaucouleurs profile convolved with the PSF (GAL). We then determined the structure parameters of the galaxy by setting the positions of B and GAL (relative to A) to those derived from HST data in the H-band (Keeton et al. 2000). These IMFITFITS structure parameters are shown in Table 12. The J-band size (reff) is similar to the optical size (Keeton et al. 1998), and the galaxy is more compact at longer wavelengths. Additionally, the e and θe values in the NIR almost coincide with previous optical estimates at isophotal radii > 1′′ (Bernstein et al. 1997; Fadely et al. 2010). We note that our solution in the H-band differs from the H-band photometricstructure reported by Keeton et al. (2000), since we obtain higher values of reff, e, and θe. In Fig. 9, we display the residual instrumental fluxes after subtracting A+B (middle panels) and A+B+GAL (right panels), andthe right panels contain arc-like residues resembling the host-galaxy light distribution from HST H-band observations. Using the JHKs magnitudes of the H star in the Two Micron All Sky Survey (2MASS; Skrutskie et al. 2006) database, we also inferred magnitudes for the galaxy and the two quasar images (see the last three rows in Table 12).
Unfortunately, we failed to obtain additional NIR data in early 2009, and thus delay-corrected flux ratios could not be probed. However, Keeton et al. (2000) measured a single-epoch flux ratio  = 0.93 from observations in 1998, and using data acquired about ten years later, we obtain
  = 0.94 (see Table 12). This suggests that the single-epoch flux ratio in the H-band is stable on long timescales and might be a rough estimator of the delay-corrected value of B∕A. Based on the magnitudes in Table 12, the NIR flux ratios of QSO B0957+561 vary from 1 (J-band) to 0.9 (K-band), decreasing as the wavelength increases. For comparison purposes, we also analysed mid-IR (MIR) observations in the data archive of the Spitzer Space Telescope. We found two Spitzer combined frames including QSO B0957+56113, each corresponding to a 202 s exposure with MIPS at 24 μm, and the fluxes of the quasar images in both frames were extracted using the MOPEX package14. The average fluxes ⟨A⟩ = 12135 μJy and ⟨B⟩ = 8932.5 μJy lead to a 24 μm flux ratio of 0.74, in very good agreement with radio and emission-line flux ratios. We remark that the radiation observed at 24 μm is emitted at ~10 μm from a dusty torus surrounding the AD and broad line emitting regions (Antonucci 1993), and passes through the lens galaxy with a wavelength of 17.6 μm. Thus, this radiation is insensitive to extinction and microlensing.
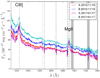 |
Fig. 7 SPRAT spectroscopy of QSO B0957+561 on 19 November 2015 and 17 January 2017. Vertical dashed and dotted lines indicate emission and absorption features, while grey highlighted regions are associated with atmospheric artefacts. |
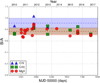 |
Fig. 8 Single-epoch flux ratios of emission lines. The blue triangles, green squares, and red circles represent the C IV, C III], and Mg II flux ratios, respectively. Average values and standard deviations are marked by dashed lines and bands: blue (C IV), green (C III]), and red (Mg II). The green and red bands overlap almost completely, resulting in a brown band. |
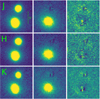 |
Fig. 9 TNG/NICS imaging of QSO B0957+561 in subarcsec seeing conditions. Left panels: lens system in the final combined frames with total exposure times of 3.12 ks (J-band), 2.2 ks (H-band), and 4.5 ks (K-band). Middle panels: residual signal after subtracting only the two quasar images (A+B), clearly displaying the main lensing galaxy. Right panels: residual light after subtracting the global photometric model (A+B+GAL). See main text for details. |
Best photometric solutions in the JHK-bands.
Overview
After accumulating data for many years, we are gaining a clearer perspective of the physical processes at work on QSO B0957+561. From a 5.5-yr optical monitoring of the two quasar images, we found oscillating behaviours of the delay-corrected flux ratios in the g and r-bands, with maximum values of B∕A when the flux variations are greater (Shalyapin et al. 2012). This result was crudely related to the presence of dust along the line of sight towards image A (within the lensing galaxy) and the emission of highly polarised light during episodes of violent activity. Here, we present r-band light curves covering 21 yr of observations (from 1996 to 2016), which allow us to better understand the long-term evolution of  . Based on these longer–lasting brightness records,
  does not seem correlated with flux level or flux variation, meaning that violent activity is not the unique driver of changes in
  and
and  (see below). In addition, a 5.2-yr optical polarimetric follow-up does not show any evidence for high polarisation degrees when large flux variations occur. In fact, PD < 1% during the entire monitoring period.
Shalyapin et al. (2012) also reported a chromatic time delay between A and B. They used a standard cross-correlation in the g and r-bands, and their results were interpreted as being due to chromatic dispersion of the A image light by a dusty region inside the lensing galaxy. However, while the chromaticity of the time delay from standard techniques does not seem arguable, its interpretation is very likely incorrect (see the second paragraph in Sect. 3.1.3). Very recently, Tie & Kochanek (2018) proposed that measured delays of a GLQ may contain microlensing-induced contributions of a few days, which would depend on the position of the AD across microlensing magnificatiion maps. A microlensing-based interpretation for the approximately three-day difference between the delays in the g and r-bands is unlikely, however. The time delays of 417 d (g-band) and 420 d (r-band) are consistent with data from two independent experiments separated by ~15 yr (Kundić et al. 1997; Shalyapin et al. 2012), and thus microlensing does not seem to play a relevant role.
A more plausible scenario may account for a few observed “anomalies” in QSO B0957+561 without a need to invoke highly polarised emission phases, the existence of exotic dust, or complex microlensing effects that remain over decades. The UV-visible-NIR continuum observed in the quasar comes from the direct UV-visible emission of the AD and the diffuse UV-visible light emitted by broad-line clouds (BLC), and this last contribution could be relatively significant (e.g. Korista & Goad 2001, and references therein). The continuum of the BLC includes scattered (Rayleigh and Thomson) and thermal (Balmer and Paschen recombination) radiation, and high-density gas clouds are particularly efficient in producing a diffuse component (Rees et al. 1989). From a wider perspective, heavily blended iron lines also produce a pseudo-continuum in quasar spectra (e.g. Wills et al. 1985; Maoz et al. 1993), and recent research has provided evidence for two different emitting regions in QSO B1413+117 (Sluse et al. 2015). The compact emission of this quasar is probably scattered by electrons and/or dust in an extended region.
HST spectra of QSO B0957+561 in April 1999 and June 2000 allowed us to construct delay-corrected continuum flux ratios B∕A at UV-visible-NIR wavelengths during a period of low quasar activity and microlensing quiescence (Goicoechea et al. 2005). These data and HST emission-line ratios are consistent with a simple picture: the direct light of the A image is affected by a compact dusty region in the intervening cD galaxy (see the first paragraph in Sect. 3.1.3 and new results in this section), which is adopted here for further discussion. As a result, regarding the continuum observed in the two quasar images, the diffuse contribution plays a more important role in A because its direct light is partially extinguished by dust. In the absence of extended diffuse light, the continuum flux ratio at the observed wavelength λ is given by Bλ (t)∕Aλ(t −Δt) = 0.75∕ϵλ, where 0.75 is the macrolens ratio and ϵλ is the dust extinction law. However, assuming that Tλ is the light-travel time (in the observer’s frame) between the direct compact source and the clouds emitting the observed radiation, as well as a diffuse-to-direct emission ratio δλ ≪ 1, ϵλ should be replaced by an effective extinction ![$\epsilon_{\lambda}^{\textrm{eff}} \approx \epsilon_{\lambda} + (1 - \epsilon_{\lambda})\delta_{\lambda} [B_{\lambda}(t - T_{\lambda})/B_{\lambda}(t)]$](/articles/aa/full_html/2018/08/aa32737-18/aa32737-18-eq26.png) . During low activity periods, Bλ (t − Tλ)∕Bλ(t) ~ 1 and spectral anomalies in B∕A are due to peaks in δλ, i.e.
. During low activity periods, Bλ (t − Tλ)∕Bλ(t) ~ 1 and spectral anomalies in B∕A are due to peaks in δλ, i.e.  . Thus, the apparent distortion of the 2175 Å extinction bump (observed around 2960 Å) is reasonably related to the Lyα Rayleigh scattering feature, while the flattening at NIR wavelengths would be (at least partially) due to a large amount of diffuse emission at ~3000−4000 Å (around the Balmer jump; e.g. Korista & Goad 2001).
The toy model outlined in the previous paragraph can also be used to discuss some time-domain anomalies. Considering a central epoch in the time segment TS4 (e.g. the day 5300 in such episode of violent variability; see Appendix A.1), we estimated Br (t − Tr)∕Br(t) ~ 0.90−0.95 if Tr ~ 50−100 d (e.g. Guerras et al. 2013). As the diffuse light contribution to  decreases by ~5−10% (with respect to low activity periods), this may produce the 4% increase observed in
  at day 5300. Moreover, the diffuse-light term in the effective extinction decreases by about 9−17% at the r-band flux peak, in reasonable agreement with the measured increase of a 9% in the flux ratio at day 5370. Therefore, the model is also able to explain the flux ratio anomalies during sharp intrinsic variations of flux. Despite this sucess of the AD + BLC scenario in accounting for some local fluctuations in
  , a microlensing-induced variation is taking place in recent years. The time-evolution of the flux ratios in the gr-bands is thus a powerful tool to constrain the sizes of the g- and r-band continuum sources, and compare microlensing-based measures with reverberation mapping ones.
A central EUV light source most likely drives the variability of QSO B0957+561 (Gil-Merino et al. 2012). Although this ionising radiation cannot be observed directly (e.g. Michalitsianos et al. 1993), its variations are thermally reprocessed within the AD to generate fluctuations in the UV emission that are observed in the visible continuum. These EUV and UV variations are also reprocessed in the BLC, but extended regions respond later and less coherently than compact ones. Even though detailed simulations are required to obtain a realistic description of the BLC emissivity (e.g. using CLOUDY models; Ferland et al. 1998; Ferland 2003), we again used the toy model to obtain some insights into expected delays in the AD + BLC scenario. For instance, in the g-band, the flux of Aat t −Δt can be related to the fluxes of B at t and t − Tg, that is, Ag (t −Δt) ≈ 1.33ϵgBg(t) + 1.33(1 − ϵg)δgBg(t − Tg). However, when estimating the time delay Δt from a standard cross-correlation, we are implicitly assuming a linear relationship Ag (t −Δt) = αBg(t) + β. The key point is that the contamination by diffuse light from the gas clouds does not produce a constant added (β), but a variable one β(t) ∝ Bg(t − Tg). The linear law does not hold here, so we indeed derive an effective time delay Δ tg= Δt − τg instead of the true achromatic value. The amount of deviation (τg > 0) depends on the relative weight and the degree of variability of the delayed signal β(t). As the relative extinction (1 − ϵ)∕ϵ and the variability of B increase toward shorter wavelengths, it is not at all surprising to measure a lag Δ tr −Δtg = τg − τr ~ 3 d.
3.2.4 SDSS J1001+5027
The COSMOGRAIL collaboration monitored the two images of SDSS J1001+5027, measuring a time delay of about four months (Rathna Kumar et al. 2013). We therefore interrupted the LT photometric monitoring of the GLQ (whose primary goal is determining the time delay) and started spectroscopic follow-up observations separated by four months. The first successful spectra of SDSS J1001+5027 were obtained using FRODOSpec on 7 November 2013, 8 February 2014, and 26 March 2014. We did not obtain data in early June 2014, and thus, by means of FRODOSpec observations, only one comparison between A and B is possible at the same emission time. We took a single 3000 s exposure on each of the three nights. The blue grating signal was very noisy, therefore only red grism data were considered of astrophysical interest. We also observed the GLQ with SPRAT on several nights. The 1.′′ 8 (~4 pixel) wide slit was oriented along the line joining A and B, and we used the blue grating mode. We initially checked the feasibility of the SPRAT programme by taking 3 × 300 s exposures on 26 February 2015. After analysing these tentative data, we decided to use longer exposures (4 × 600 s) per observing run. We then obtained spectroscopic frames at four additional epochs: 2 December 2015, 5 April 2016, 6 December 2016, and 5 April 2017, but data on the last epoch are not usable. Spectra of the two quasar images were extracted by setting its angular separation to that reported by Rusu et al. (2016) and fitting two 1D Gaussian profiles (corrections for DAR-induced spectral distortions and flux calibrations are outlined in the subsection on spectroscopy in Sect. 3.2.3). The FRODOSpec red-grating spectra can be downloaded from the CDS: Table 13 includes wavelengths (Å) along with fluxes of A and B (10−17 erg cm−2 s−1 Å−1) for each of the three observing dates (yyyymmdd). The SPRAT data appear in Table 14 at the CDS, using the same data structure as Table 13. All usable LT spectra at seven different epochs are also shown in Fig. 10, where the FRODOSpec spectral energy distributions are smoothed with a three-point filter to reproduce the 4.6 Å bins of SPRAT.
Using previous simultaneous spectra of A and B, Oguri et al. (2005) noted that the C IV flux ratio  was significantly higher than the continuum flux ratio at 1549 Å in the quasar rest frame. Moreover, the single-epoch continuum flux ratios were higher for the longer wavelengths. In Appendix B, we analyse the new spectroscopy of SDSS J1001+5027, highlighting the results on the Mg II, C III], and C IV emissions, and the continuum fluxes at the rest-frame wavelengths of the three emission lines (see Tables B.1–B.3). From the single-epoch flux ratios in Table B.3, we infer
  = 0.78 ± 0.07 and
  = 0.52 ± 0.01 at 1549 Å. Wealso report that
  grows from 0.52 at 1549 Å to 0.78 at 2800 Å, and this growing trend becomes clearly apparent in Fig. 11 (coloured circles). Thenew continuum and emission-line flux ratios (coloured triangles represent the results for the emission lines) essentially agree with the findings of Oguri et al. (2005). When statistical studies are made with only a few data points, the standard deviation of the standard deviation (i.e. the uncertainty in the uncertainty) is large. Here, to account for this additional uncertainty when N = 4 (carbon lines) and N = 3 (magnesiumline), the standard deviations of the means were increased by 40 and 50%, respectively. These error bar enlargements are also useful to account for possible variability effects. Hence, we consider the coloured symbols (graph markers) in Fig. 11 as a proxy to the delay-corrected flux ratios. At present, our observations on 7 November 2013, 26 March 2014, 2 December 2015, and 5 April 2016 lead to a single value for each delay-corrected ratio, which is not depicted in Fig. 11 because it might be strongly biased.
In Fig. 11, we display  = 0.68 ± 0.01 (black filled square; Rathna Kumar et al. 2013) and
  = 0.79 ± 0.04 (dashed line and grey rectangle; Rusu et al. 2016) along with the LT flux ratios for the continuum and the emission lines. The emission-line flux ratios are in reasonably accord with the continuum flux ratios at the longest wavelengths, that is,
  at 2800 Å and
  , so that the macrolens flux ratio may lie within the grey rectangle depicted in this figure. For this scenario, the behaviour of the continuum flux ratios at shorter wavelengths (smaller emitting regions) requires a convincing explanation. The observed positive slope in
  (see the solid line in Fig. 11) could be primarily due to chromatic microlensing (e.g. Mediavilla et al. 2009) or extinction by a compact dusty cloud along the line of sight to the B image. The relative constancy of the positive
  gradient over a timescale of ~10 yr (see Fig. 2 of Oguri et al. 2005) favours the extinction phenomenon. In addition, the BOSS spectrum of B on 1 March 2014 includes a Mg II absorption doublet (2796 and 2803 Å) at the redshift of the main lensing galaxy (z = 0.415; Inada et al. 2012), which is absent in the SDSS spectrum of A on 3 October 2003. This metal ion is most likely associated with dust (see Sect. 3.1.3), suggesting the existence of significant extinction in the B image. However, Rathna Kumar et al. (2013) also indicated that
  = 0.54 (open square in Fig. 11) if the R-band magnitudes of the B image are contaminated by an unknown source with a non-variable flux. Then, assuming that contamination increases with wavelength,
  could be almost constant at 1500−3000 Å (dotted horizontal line). The origin of the observed flux ratios of SDSS J1001+5027 merits further study.
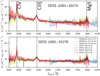 |
Fig. 10 FRODOSpec red-grating and SPRAT spectra of SDSS J1001+5027 in 2013−2016. We display the FRODOSpec spectra after a three-point smoothing filter is applied. Our global dataset contains information on the C IV, C III], and Mg II emissions at z = 1.838 (Oguri et al. 2005). |
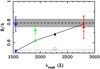 |
Fig. 11 Continuum and emission-line flux ratios of SDSS J1001+5027. The coloured circles and triangles describe the results for the continuum and the emission lines, respectively (see main text). Blue, green, and red are associated with the continuum (line) at 1549 Å (C IV), 1909 Å (C III]), and 2800 Å (Mg II). For comparison purposes, the black filled and open squares are results from the COSMOGRAIL monitoring in the R-band (Rathna Kumar et al. 2013), whereas the horizontal dashed line and the grey highlighted rectangle show the K′ -band flux ratio (1σ confidence interval) from Subaru Telescope adaptive optics observations (Rusu et al. 2016). |
3.2.5 QSO B1413+117
The RATCam r-band photometry in February–July 2008 (33 epochs) was presented in Table 1 of Goicoechea & Shalyapin (2010). In this section, we describe additional LT r-band observations, outline the most relevant processing tasks, and obtain new light curves of the four quasar images (A-D). The LT data archive includes usable frames for three observing nights with RATCam in May-June 200615. For each of these nights, we found 6−9 decent 100 s exposures. While the quasar images are bright (r ~ 18 mag), the main lensing galaxy is a very faint source (r ≥ 23; Kneib et al. 1998). Therefore, the fluxes in the crowded region of each individual frame were extracted using the IMFITFITS software and setting a simple photometric model consisting of four close PSFs. The empirical PSF was derived from the S45 field star, which was also taken as reference for differential photometry (see the finding chart in Fig. 1 of Goicoechea & Shalyapin 2010). For each quasar image and for the control star S40, we combined as a last step the individual magnitudes on each night into a single mean value and inferred its error from the standard deviation of the mean.
Our GLQ database also contains acceptable-quality IO:O observations obtained on 59 nights throughout the period 2013−2016. The two consecutive 250 s exposures per observing night were processed separately with IMFITFITS, and averaged magnitudes of quasar images (and the star S40) were then computed. To construct accurate light curves in 2013−2016, the selection criteria were the same as those applied to the previous monitoring campaign in 2008: FWHM < 1.′′ 5 and S∕N > 150. This selection procedure removed 29 out of 59 epochs, leaving 30 epochs with high-quality data. We note that the statistical properties of the seeing (⟨FWHM⟩ = 1.′′ 17 and σFWHM = 0.′′15) and the S∕N of S40 (⟨S∕N⟩ = 207 and σS∕N = 42) roughly coincide with the corresponding means and standard deviations for the 33 data epochs selected in 2008 (⟨FWHM⟩ = 1.′′16, σFWHM = 0.′′ 17, ⟨S∕N⟩ = 201 and σS∕N = 25), so that we have adopted the typical uncertainties in our previous brightness records as average photometric errors. We then used weighting factors ⟨S/N⟩/S/N to estimate errors on every night (e.g. Howell 2006). The r-band light curves of A-D covering two months in 2006 (RATCam) and the period 2013−2016 (IO:O; only selected epochs) are available in Table 15 at the CDS: Column 1 lists the observing date (MJD−50 000), and Cols. 2−3, 4−5, 6−7, and 8−9 give the magnitudes and magnitude errors of A, B, C, and D, respectively. LT r-band brightness records of the quadruple quasar QSO B1413+117 and the field star S40 are also illustrated in Fig. 12, which shows an ~0.3 mag intrinsic brightening of the four quasar images between the periods 2006−2008 and 2013−2016.
We also built DLCs of QSO B1413+117. Using the time delays and the magnitude offsets between the fainter images (B-D) and A (Goicoechea & Shalyapin 2010), we first derived magnitude- and time-shifted light curves of B-D. To obtain the DLCs in the top panel of Fig. 13, the original light curve of image A was then subtracted from these shifted brightness records. We only computed magnitude differences from BA, CA, and DA pairs separated by ≤7 d. In 2006, the DLC for the images D and A shows an evident deviation of ~0.1 mag from its zero mean level in 2008. Although this could be interpreted as a typical microlensing gradient of about 10−4 mag d−1 (e.g. Gaynullina et al. 2005; Fohlmeister et al. 2007; Shalyapin et al. 2009), data in Fig. 7 of Akhunov et al. (2017) make it possible to carry out a more detailed analysis. In 2013−2016, we also clearly detect an average deviation of ~0.1 mag in the DLC for the images B and A. Thus, we find evidence of microlensing activity between 2008 and 2013−2016. The recent DLCs, after subtracting their mean values, are plotted in the bottom panel of Fig. 13. A prominent gradient between days 7100 and 7200 is simultaneously observed in the three difference curves, which indicates the existence of a significant microlensing variation in the image A during the first half of 2015. Unfortunately, there is a long gap around day 7000, so we do not have information about the overall shape of this microlensing event. The DLCs only put constraints on its amplitude (≥0.1 mag) and duration (ranging from one month to one year). While previous studies have reported microlensing episodes in the optical continuum of the image D (e.g. Østensen et al. 1997; Anguita et al. 2008; Sluse et al. 2015; Akhunov et al. 2017), our DLCs demonstrate that other quasar images have also been affected by microlensing over the last ten years.
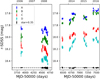 |
Fig. 12 LT r-band light curves of QSO B1413+117. Left panel: RATCam photometric data at 3 epochs in May–June 2006 and 33 selected epochs in 2008. Right panel: IO:O data at 30 selected epochs over the period 2013−2016. For comparison purposes, we also include the brightness record of the field star S40. This object has a magnitude similar to those of the quasar images. |
3.2.6 QSO B2237+0305
QSO B2237+0305 has been monitored at optical wavelengths over more than 20 yr by several large collaborations (Corrigan et al. 1991; Østensen et al. 1996; Woźniak et al. 2000; Alcalde et al. 2002; Schmidt et al. 2002; Vakulik et al. 2004; Udalski et al. 2006; Eigenbrod et al. 2008). In 2007, we started our own monitoring campaign with the LT. Photometric follow-up observations of the four quasar images (A-D) were initially peformed with RATCam in the period 2007−2009, and were resumed a few years later (from 2013) using IO:O. Regarding the r-band data, in the seasons 2007−2009, one 300 s exposure was taken on most nights. Although a single r-band frame per night was also obtained during seasons 2013−2016, the vast majority of exposures lasted 180−200 s. To obtain a better perspective on the variability of QSO B2237+0305, we analysed additional r-band frames collected at the LT in 2006. These publicly available materials are not incorporated in the current version of the GLENDAMA archive and correspond to an independent, short-term LT programme16. The star α (Corrigan et al. 1991) was used to estimate the S/N in all frames, as well as the PSF in many of them. However, when the brighter star γ was within the field of view and not saturated, we took this star to describe the PSF (the star γ is located 95′′ south from the lens system and is also called star 1 in Moreau et al. 2005).
We performed PSF-fitting photometry on the lens system and field stars. In the strong-lensing region, the photometric model consisted of four point-like sources (A-D) and a de Vaucouleurs profile convolved with the PSF (lensing galaxy). We set the positions of B-D and the galaxy (relative to A) to those derived from HST data in the H-band (e.g. Table 1 of Alcalde et al. 2002), and applied the IMFITFITS code to the best frames in terms of seeing and S/N. The mean values obtained for the parameters of the de Vaucouleurs profile (reff = 4.′′ 72, e = 0.40 and θe = 64°) were in close agreement with the structure parameters from the best GLITP frames in the R-band (Table 2 of Alcalde et al. 2002). In a last step, we applied the code to all frames, setting the relative positions and the galaxy properties. The individual photometric results were then averaged on a nightly basis to calculate r-band magnitudes at 185 selected epochs: 16 in 2006, 94 in 2007−2009, and 75 in 2013−2016 (including the complete 2016 season, until 14 December). Throughout the period from 2007 to 2016, we only discarded 25 epochs (nights) in which our quality requirements (FWHM < 1.′′ 75 and S∕N > 100) were not met. Hence, we have robotically observed QSO B2237+0305 with an efficiency reaching almost 90%. Typical errors in the light curves of A-D and field stars were estimated following the procedure at the end of Sect. 2 of Goicoechea & Shalyapin (2010). This led to uncertainties of 0.011, 0.027, 0.053, and 0.026 mag for the A, B, C, and D images, respectively. Errors at every epoch were computed by using two weighting factors. Apart from the ⟨S/N⟩/S/N ratio (e.g. Howell 2006), we also considered the ratio between the flux of each source and its mean value, so the error in a high-flux state is less than that in a low-flux state. In more detail, the physically motivated flux factor was 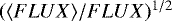 , and it played a significant role in determining uncertainties in the brightness records of C and D (see Fig. 14).
The LT r-band dataset covering the period 2006 to 2016 (there is a gap of about 1300 d between the end of the first monitoring phase with RATCam and the beginning of the second phase with IO:O) is available in Table 16 at the CDS: Column 1 lists the observing date (MJD−50 000), and Cols. 2−3, 4−5, 6−7, 8−9, and 10−11 present the magnitudes and magnitude errors of A, B, C, D, and the control star, respectively. These photometric results are also displayed in Fig. 14. Depending on the star used as PSF tracer and photometric reference (γ or α), we took α or β (Corrigan et al. 1991)as control star. Therefore, Table 16 (Col. 10) and Fig. 14 (black circles) show the magnitudes of the star α and the shifted magnitudes of the star β (taking an offset ⟨αr − βr⟩~ 0.6 mag into account). Time delays in QSO B2237+0305 are shorter than four days (Vakulik et al. 2006), which allows for a direct comparison between the curves of the four quasar images. We find sharp, uncorrelated brightness variations that are thought to be due to stars in the central bulge of the face-on spiral galaxy acting as a gravitational lens. These individual events and the full light curves including additional microlensing variations can be used to prove, among other things, the structure of the inner accretion flow in the distant quasar and the average stellar mass in the bulge of the nearby spiral galaxy (e.g. Shalyapin et al. 2002; Kochanek 2004). From 2009 onwards, the LT light curves are particularly relevant, since the OGLE collaboration stopped offering photometric data of the quadruple quasar at the beginning of the 2009 season.
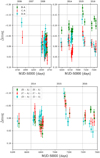 |
Fig. 13 DLCs of QSO B1413+117 from LT observations in the r-band. To construct the DLCs in the top panel, the light curves of the B-D images have been shifted by the time delays and magnitude offsets relative to the image A, and the original brightness record of A haslater been subtracted from the shifted curves (only BA, CA, and DA pairs separated by ≤7 d were considered to compute the differences). Bottom panel: recent mean-subtracted DLCs. |
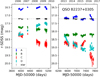 |
Fig. 14 LT r-band light curves of QSO B2237+0305. Left panel: RATCam data at 110 selected epochs over the period 2006−2009. Right panel: IO:O data at 75 selected epochs in 2013−2016. Magnitudes of the control star are also shown for comparison (see main text). |
4 Summary and prospects
We are constructing a publicly available database of ten optically bright GLQs in the northern hemisphere. This is fed with materials from a long-term observing programme started in 1999. The central idea behind the observational effort is to perform an accurate follow-up of each lens system over 10−30 yr, using mainly the cameras, polarimeters, and spectrographs on the GTC and LT facilities at the RMO (see Table 1). Such a long programme is required, among other things, to find periods of high microlensing activity in most targets (Mosquera & Kochanek 2011). The database currently incorporates ~6600 processed frames of 9 GLQs in the period 1999−2016 (see Tables 2 and 3), and we intend to reach the 10 000 frames in the next update of the archive (late 2019/early 2020). We remark that this is a singular initiative in the research field of GLQs, since other groups do not offer freely accessible well-structured archives with a variety of astronomical materials this rich. In addition to frames that are ready for astrometric and photometric tasks, spectral extractions, or polarisation measurements, this paper also presents high-level data products for six of the ten objects in the GLQ sample: QSO B0909+532, FBQS J0951+2635, QSO B0957+561, SDSS J1001+5027, QSO B1413+117, and QSO B2237+0305. We have published results for two objects in the sample in the last year. GTC-LT data provided evidence of two extreme cases of microlensing activity in two double quasars at z ~ 2 (SDSS J1339+1310 and SDSS J1515+1511; Goicoechea & Shalyapin 2016; Shalyapin & Goicoechea 2017). In addition, PS J0147+4630 has been discovered very recently (Berghea et al. 2017; Lee 2017; Rubin et al. 2018) and is being monitored with the LT since August 2017. We are also completing a detailed analysis of several physical properties of SDSS J1442+4055 (e.g. the time delay between quasar images and the redshift of the primary lensing galaxy; see Table 2), which will be presented in a subsequent paper.
Our main results for the six individual objects are listed below.
QSO B0909+532. We extend previously-published r-band brightness records (covering the period from 2005 through early 2012; Hainline et al. 2013) by adding new LT magnitudes in the period 2012−2016. The global LT light curves in the r-band are available in Table 4 at the CDS. In recent years (2012−2016), we detected microlensing variations with an amplitude of ~0.1 mag, which might be useful to improve the Hainline et al. constraint on the size of the r-band continuum source. We note that our database also contains recent g-band frames (see Table 3).
FBQS J0951+2635. Table 5 at the CDS incorporates LT-NOT-MAO r-band light curves covering 2001 to 2016. Despite the relatively low cadence of observations and the existence of a gap of ~1000 d, these data are critical to trace the long-timescale microlensing event in the system (Paraficz et al. 2006; Shalyapin et al. 2009). The single-epoch magnitude differences A − B have evolved from a value close to −1.1 mag in March 2002 to −1.4 mag in January 2016, and this last r-band difference coincides with the single-epoch flux ratio of the Mg II emission line (Jakobsson et al. 2005).
QSO B0957+561. Table 6 at the CDS shows IAC80-LT r-band brightness records spanning about 21 yr (1996−2016). These records reveal the presence of an ongoing microlensing event, which offers a long-awaited opportunity to simultaneously measure the size of the g- and r-band continuum sources (the database includes frames in both passbands; see Table 3), as well as the mass distribution in the cD galaxy acting as a gravitational lens. We are now starting to use our two-colour light curves of the first GLQ to obtain information on the structure of sources and lens. The future constraints on size of sources will be compared to current results from microlensing analyses (e.g. Refsdal et al. 2000; Hainline et al. 2012) and reverberation mapping techniques (Gil-Merino et al. 2012; Goicoechea et al. 2012). The main results from LT polarimetric observationsare presented in Table 7. The optical polarisation degree of the two quasar images is <1% over the monitoring campaign from late 2011 to early 2017, where the A image has a larger polarisation amplitude of ~0.5% (for the B image, the amplitude is consistent with zero; see, however, very early measures by Wills et al. 1980). In Sect. 3.2.3 (Overview), we proposed a scenario that may explain this “polarisation excess” in A in addition to other observed “anomalies”. Tables 8 and 9 at the CDS include LT spectra in 2010−2017, while Tables 10 and 11 at the CDS incorporate NOT spectra in 2010−2013. This spectroscopic follow-up allows us to unambiguously confirm that the Mg II and C III] emitting regions do not suffer dust extinction or microlensing effects, since the Mg II and C III] flux ratios over the past 30 yr are in very good agreement with those obtained at MIR and radio wavelengths (see subsections on spectroscopy and deep NIR imaging in Sect. 3.2.3). New photometric solutions in the JHK-bands are also shown in Table 12.
SDSS J1001+5027. Tables Table 13 and Table 14 at the CDS contain LT spectra covering the period November 2013 to December2016. These data along with results in the discovery paper (Oguri et al. 2005), NIR magnitudes (Rusu et al. 2016) and spectra in the SDSS database favour the presence of a compact dusty cloud along the line of sight of B, although other scenarios cannot be completely ruled out. The ongoing spectroscopic programme will be continued in the coming years to try to distinguish contamination, dust extinction, and macro- and micro-lens magnification effects.
QSO B1413+117. New LT light curves in the r-band (in 2006 and 2013−2016) are available in Table 15 at the CDS. These complement previous r-band magnitudes spanning several months in 2008 (Goicoechea & Shalyapin 2010). We detect microlensing activity between 2006 and 2008, as well as between 2008 and 2013−2016. Additionally, it is worth mentioning that we find a microlensing event in the A image during 2014−2015. Such extrinsic variation has an amplitude exceeding 0.1 mag, while its duration is between 1 and 12 months.
QSO B2237+0305. Table 16 at the CDS shows LT r-band brightness records over two four-year intervals: 2006−2009 and 2013−2016, which have plenty of microlensing variability. These light curves and additional data in the g-band (see Table 3) are promising tools to improve knowledge on the structure of the accretion disc in the distant quasar and the composition of the bulge of the spiral lens galaxy at z < 0.1 (e.g. Kochanek 2004). The second data interval (2013−2016) has a special relevance because there are no OGLE V -band magnitudes in recent years.
The final GLQ database in the second half of the 2020s will help astronomers to delve deeply into the structure of distant active galactic nuclei, the mass distribution in galaxies at different redshifts and the cosmological parameters (e.g. Schneider et al. 1992, 2006). In addition to frames for the ten targets in the GLQ sample, the GLENDAMA global archive will also include observationsof binary quasars and other non-lensed objects, and even of newly discovered GLQs where one or more images are fainter than r = 20 mag (e.g.SDSS J1617+3827). In addition to the current telescopes at the RMO, we will try to use the successor of the LT (LT2; Copperwheat et al. 2015) and the World Space Observatory-Ultraviolet (WSO-UV; Shustov et al. 2014). These two new facilities will be operational in the first half of the next decade, and the UV space telescope may provide details on continuum sources in the surroundings of supermassive black holes. So far, the optical polarimetry has mainly been focused on a widely separated GLQ (QSO B0957+561). However, our database also contains broad-band polarimetric observations with the LT of three other systems with Δ θ ~ 2−3′′: SDSS J1001+5027, SDSS J1339+1310, and QSO B2237+0305, and we are developing a new method for reducing these frames (pixel size of ~0.′′45 and normal seeing conditions). We will also try to measure polarisations with better spatial resolution at telescopes other than the LT. Whereas V -band polarisation degrees of some unresolved GLQs were obtained by Hutsemékers et al. (1998) and Sluse et al. (2005), Chae et al. (2001) and Hutsemékers et al. (2010) determined V -band polarisations of the four images of QSO B1413+117 through observations at high spatial resolution.
We add a remark on the expected role of our GLQ database in cosmological studies. Seventy percent of the targets are being photometrically monitored in an intensive way at certain periods, which will allow users to determine delays between images in different time segments throughout the entire duration of the project. This procedure is useful for checking time-segment-dependent biases (e.g. Tewes et al. 2013; Tie & Kochanek 2018) and obtaining unbiased measures of time delays for cosmology. As shown by Shalyapin et al. (2012) (see also Kundić et al. 1997), chromatic biases are also possible, that is, different time delays at different wavelengths, and thus the final archive will incorporate data to check for chromaticity in delays of at least three systems. Robustly measured delays from the new database (see current results in Table 2) and other ongoing monitoring campaigns (e.g. the COSMOGRAIL project17) will shed light on an unbiased value of H0 and additional cosmological quantities. Despite this optimistic perspective, some problems remain, and they need to be fixed. For example, the spectroscopic redshift of the main lens in QSO B1413+117 is unknown. One must also avoid the bias introduced by unaccounted mass along GLQ sightlines, since H0 can be noticeably overestimated when line-of-sight deflectors are ignored (e.g. Wilson et al. 2017). Finally, the overall experience gained from ongoing projects will be a basic tool to decide on future time-domain observations of large collections of GLQs, which will lead to robust estimates of H0, as well as the amount of dark matter and dark energy in the Universe (e.g. Oguri & Marshall 2010; Treu & Marshall 2016).
Acknowledgements
We thank the anonymous referee for carefully reading our long manuscript and for several useful comments. We also thank the Universidad de Cantabria (UC) web service for making it possible the GLENDAMA global archive. We acknowledge A. Ullán for doing observations with the Telescopio Nazionale Galileo (TNG) and processing raw frames of the Gravitational Lenses International Time Project. We are indebted to C.J. Davis, J. Marchant, C. Moss and R.J. Smith for guidance in the preparation of the robotic monitoring programme with the Liverpool Telescope (LT). We also acknowledge the staff of the LT for their development of the Phase 2 User Interface (which allows users to specify in detail the observations they wish the LT to make) and data reduction pipelines. The LT is operated on the island of La Palma by Liverpool John Moores University in the Spanish Observatorio del Roque de los Muchachos (ORM) of the Instituto de Astrofísica de Canarias (IAC) with financial support from the UK Science and Technology Facilities Council. We thank the support astronomers and other staff of the observatories in the Canary Islands (J.A. Acosta, C. Alvarez, T. Augusteijn, R. Barrena, A. Cabrera, R.J. Cárdenes, R.Corradi, J. García, T. Granzer, J. Méndez, P. Montañés, T. Pursimo, R. Rutten, M. R. Zapatero and C. Zurita, among others) for kind interactions regarding several observing programmes at the ORM and the Observatorio del Teide (OT). Based on observations made with the Gran Telescopio Canarias, installed at the Spanish ORM of the IAC, in the island of La Palma. This archive is also based on observations made with the Isaac Newton Group of Telescopes (Isaac Newton and William Herschel Telescopes), the Nordic Optical Telescope and the Italian TNG, operated on the island of La Palma by the Isaac Newton Group, the Nordic Optical Telescope Scientific Association and the Fundación Galileo Galilei of the Istituto Nazionale di Astrofisica, respectively, in the Spanish ORM of the IAC. We also use frames taken with the IAC80 and STELLA 1 Telescopes operated on the island of Tenerife by the IAC and the AIP in the Spanish OT. We also thank the staff of the Chandra X-ray Observatory (CXO; E. Kellogg, H. Tananbaum and S.J. Wolk) and Swift Multi-wavelength Observatory (SMO; M. Chester and N. Gehrels) for their support during the preparation and execution of the monitoring campaign of QSO B0957+561 in 2010. The CXO Center is operated by the Smithsonian Astrophysical Observatory for and on behalf of the National Aeronautics and Space Administration (NASA) under contract NAS803060. The SMO issupported at Penn State University by NASA contract NAS5-00136. This publication makes use of data products from the Two Micron All Sky Survey (2MASS), which is a joint project of the University of Massachusetts and the Infrared Processing and Analysis Center/California Institute of Technology, funded by the NASA and the National Science Foundation. We also used data taken from the Sloan Digital Sky Survey (SDSS) database. SDSS is managed by the Astrophysical Research Consortium for the Participating Institutions of the SDSS Collaboration. The SDSS web site is www.sdss.org. Funding for the SDSS has been provided by the Alfred P. Sloan Foundation, the Participating Institutions, and national agencies in the U.S. and other countries. SDSS acknowledges support and resources from the Center for High-Performance Computing at the University of Utah. We are grateful to both collaborations (2MASS and SDSS) for doing those public databases. The construction of the archive has been supported by the GLENDAMA project and a few complementary actions: PB97-0220-C02, AYA2000-2111-E, AYA2001-1647-C02-02, AYA2004-08243-C03-02, AYA2007-67342-C03-02, AYA2010-21741-C03-03, and AYA2013-47744-C3-2-P, all them financed by Spanish Departments of Education, Science, Technology and Innovation, “Lentes Gravitatorias y Materia Oscura” financed by the SOciedad para el DEsarrollo Regional de CANtabria (SODERCAN S.A.) and the Operational Programme of FEDER-UE, and AYA2017-89815-P financed by MINECO/AEI/FEDER-UE. R.G.M. acknowledges grants of the AYA2010-21741-C03-03 and AYA2013-47744-C3-2-P subprojects to develop the core software of the database. This archive has also been possible because of the support of the UC.
Appendix A Pilot programme for QSO B0957+561: data analysis
A.1 Flux ratio in the r-band
Instead of the magnitudes in Table 6, we used the corresponding fluxes (in mJy) and a time delay of 420 d to study the delay-corrected flux ratio B∕A in the r-band. To evaluate this ratio at different epochs, we compared the fluxes of the B image and the fluxes of the A image shifted by +420 d. Because the shifted epochs of A generally do not coincide with those of B, we made bins in A around the epochs of B. These bins had semisizes α = 1−12 d. Shalyapin et al. (2012) considered four time segments (observing seasons) of B that were called TS1, TS2, TS3, and TS4, and in this paper, we extend our previous analysis by incorporating 16 additional segments (see Table A.1). We note that TS0 corresponds to the season 2005/2006, in which the transition from IAC80 Telescope to LT took place.
We useda χ2 minimisation to find the flux ratio for each time segment. In Table A.1, we give the best solutions and their reduced chi-square values. Table A.1 also contains the 2σ intervals for B∕A, where each interval includes all values of B∕A satisfying the condition  + 4. We obtained
  /dof ~ 2−3 for the segments TS4, TS7, and TS10, and thus the formal uncertainties for these periods should be taken with caution. The AB comparisons for the 20 time segments, that is, from TS-9 to TS10, are shown in the panels of Fig. A.1. Taking the best solutions of B∕A to amplify/reduce the time-delay shifted signal A, both A and B signals are compared to each other in these panels (A = filled circles and B = open red circles). If we exclusively focus on the LT photometry during the last ten years, our simple scenario (B∕A is constant within each segment) does not work on TS4, TS7, and TS10. In addition to best solutions associated with reduced chi-square values ranging from 2 to 2.8, we see some anomalies in these periods. The simple scenario does not convincingly explain the observations, since the variations in A seem to be smoother than those in B (see Fig. A.1).
A.2 Broad-band polarimetric follow-up
To carry out photometric and polarimetric reduction of RINGO2 data (three epochs; see imaging polarimetry in Sect. 3.2.3), we firstly extracted instrumental fluxes (in counts) of objects of interest in each of the eight stacked frames at each epoch. The fluxes were extracted on the 24 frames using IMFITFITS. The IMFITFITSsoftware produced PSF fitting photometry of the two quasar images and several field stars. Although the RINGO2 re-imaging optics causes a PSF depending on the position in the field (Steele et al. 2017), this effect does not seem very relevant in our study. The PSF star and the fitted objects are separated by only ≤1′, and some aperture photometry tests with field stars led to polarisation parameters similar to those from PSF fitting. In general, aperture photometry is the best method to extract fluxes, but here we study a crowded region. In a second step, the eight fluxes per object at each epoch were used to calculate the corresponding normalised Stokes parameters (q = Q∕I, u = U∕I). We combined measurements according to the equations in Clarke & Neumayer (2002) and Jermak (2016). However, these Stokes parameters must be corrected from instrumental (device-dependent) biases to obtain the true polarisation. For example, Jermak (2016) and Steele et al. (2017) reported on different mean instrumental polarisations over four periods of time, and our observations were performed during the third period they studied. After comparing the (q, u) values for the H field star and parameter distributions of standard zero-polarised stars, we reasonably assumed that the H star is an unpolarised object. At each epoch, the instrumental polarisation (qH, uH) was then subtracted from the (q, u) values of the quasar images.
Long-term evolution of the r-band flux ratio B∕A.
There is a second main instrumental effect: depolarisation of the signal. To account for this additional issue, we analysed RINGO2 data of the standard polarised star VICyg12 (e.g. Schmidt et al. 1992). Available sets of (eight) frames for different sky position angles (ROTSKY PA values) allowed us to plot the q − u diagram in the top panel of Fig. A.2. After subtracting the instrumental polarisation and removing an elliptical distortion in the distribution of shifted (q, u) values, corrected data were spread along a ring centred at the origin of the q − u plane (see the middle panel of Fig. A.2). The radius of this ring yielded the (measured) polarisation degree PDmeas for the polarised star and led to a depolarisation factor F = PDmeas∕PDtrue = 0.76 (see also Jermak 2016). When rotating a set of frames by an angle ϕ, the associated polarisation will appear rotated through an angle 2ϕ, that is, qϕ = qcos(2ϕ) + usin(2ϕ) and uϕ = −qsin(2ϕ) + ucos(2ϕ). Hence, all data were de-rotated using the known values of ROTSKY PA (ϕ = −ROTSKY PA; see the bottom panel of Fig. A.2). The measured polarisation angle (PAmeas) did not coincide with the true one, and we found PAtrue = PAmeas + K, where K = 42° (e.g. Steele et al. 2017, who estimated K = 41 ± 3° in the period of interest). As a last step in the reduction of RINGO2 observations of QSO B0957+561, we have corrected the depolarisation bias in our science data (quasar images). More specifically, after removing the instrumental polarisation bias, the (q, u) values of A and B were de-rotated through angles 2ϕ = −2(ROTSKY PA + K), and then divided by F (see Fig. A.3).
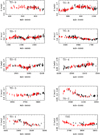 |
Fig. A.1 AB comparisons in the r-band. We show overlapping periods between the flux records of A (filled circles) and B (open red circles), where the fluxes of A are shifted by +420 d and properly amplified/reduced (see main text). |
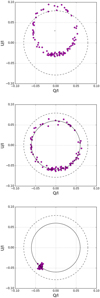 |
Fig. A.2 RINGO2 data of the polarised star VICyg12. The radius of the dashed open circles is the true polarisation degree, and the radius of the solid open circles is the measured polarisation degree. Top panel: instrumental Stokes parameters (q = Q∕I, u = U∕I) for 103 values of the sky position angle (observations between May 2011 and March 2012). All data points are distributed in a ring around the instrumental polarisation (cross). In the middle panel, the centre of the distribution is shifted to the origin (0, 0) by subtracting the instrumental polarisation (an elliptical distortion is also corrected). In the bottom panel, the data are de-rotated using the sky position angles associated with them. |
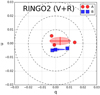 |
Fig. A.3 RINGO2 data of QSO B0957+561. The Stokes parameters (q, u) of A and B at the three observing epochs are corrected for instrumental polarisation and depolarisation effects (see main text). We also display the means and root-mean-square deviations of both parameters for each quasar image (crosses and ellipses), as well as dashed open circles representing three different polarisation degrees: 1%, 2% and 3%. |
The reduction procedures of RINGO3 data were similar to those used to reduce RINGO2 observations. However, RINGO3 is a three-band optical polarimeter, so we obtained three sets of eight stacked frames at 16 observing epochs (see Sect. 3.2.3). The three bands are labelled B (blue), G (green), and R (red), and they differ from standard ugriz and UBV RI passbands. In each optical band, the photometric outputs for a given object led to its instrumental Stokes parameters at all epochs. Unfortunately, the RINGO3 hardware was changed four times during our polarimetric follow-up between 2013 and 2017, which forced us to split the data into five periods and analyse the instrumental biases within each individual period. To discuss the instrumental polarisations, we used available observations of the standard zero-polarised stars G191B2B and BD+28°4211 (e.g. Schmidt et al. 1992), and our data for the unpolarised field star H. As both standard stars showed a similar behaviour, we focused on the comparison between G191B2B and H. In Fig. A.4, we illustrate the time evolution of the instrumental polarisation in each band (see also Jermak 2016). The vertical solid lines represent epochs in which there were hardware updates, while the vertical dotted lines correspond to the observing dates. In the three last periods, our estimates of instrumental polarisations from G191B2B data (red circles and blue squares) agree well with the Stokes parameters for H (magenta and cyan stars) and the instrumental polarisation offsets in the Jermak PhD thesis (horizontal dotted lines). However, in the two first periods (before fitting a depolarising Lyot prism in December 2013), there appear discrepancies between results from the G191B2B and H stars. The (qH, uH) values are the best tracers of the polarisation bias, since the H field star was observed in the same conditions as quasar images.
In order to remove the instrumental polarisation bias at a given epoch, we subtracted (qH, uH) for each of the three bands of the RINGO3 polarimeter in this epoch from the instrumental Stokes parameters of the quasar images. To correct for elliptical distortion, a multiplicative factor of 1.14 was also applied to the shifted values of qA and qB. In addition, we studied depolarisation factors (and K values) using RINGO3 data of standard polarised stars, and we confirmed the Jermak results for the last three periods. Therefore, averaging over the three bands, we took K = 55, 115.5, and 125° in the third, fourth, and fifth time segments in Fig. A.4. Averaging over the three bands and these three time segments, F was also taken to be equal to 0.96. Słowikowska et al. (2016) proved that the values of K and F for the two first periods are very similar to those for the third period (using a method different from ours; see below), and consequently, we adopted K = 55° and F = 0.96 in the two initial time segments in Fig. A.4. Our results in these initial phases of the instrument should be considered with caution. In fact, Jermak (2016) suggested the instrumental polarisation is not constrainable during the two first periods, and she exclusively focused on the other periods. We note that Słowikowska et al. (2016) discussed Stokes parameters in all time segments, but their results are based on a different method. We (and Jermak) used the Clarke & Neumayer (2002) framework, which assumes the same polaroid at eight different angles. However, Słowikowska et al. (2016) considered eight different polaroids (the n-polarizer method of Sparks & Axon 1999). Finally, the quasar polarisations were de-rotated through angles 2ϕ = −2(ROTSKY PA + K) and divided by F (see Fig. A.5).
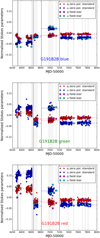 |
Fig. A.4 RINGO3 data of the standard zero-polarised star G191B2B and the unpolarised field star H. Top, middle, and bottom panels: results in the blue, green, and red bands, respectively. We depict the observing dates (vertical dotted lines) and when hardware updates occurred (vertical solid lines), as well as the Stokes parameters for G191B2B (filled circles and squares) and H (filled stars). The horizontal dashed lines represent average parameters of G191B2B (these would be equal to zero for an ideal instrument), and the horizontal dotted lines are the instrumental polarisation offsets reported in Jermak (2016). |
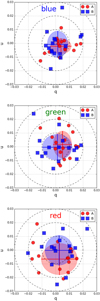 |
Fig. A.5 RINGO3 data of QSO B0957+561. The Stokes parameters (qA, uA) and (qB, uB) are corrected for instrumental polarisation and depolarisation biases (see main text). In each band, we show the means and root-mean-square deviations of the Stokes parameters for each quasar image (crosses and ellipses), and the 1%, 2%, and 3% polarisation rings (dashed open circles). |
Mg II line fluxes in 2010−2017.
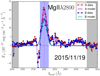 |
Fig. A.6 Mg II emission line profiles on 19 November 2015. We also display Gaussian fits to the regions of 40 Å width centred at 2800 Å (blue rectangle), and highlight the continuum windows to the left and right of the Mg II line (grey rectangles). See main text for details. |
A.3 Emission-line fluxes
We obtained the profiles of the Mg II emission line in our FRODOSpec and SPRAT data (see Spectroscopy in Sect. 3.2.3) after de-redshifting the spectra to their rest frame (z = 1.414) and converting wavelengths from air into vacuum conditions and then subtracting the underlying continuum. This underlying signal was determined by linear interpolation between two continuum regions to both sides of the line, that is, using a region to the left (2650−2680 Å) and another region to the right (3000−3050 Å). The profiles corresponding to SPRAT data on 19 November 2015 are plotted in Fig. A.6. To avoid a strong Mg IIabsorption feature and contamination by other emissions, Mg II emission-line fluxes were estimated by integrating the profiles over 40 Å intervals centred at 2800 Å. Central regions with this 40 Å width were also fitted to a Gaussian distribution (see Fig. A.6), and the Gaussian fits produced fluxes similar to those from direct integrations. Table A.2 displays details on the analysis of the Mg II emission over this decade, and its last three columns describe the Mg II emission-line fluxes of A and B, and the single-epoch flux ratios.
We also calculated C III] and C IV emission-line fluxes (and single-epoch flux ratios) from the available SPRAT and NOT/ALFOSC spectra in Tables 9−11. For the C III] emission at 1909 Å, the underlying continua were obtained through linear interpolations between data at 1760−1830 and 1980−2050 Å, while for the C IV emission at 1549 Å, we used the 1450−1460 and 1710−1730 Å continuum regions. After subtracting the continua under the C III] and C IV emission lines, the line fluxes were computed by integrating the line profiles over their central regions of 40 Å width. The results for the C III] and C IV emissions are presented in Tables A.3 and A.4, respectively.
C III] line fluxes in 2010−2017.
C IV line fluxes in 2010−2013.
Appendix B Analysis of new spectra of SDSS J1001+5027
The new FRODOSpec spectra (Table 13) contain the Mg II emission line, while the SPRAT spectra (Table 14) include the C III] and C IV emissions. Thus, the procedure used for analysing these data was identical with that used in Sect. A.3. Working in the
quasar rest frame (z = 1.838), we obtained line profiles by subtracting their underlying continua. In Sect. A.3, we describe the continuum regions to perform linear interpolations and estimate underlying signals. As a last step, the emission-line fluxes were calculated by integrating the profiles over their 40 Å width central regions. Tables B.1–B.3 show continuum and emission-line fluxes of A and B, as well as single-epoch flux ratios.
Mg II line fluxes of SDSS J1001+5027.
C III] line fluxes of SDSS J1001+5027.
C IV line fluxes of SDSS J1001+5027.
References
- Abolmasov, P., & Shakura, N. I. 2012, MNRAS, 423, 676 [NASA ADS] [CrossRef] [Google Scholar]
- Ahn, C. P., Alexandroff, R., Allende Prieto, C., et al. 2012, ApJS, 203, 21 [NASA ADS] [CrossRef] [Google Scholar]
- Ahn, C. P., Alexandroff, R., Allende Prieto, C., et al. 2014, ApJS, 211, 17 [NASA ADS] [CrossRef] [Google Scholar]
- Akhunov, T. A., Wertz, O., Elyiv, A., et al. 2017, MNRAS, 465, 3607 [NASA ADS] [CrossRef] [Google Scholar]
- Alcalde, D., Mediavilla, E., Moreau, O., et al. 2002, ApJ, 572, 729 [NASA ADS] [CrossRef] [Google Scholar]
- Alexandrov, A. N., & Zhdanov, V. I. 2011, MNRAS, 417, 541 [NASA ADS] [CrossRef] [Google Scholar]
- Alvarez, P., Castro López-Tarruella, J., & Rodriguez-Espinosa, J. M. 2006, Proc. SPIE, 6267, A08 [Google Scholar]
- Anguita, T., Faure, C., Yonehara, A., et al. 2008, A&A, 481, 615 [NASA ADS] [CrossRef] [EDP Sciences] [Google Scholar]
- Antonucci, R. 1993, ARA&A, 31, 473 [Google Scholar]
- Arnold, D. M., Steele, I. A., Bates, S. D., Mottram, C. J., & Smith, R. J. 2012, Proc. SPIE, 8446, 2 [Google Scholar]
- Assef, R. J., Denney, K. D., Kochanek, C. S., et al. 2011, ApJ, 742, 93 [NASA ADS] [CrossRef] [Google Scholar]
- Barnsley, R. M., Smith, R. J., & Steele, I. A. 2012, Astron. Nachr., 333, 101 [NASA ADS] [CrossRef] [Google Scholar]
- Berghea, C. T., Nelson, G. J., Rusu, C. E., Keeton, C. R., & Dudik, R. P. 2017, ApJ, 844, 90 [NASA ADS] [CrossRef] [Google Scholar]
- Bernstein, G., Fischer, P., Tyson, J. A., & Rhee, G. 1997, ApJ, 483, L79 [NASA ADS] [CrossRef] [Google Scholar]
- Bogdanov, M. B., & Cherepashchuk, A. M. 2004, Astron. Rep., 48, 261 [NASA ADS] [CrossRef] [Google Scholar]
- Bonvin, V., Tewes, M., Courbin, F., et al. 2016, A&A, 585, 88 [Google Scholar]
- Bonvin, V., Courbin, F., Suyu, S. H., et al. 2017, MNRAS, 465, 4914 [NASA ADS] [CrossRef] [Google Scholar]
- Born, M., & Wolf, E. 1999, Principles of Optics (Cambridge: Cambridge University Press) [Google Scholar]
- Borra, E. F., Levesque, S., Beauchemin, M., et al. 1996, AJ, 111, 1456 [NASA ADS] [CrossRef] [Google Scholar]
- Canovas, H., Rodenhuis, M., Jeffers, S. V., Min, M., & Keller, C. U. 2011, A&A, 531, 102 [Google Scholar]
- Chae, K.-H., Turnshek, D. A., Schulte-Ladbeck, R. E., Rao, S. M., & Lupie, O. L. 2001, ApJ, 561, 653 [NASA ADS] [CrossRef] [Google Scholar]
- Clarke, D., & Neumayer, D. 2002, A&A, 383, 360 [NASA ADS] [CrossRef] [EDP Sciences] [Google Scholar]
- Colley, W. N., Schild, R. E., Abajas, C., et al. 2003, ApJ, 587, 71 [NASA ADS] [CrossRef] [Google Scholar]
- Copperwheat, C. M., Steele, I. A., Barnsley, R. M., et al. 2015, Exp. Astron., 39, 119 [NASA ADS] [CrossRef] [Google Scholar]
- Corrigan, R. T., Irwin, M. J., Arnaud, J., et al. 1991, AJ, 102, 34 [NASA ADS] [CrossRef] [Google Scholar]
- Dolan, J. F., Michalitsianos, A. G., Thompson, R. W., et al. 1995, ApJ, 442, 87 [NASA ADS] [CrossRef] [Google Scholar]
- Eigenbrod, A., Courbin, F., & Meylan, G. 2007, A&A, 465, 51 [NASA ADS] [CrossRef] [EDP Sciences] [Google Scholar]
- Eigenbrod, A., Courbin, F., Meylan, G., et al. 2008, A&A, 490, 933 [NASA ADS] [CrossRef] [EDP Sciences] [Google Scholar]
- Elíasdóttir, Á., Hjorth, J., Toft, S., Burud, I., & Paraficz, D. 2006, ApJS, 166, 443 [NASA ADS] [CrossRef] [Google Scholar]
- Fadely, R., Keeton, C. R., Nakajima, R., & Bernstein, G. M. 2010, ApJ, 711, 246 [NASA ADS] [CrossRef] [Google Scholar]
- Fausnaugh, M. M., Denney, K. D., Barth, A. J., et al. 2016, ApJ, 821, 56 [NASA ADS] [CrossRef] [Google Scholar]
- Ferland, G. J. 2003, ARA&A, 41, 517 [NASA ADS] [CrossRef] [Google Scholar]
- Ferland, G. J., Korista, K. T., Verner, D. A., et al. 1998, PASP, 110, 761 [Google Scholar]
- Filippenko, A. V. 1982, PASP, 94, 715 [NASA ADS] [CrossRef] [Google Scholar]
- Fohlmeister, J., Kochanek, C. S., Falco, E. E., et al. 2007, ApJ, 662, 62 [NASA ADS] [CrossRef] [Google Scholar]
- Garrett, M. A., Calder, R. J., Porcas, R. W., et al. 1994, MNRAS, 270, 457 [NASA ADS] [CrossRef] [Google Scholar]
- Gavazzi, R., Treu, T., Marshall, P. J., Brault, F., & Ruff, A. 2012, ApJ, 761, 170 [NASA ADS] [CrossRef] [Google Scholar]
- Gaynullina, E.R., Schmidt, R. W., Akhunov, T., et al. 2005, A&A, 440, 53 [NASA ADS] [CrossRef] [EDP Sciences] [Google Scholar]
- Gilliland, R. L., & Brown, T. M. 1988, PASP, 100, 754 [NASA ADS] [CrossRef] [Google Scholar]
- Gil-Merino, R., González-Cadelo, J., Goicoechea, L. J., Shalyapin, V. N., & Lewis, G. F. 2006, MNRAS, 371, 1478 [NASA ADS] [CrossRef] [Google Scholar]
- Gil-Merino, R., Goicoechea, L. J., Shalyapin, V. N., & Braga, V. F. 2012, ApJ, 744, 47 [NASA ADS] [CrossRef] [Google Scholar]
- Goicoechea, L. J., & Shalyapin, V. N. 2010, ApJ, 708, 995 [NASA ADS] [CrossRef] [Google Scholar]
- Goicoechea, L. J., & Shalyapin, V. N. 2016, A&A, 596, 77 [Google Scholar]
- Goicoechea, L. J., Alcalde, D., Mediavilla, E., & Muñoz, J. A. 2003, A&A, 397, 517 [NASA ADS] [CrossRef] [EDP Sciences] [Google Scholar]
- Goicoechea, L. J., Gil-Merino, R., & Ullán, A. 2005, MNRAS, 360, L60 [NASA ADS] [CrossRef] [Google Scholar]
- Goicoechea, L. J., Shalyapin, V. N., Koptelova, E., et al. 2008, New Astron., 13, 182 [NASA ADS] [CrossRef] [Google Scholar]
- Goicoechea, L. J., Shalyapin, V. N., Gil-Merino, R., & Braga, V. F. 2012, J. Phys. Conf. Ser., 372, 012058 [CrossRef] [Google Scholar]
- Guerras, E., Mediavilla, E., Jiménez-Vicente, J., et al. 2013, ApJ, 764, 160 [NASA ADS] [CrossRef] [Google Scholar]
- Hainline, L. J., Morgan, C. W., Beach, J. N., et al. 2012, ApJ, 744, 104 [NASA ADS] [CrossRef] [Google Scholar]
- Hainline, L. J., Morgan, C. W., MacLeod, C. L., et al. 2013, ApJ, 774, 69 [NASA ADS] [CrossRef] [Google Scholar]
- Hennawi, J. F., Strauss, M. A., Oguri, M., et al. 2006, AJ, 131, 1 [NASA ADS] [CrossRef] [Google Scholar]
- Hennawi, J. F., Myers, A. D., Shen, Y., et al. 2010, ApJ, 719, 1672 [NASA ADS] [CrossRef] [Google Scholar]
- Howell, S. B. 2006, Handbook of CCD Astronomy (Cambridge: Cambridge University Press) [CrossRef] [Google Scholar]
- Huchra, J., Gorenstein, M., Kent, S., et al. 1985, AJ, 90, 691 [NASA ADS] [CrossRef] [Google Scholar]
- Hutsemékers, D., Lamy, H., & Remy, M. 1998, A&A, 340, 371 [NASA ADS] [Google Scholar]
- Hutsemékers, D., Borguet, B., Sluse, D., Riaud, P., & Anguita, T. 2010, A&A, 519, 103 [Google Scholar]
- Inada, N., Oguri, M., Shin, M., et al. 2009, AJ, 137, 4118 [NASA ADS] [CrossRef] [Google Scholar]
- Inada, N., Oguri, M., Shin, M.-S., et al. 2012, AJ, 143, 119 [NASA ADS] [CrossRef] [Google Scholar]
- Inada, N., Oguri, M., Rusu, C. E., Kayo, I., & Morokuma, T. 2014, AJ, 147, 153 [NASA ADS] [CrossRef] [Google Scholar]
- Jackson, N. 2015, Liv. Rev. Rel., 18, 2 [CrossRef] [Google Scholar]
- Jakobsson, P., Hjorth, J., Burud, I., et al. 2005, A&A, 431, 103 [Google Scholar]
- Jermak, H. E. 2016, PhD Thesis, Liverpool John Moores University, available at http://researchonline.ljmu.ac.uk/5462/1/2017jermakphd.pdf [Google Scholar]
- Keeton, C. R., Kochanek, C. S., & Falco, E. E. 1998, ApJ, 509, 561 [NASA ADS] [CrossRef] [Google Scholar]
- Keeton, C. R., Falco, E. E., Impey, C. D., et al. 2000, ApJ, 542, 74 [NASA ADS] [CrossRef] [Google Scholar]
- Kneib, J.-P., Alloin, D., & Pelló, R. 1998, A&A, 339, L65 [NASA ADS] [Google Scholar]
- Kochanek, C. S. 2004, ApJ, 605, 58 [Google Scholar]
- Kochanek, C. S., Falco, E. E., Schild, R., Dobrzycki, A., & Hagen, H.-J. 1997, ApJ, 479, 678 [NASA ADS] [CrossRef] [Google Scholar]
- Kochanek, C. S., Falco, E. E., Impey, C. D., et al. 2000, ApJ, 543, 131 [NASA ADS] [CrossRef] [Google Scholar]
- Koopmans, L. V. E, Treu, T., Bolton, A. S., Burles, S., & Moustakas, L. A. 2006, ApJ, 649, 599 [NASA ADS] [CrossRef] [Google Scholar]
- Koptelova, E., Shimanovskaya, E., Artamonov, B., & Yagola, A. 2007, MNRAS, 381, 1655 [NASA ADS] [CrossRef] [Google Scholar]
- Korista, K. T., & Goad, M. R. 2001, ApJ, 553, 695 [NASA ADS] [CrossRef] [Google Scholar]
- Krolik, J. H. 1999, Active Galactic Nuclei: From the Central Black Hole to the Galactic Environment (Princeton: Princeton University Press) [Google Scholar]
- Kundić, T., Turner, E. L., Colley, W. N., et al. 1997, ApJ, 482, 75 [NASA ADS] [CrossRef] [Google Scholar]
- Landt, H., Padovani, P., Giommi, P., Perri, M., & Cheung, C. C. 2008, ApJ, 676, 87 [NASA ADS] [CrossRef] [Google Scholar]
- Lee, C.-H. 2017, A&A, 605, L8 [NASA ADS] [CrossRef] [EDP Sciences] [Google Scholar]
- Lehár, J., Falco, E. E., Kochanek, C. S., et al. 2000, ApJ, 536, 584 [NASA ADS] [CrossRef] [Google Scholar]
- Lubin, L. M., Fassnacht, C. D., Readhead, A. C. S., Blandford, R. D., & Kundić, T. 2000, AJ, 119, 451 [NASA ADS] [CrossRef] [Google Scholar]
- MacLeod, C. L., Kochanek, C. S., & Agol, E. 2009, ApJ, 699, 1578 [NASA ADS] [CrossRef] [Google Scholar]
- Magain, P., Surdej, J., Swings, J. P., Borgeest, U., & Kayser, R. 1988, Nature, 334, 325 [NASA ADS] [CrossRef] [Google Scholar]
- Maoz, D., Netzer, H., Peterson, B. M., et al. 1993, ApJ, 404, 576 [NASA ADS] [CrossRef] [Google Scholar]
- McHardy, I. M., Jones, L. R., Merrifield, M. R., et al. 1998, MNRAS, 295, 641 [NASA ADS] [CrossRef] [Google Scholar]
- McLeod, B. A., Bernstein, G. M., Rieke, M. J., & Weedman, D. W. 1998, ApJ, 115, 1377 [Google Scholar]
- Mediavilla, E., Muñoz, J. A., Falco, E., et al. 2009, ApJ, 706, 1451 [NASA ADS] [CrossRef] [Google Scholar]
- Mediavilla, E., Jiménez-Vicente, J., Muñoz, J. A., & Mediavilla, T. 2015, ApJ, 814, L26 [NASA ADS] [CrossRef] [Google Scholar]
- Michalitsianos, A. G., Nichols-Bohlin, J., Bruhweiler, F. C., et al. 1993, ApJ, 417, L57 [NASA ADS] [CrossRef] [Google Scholar]
- More, A., Oguri, M., Kayo, I., et al. 2016, MNRAS, 456, 1595 [NASA ADS] [CrossRef] [Google Scholar]
- Moreau, O., Libbrecht, C., Lee, D.-W., & Surdej, J. 2005, A&A, 436, 479 [NASA ADS] [CrossRef] [EDP Sciences] [Google Scholar]
- Morgan, C. W., Eyler, M. E., Kochanek, C. S., et al. 2008, ApJ, 676, 80 [NASA ADS] [CrossRef] [Google Scholar]
- Mosquera, A. M., & Kochanek, C. S. 2011, ApJ, 738, 96 [NASA ADS] [CrossRef] [Google Scholar]
- Motta, V., Mediavilla, E., Falco, E., & Muñoz, J. A. 2012, ApJ, 755, 82 [NASA ADS] [CrossRef] [Google Scholar]
- Motta, V., Mediavilla, E., Rojas, K., et al. 2017, ApJ, 835, 132 [NASA ADS] [CrossRef] [Google Scholar]
- Oguri, M. 2007, ApJ, 660, 1 [NASA ADS] [CrossRef] [Google Scholar]
- Oguri, M., & Marshall, P. J. 2010, MNRAS, 405, 2579 [NASA ADS] [Google Scholar]
- Oguri, M., Inada, N., Hennawi, J. F., et al. 2005, ApJ, 622, 106 [NASA ADS] [CrossRef] [Google Scholar]
- Oscoz, A., Serra-Ricart, M., Mediavilla, E., et al. 1997, ApJ, 491, L7 [NASA ADS] [CrossRef] [Google Scholar]
- Oscoz, A., Alcalde, D., Serra-Ricart, M., Mediavilla, E., & Muñoz, J. A. 2002, ApJ, 573, L1 [NASA ADS] [CrossRef] [Google Scholar]
- Østensen, R., Refsdal, S., Stabell, R., et al. 1996, A&A, 309, 59 [NASA ADS] [Google Scholar]
- Østensen, R., Remy, M., Lindblad, P. O., et al. 1997, A&AS, 126, 393 [NASA ADS] [CrossRef] [EDP Sciences] [Google Scholar]
- Ovaldsen, J. E., Teuber, J., Schild, R. E., & Stabell, R. 2003, A&A, 402, 891 [NASA ADS] [CrossRef] [EDP Sciences] [Google Scholar]
- Pan, Y., Cao, S., & Li, L. 2016, Int. J. Mod. Phys. D, 25, 1650003 [NASA ADS] [CrossRef] [Google Scholar]
- Paraficz, D., & Hjorth, J. 2010, ApJ, 712, 1378 [NASA ADS] [CrossRef] [Google Scholar]
- Paraficz, D., Hjorth, J., Burud, I., Jakobsson, P., & Elíasdóttir, Á. 2006, A&A, 455, L1 [NASA ADS] [CrossRef] [EDP Sciences] [Google Scholar]
- Pâris, I., Petitjean, P., Aubourg, É., et al. 2012, A&A, 548, 66 [Google Scholar]
- Pâris, I., Petitjean, P., Aubourg, É., et al. 2014, A&A, 563, 54 [Google Scholar]
- Pelt, J., Schild, R., Refsdal, S., & Stabell, R. 1998, A&A, 336, 829 [NASA ADS] [Google Scholar]
- Peng, C. Y., Impey, C. D., Rix, H. W., et al. 2006, ApJ, 649, 616 [Google Scholar]
- Peterson, B. M. 1997, An Introduction to Active Galactic Nuclei (Cambridge: Cambridge University Press) [CrossRef] [Google Scholar]
- Rathna Kumar, S., Tewes, M., Stalin, C. S., et al. 2013, A&A, 557, 44 [Google Scholar]
- Rathna Kumar, S., Stalin, C. S., & Prabhu, T. P. 2015, A&A, 580, 38 [Google Scholar]
- Rees, M. J. 1984, ARA&A, 22, 471 [NASA ADS] [CrossRef] [Google Scholar]
- Rees, M. J., Netzer, H., & Ferland, G. J. 1989, ApJ, 347, 640 [NASA ADS] [CrossRef] [Google Scholar]
- Refsdal, S., Stabell, R., Pelt, J., & Schild, R. 2000, A&A, 360, 10 [NASA ADS] [Google Scholar]
- Richards, G. T., Keeton, C. R., Pindor, B., et al. 2004, ApJ, 610, 679 [NASA ADS] [CrossRef] [Google Scholar]
- Rubin, K. H. R., O’Meara, J. M., Cooksey, K. L., et al. 2018, ApJ, 859, 146 [NASA ADS] [CrossRef] [Google Scholar]
- Rusu, C. E., Oguri, M., Minowa, Y., et al. 2016, MNRAS, 458, 2 [NASA ADS] [CrossRef] [Google Scholar]
- Schechter, P. L., Gregg, M. D., Becker, R. H., Helfand, D. J., & White, R. L. 1998, AJ, 115, 1371 [NASA ADS] [CrossRef] [Google Scholar]
- Schild, R. E., & Smith, R. C. 1991, AJ, 101, 813 [NASA ADS] [CrossRef] [Google Scholar]
- Schmidt, G. D., Elston, R., & Lupie, O. L. 1992, AJ, 104, 1563 [NASA ADS] [CrossRef] [Google Scholar]
- Schmidt, R. W., Kundić, T., Pen, U.-L., et al. 2002, A&A, 392, 773 [NASA ADS] [CrossRef] [EDP Sciences] [Google Scholar]
- Schneider, P., Ehlers, J., & Falco, E. E. 1992, Gravitational Lensing (Berlin: Springer) [Google Scholar]
- Schneider, P., Kochanek, C. S., & Wambsganss, J. 2006, in Gravitational Lensing: Strong, Weak & Micro, Proc. of the 33rd Saas-Fee Advanced Course, eds. G. Meylan, P. Jetzer, & P. North (Berlin: Springer) [Google Scholar]
- Sereno, M., & Paraficz, D. 2014, MNRAS, 437, 600 [NASA ADS] [CrossRef] [Google Scholar]
- Sergeyev, A. V., Zheleznyak, A. P., Shalyapin, V. N., & Goicoechea, L. J. 2016, MNRAS, 456, 1948 [NASA ADS] [CrossRef] [Google Scholar]
- Serra-Ricart, M., Oscoz, A., Sanchís, T., et al. 1999, ApJ, 526, 40 [NASA ADS] [CrossRef] [Google Scholar]
- Shalyapin, V. N., & Goicoechea, L. J. 2013, Rev. Mex. Astron. Astrofis., 42, 66 [Google Scholar]
- Shalyapin, V. N., & Goicoechea, L. J. 2014a, A&A, 568, 116 [Google Scholar]
- Shalyapin, V. N., & Goicoechea, L. J. 2014b, Astron. Nachr., 335, 428 [NASA ADS] [CrossRef] [Google Scholar]
- Shalyapin, V. N., & Goicoechea, L. J. 2017, ApJ, 836, 14 [NASA ADS] [CrossRef] [Google Scholar]
- Shalyapin, V. N., Goicoechea, L. J., Alcalde, D., et al. 2002, ApJ, 579, 127 [NASA ADS] [CrossRef] [Google Scholar]
- Shalyapin, V. N., Goicoechea, L. J., Koptelova, E., Ullán, A., & Gil-Merino, R. 2008, A&A, 492, 401 [NASA ADS] [CrossRef] [EDP Sciences] [Google Scholar]
- Shalyapin, V. N., Goicoechea, L. J., Koptelova, E., et al. 2009, MNRAS, 397, 1982 [NASA ADS] [CrossRef] [Google Scholar]
- Shalyapin, V. N., Goicoechea, L. J., & Gil-Merino, R. 2012, A&A, 540, 132 [Google Scholar]
- Shustov, B., Gómez de Castro, A. I., Sachkov, M., et al. 2014, Ap&SS, 354, 155 [NASA ADS] [CrossRef] [Google Scholar]
- Simmons, J. F. L., & Stewart, B. G. 1985, A&A, 142, 100 [NASA ADS] [Google Scholar]
- Skrutskie, M. F., Cutri, R. M., Stiening, R., et al. 2006, AJ, 131, 1163 [NASA ADS] [CrossRef] [Google Scholar]
- Słowikowska, A., Krzeszowski, K., Żejmo, M., Reig, P., & Steele, I. 2016, MNRAS, 458, 759 [NASA ADS] [CrossRef] [Google Scholar]
- Sluse, D., Hutsemékers, D., Lamy, H., Cabanac, R., & Quintana, H. 2005, A&A, 433, 757 [NASA ADS] [CrossRef] [EDP Sciences] [Google Scholar]
- Sluse, D., Hutsemékers, D., Courbin, F., Meylan, G., & Wambsganss, J. 2012, A&A, 544, 62 [Google Scholar]
- Sluse, D., Hutsemékers, D., Anguita, T., Braibant, L., & Riaud, P. 2015, A&A, 582, 109 [Google Scholar]
- Smee, S. A., Gunn, J. E., Uomoto, A., et al. 2013, AJ, 146, 32 [Google Scholar]
- Sparks, W. B., & Axon, D. J. 1999, PASP, 111, 1298 [Google Scholar]
- Steele, I. A., Smith, R. J., Rees, P. C., et al. 2004, Proc. SPIE, 5489, 679 [NASA ADS] [CrossRef] [Google Scholar]
- Steele, I. A., Kopač, D., Arnold, D. M., et al. 2017, ApJ, 843, 143 [NASA ADS] [CrossRef] [Google Scholar]
- Stockton, A. 1980, ApJ, 242, L141 [NASA ADS] [CrossRef] [Google Scholar]
- Tewes, M., Courbin, F., & Meylan, G. 2013, A&A, 553, 120 [Google Scholar]
- Tian, Y., Ko, C.-M., & Chiu, M.-C. 2013, ApJ, 770, 154 [NASA ADS] [CrossRef] [Google Scholar]
- Tie, S. S., & Kochanek, C. S. 2018, MNRAS, 473, 80 [NASA ADS] [CrossRef] [Google Scholar]
- Treu, T., & Marshall, P. J. 2016, A&ARv, 24, 11 [Google Scholar]
- Udalski, A., Szymański, M. K., Kubiak, M., et al. 2006, Acta Astron., 56, 293 [Google Scholar]
- Ullán, A., Goicoechea, L. J., Zheleznyak, A. P., et al. 2006, A&A, 452, 25 [NASA ADS] [CrossRef] [EDP Sciences] [Google Scholar]
- Vakulik, V. G., Schild, R. E., Dudinov, V. N., et al. 2004, A&A, 420, 447 [NASA ADS] [CrossRef] [EDP Sciences] [Google Scholar]
- Vakulik, V., Schild, R., Dudinov, V., et al. 2006, A&A, 447, 905 [NASA ADS] [CrossRef] [EDP Sciences] [Google Scholar]
- Walsh, D., Carswell, R. F., & Weymann, R. J. 1979, Nature, 279, 381 [NASA ADS] [CrossRef] [PubMed] [Google Scholar]
- Wardle, J. F. C., & Kronberg, P. P. 1974, ApJ, 194, 249 [NASA ADS] [CrossRef] [Google Scholar]
- Wei, J.-J., Wu, X.-F., & Melia, F. 2014, ApJ, 788, 190 [NASA ADS] [CrossRef] [Google Scholar]
- Weymann, R. J., Chaffee, F. H., Jr., Carleton, N. P., et al. 1979, ApJ, 233, L43 [NASA ADS] [CrossRef] [Google Scholar]
- Wills, D., Wills, B. J., Breger, M., & Hsu, J.-C. 1980, AJ, 85, 1555 [NASA ADS] [CrossRef] [Google Scholar]
- Wills, B. J., Netzer, H., & Wills, D. 1985, ApJ, 288, 94 [NASA ADS] [CrossRef] [Google Scholar]
- Wilson, M. L., Zabludoff, A. I., Keeton, C. R., et al. 2017, ApJ, 850, 94 [NASA ADS] [CrossRef] [Google Scholar]
- Woźniak, P. R., Udalski, A., Szymański, M., et al. 2000, ApJ, 540, L65 [NASA ADS] [CrossRef] [Google Scholar]
- Yee, H. K. C. 1988, AJ, 95, 1331 [NASA ADS] [CrossRef] [Google Scholar]
- Young, P., Gunn, J. E., Kristian, J., Oke, J. B., & Westphal, J. A. 1980, ApJ, 241, 507 [NASA ADS] [CrossRef] [Google Scholar]
- Young, P., Gunn, J. E., Oke, J. B., Westphal, J. A., & Kristian, J. 1981a, ApJ, 244, 736 [NASA ADS] [CrossRef] [Google Scholar]
- Young, P., Sargent, W. L. W., Oke, J. B., & Boksenberg, A. 1981b, ApJ, 249, 415 [NASA ADS] [CrossRef] [Google Scholar]
- Yuan, C. C., & Wang, F. Y. 2015, MNRAS, 452, 2423 [NASA ADS] [CrossRef] [Google Scholar]
- Zhdanov, V. I., & Surdej, J. 2001, A&A, 372, 1 [NASA ADS] [CrossRef] [EDP Sciences] [Google Scholar]
MySQL is a database management system that is developed, distributed and supported by Oracle Corporation. This software is available at http://www.mysql.com/. PHP is a general-purpose scripting language that is especially suited to web development, and is available at http://php.net/. JavaScript is an object-oriented computer programming language commonly used to create interactive effects within web browsers, developed by Mozilla Foundation at https://developer.mozilla.org/en-US/docs/Web/JavaScript. HTML5 is the fifth version of the standard HTML mar- kup language used for structuring and presenting web content, developed by the Word Wide Web Consortium at https://www.w3.org/.
Assuming a disc inclination of 60° and a central black hole with a mass ranging from 108.51M⊙ (from the C IV emission) to 108.9M⊙ (from the Hβ and C IV emissions; Assef et al. 2011).
We consider a black hole with a mass of 109.4M⊙ (average of estimates through the C IV and Mg II emission lines; Peng et al. 2006) instead of 109 M⊙ (C IV emission-line estimate of Assef et al. 2011).
IRAF is distributed by the National Optical Astronomy Observatory, which is operated by the Association of Universities for Research in Astronomy (AURA) under cooperative agreement with the National Science Foundation. This software is available at http://iraf.noao.edu/.
The associated L2LENS software is available at http://grupos.unican.es/glendama/LQLM_tools.htm.
All Tables
All Figures
|
Fig. 1 Distribution of targets and frames in the GLENDAMA archive. |
| In the text | |
|
Fig. 2 Distribution of GLQ frames. |
| In the text | |
|
Fig. 3 Light curves of QSO B0909+532 in the r-band. Top panel: LT-USNO brightness records of both quasar images. The brightness of B is offset by −0.65 mag to facilitate comparison, and the new LT data correspond to our monitoring in 2012−2016. Middle panel: DLC between 2012 and 2016, and bottom panel: zoomed-in DLC around day 6300. To construct the DLC, the data of the A image have been shifted by −50 d (time delay), and then binned around the dates of the B image (using bins with a semisize of 10 d). Only bins including two or moredata have been taken into account to compute differences between A and B. |
| In the text | |
|
Fig. 4 Light curves of FBQS J0951+2635 in the r-band. Top panel: LT-NOT-MAO brightness records of both quasar images and the faint star S3. There is a gap of about 1000 d between the MAO monitoring campaign (before day 4000) and the LT-NOT follow-up observations starting in 2009. The records of B and S3 are offset by −0.70 and −1.35 mag, respectively. Bottom panel: DLC (black data points), where the data of the B image have been shifted by −16 d (time delay) and binned around the dates of the A image (using bins with a semisize of 4 d). We also show the single-epochmagnitude differences (grey data points), as well as the single-epoch flux ratio of the Mg II emission line in magnitudes (horizontal dashed line). |
| In the text | |
|
Fig. 5 Photometric monitoring of QSO B0957+561. Top panel: IO:O r-band frame taken on 21 January 2015. In this typical frame in terms of seeing (FWHM = 1.′′ 45), the two quasar images and several field stars are properly labelled (these objects, except for star Y, are depicted on the finding chart of Ovaldsen et al. 2003). Middle and bottom panels: IAC80-LT light curves in the r-band in two different monitoring periods. The first period includes IAC80 data (middle panel), while the vast majority of data in the second period correspond to LT observations (bottom panel). For comparison purposes, the bottom panel also contains the USNO brightness records in 2008−2011 using our own estimate for the rLT − rUSNO magnitude offset (14.430 mag instead of the 14.455 mag offset used by Hainline et al. 2012). |
| In the text | |
|
Fig. 6 Delay-corrected r-band flux ratio of QSO B0957+561. The 2σ measurements of B∕A are obtained in the overlapping periods between A(+420 d) and B. Here, the ⟨tB ⟩ and ⟨B⟩ values are the epochs and fluxes of B averaged over these periods. The grey highlighted rectangles illustrate the r-band flux ratio from HST spectra in 1999−2000 (2σ confidence interval), while the rectangle with dashed sides highlights the oscillating trend from LT photometric data in 2005−2010. The top panel shows the yearly variability and the bottom panel displays the dependence of B∕A on ⟨B⟩. |
| In the text | |
|
Fig. 7 SPRAT spectroscopy of QSO B0957+561 on 19 November 2015 and 17 January 2017. Vertical dashed and dotted lines indicate emission and absorption features, while grey highlighted regions are associated with atmospheric artefacts. |
| In the text | |
|
Fig. 8 Single-epoch flux ratios of emission lines. The blue triangles, green squares, and red circles represent the C IV, C III], and Mg II flux ratios, respectively. Average values and standard deviations are marked by dashed lines and bands: blue (C IV), green (C III]), and red (Mg II). The green and red bands overlap almost completely, resulting in a brown band. |
| In the text | |
|
Fig. 9 TNG/NICS imaging of QSO B0957+561 in subarcsec seeing conditions. Left panels: lens system in the final combined frames with total exposure times of 3.12 ks (J-band), 2.2 ks (H-band), and 4.5 ks (K-band). Middle panels: residual signal after subtracting only the two quasar images (A+B), clearly displaying the main lensing galaxy. Right panels: residual light after subtracting the global photometric model (A+B+GAL). See main text for details. |
| In the text | |
|
Fig. 10 FRODOSpec red-grating and SPRAT spectra of SDSS J1001+5027 in 2013−2016. We display the FRODOSpec spectra after a three-point smoothing filter is applied. Our global dataset contains information on the C IV, C III], and Mg II emissions at z = 1.838 (Oguri et al. 2005). |
| In the text | |
|
Fig. 11 Continuum and emission-line flux ratios of SDSS J1001+5027. The coloured circles and triangles describe the results for the continuum and the emission lines, respectively (see main text). Blue, green, and red are associated with the continuum (line) at 1549 Å (C IV), 1909 Å (C III]), and 2800 Å (Mg II). For comparison purposes, the black filled and open squares are results from the COSMOGRAIL monitoring in the R-band (Rathna Kumar et al. 2013), whereas the horizontal dashed line and the grey highlighted rectangle show the K′ -band flux ratio (1σ confidence interval) from Subaru Telescope adaptive optics observations (Rusu et al. 2016). |
| In the text | |
|
Fig. 12 LT r-band light curves of QSO B1413+117. Left panel: RATCam photometric data at 3 epochs in May–June 2006 and 33 selected epochs in 2008. Right panel: IO:O data at 30 selected epochs over the period 2013−2016. For comparison purposes, we also include the brightness record of the field star S40. This object has a magnitude similar to those of the quasar images. |
| In the text | |
|
Fig. 13 DLCs of QSO B1413+117 from LT observations in the r-band. To construct the DLCs in the top panel, the light curves of the B-D images have been shifted by the time delays and magnitude offsets relative to the image A, and the original brightness record of A haslater been subtracted from the shifted curves (only BA, CA, and DA pairs separated by ≤7 d were considered to compute the differences). Bottom panel: recent mean-subtracted DLCs. |
| In the text | |
|
Fig. 14 LT r-band light curves of QSO B2237+0305. Left panel: RATCam data at 110 selected epochs over the period 2006−2009. Right panel: IO:O data at 75 selected epochs in 2013−2016. Magnitudes of the control star are also shown for comparison (see main text). |
| In the text | |
|
Fig. A.1 AB comparisons in the r-band. We show overlapping periods between the flux records of A (filled circles) and B (open red circles), where the fluxes of A are shifted by +420 d and properly amplified/reduced (see main text). |
| In the text | |
|
Fig. A.2 RINGO2 data of the polarised star VICyg12. The radius of the dashed open circles is the true polarisation degree, and the radius of the solid open circles is the measured polarisation degree. Top panel: instrumental Stokes parameters (q = Q∕I, u = U∕I) for 103 values of the sky position angle (observations between May 2011 and March 2012). All data points are distributed in a ring around the instrumental polarisation (cross). In the middle panel, the centre of the distribution is shifted to the origin (0, 0) by subtracting the instrumental polarisation (an elliptical distortion is also corrected). In the bottom panel, the data are de-rotated using the sky position angles associated with them. |
| In the text | |
|
Fig. A.3 RINGO2 data of QSO B0957+561. The Stokes parameters (q, u) of A and B at the three observing epochs are corrected for instrumental polarisation and depolarisation effects (see main text). We also display the means and root-mean-square deviations of both parameters for each quasar image (crosses and ellipses), as well as dashed open circles representing three different polarisation degrees: 1%, 2% and 3%. |
| In the text | |
|
Fig. A.4 RINGO3 data of the standard zero-polarised star G191B2B and the unpolarised field star H. Top, middle, and bottom panels: results in the blue, green, and red bands, respectively. We depict the observing dates (vertical dotted lines) and when hardware updates occurred (vertical solid lines), as well as the Stokes parameters for G191B2B (filled circles and squares) and H (filled stars). The horizontal dashed lines represent average parameters of G191B2B (these would be equal to zero for an ideal instrument), and the horizontal dotted lines are the instrumental polarisation offsets reported in Jermak (2016). |
| In the text | |
|
Fig. A.5 RINGO3 data of QSO B0957+561. The Stokes parameters (qA, uA) and (qB, uB) are corrected for instrumental polarisation and depolarisation biases (see main text). In each band, we show the means and root-mean-square deviations of the Stokes parameters for each quasar image (crosses and ellipses), and the 1%, 2%, and 3% polarisation rings (dashed open circles). |
| In the text | |
|
Fig. A.6 Mg II emission line profiles on 19 November 2015. We also display Gaussian fits to the regions of 40 Å width centred at 2800 Å (blue rectangle), and highlight the continuum windows to the left and right of the Mg II line (grey rectangles). See main text for details. |
| In the text | |
Current usage metrics show cumulative count of Article Views (full-text article views including HTML views, PDF and ePub downloads, according to the available data) and Abstracts Views on Vision4Press platform.
Data correspond to usage on the plateform after 2015. The current usage metrics is available 48-96 hours after online publication and is updated daily on week days.
Initial download of the metrics may take a while.