Fig. 8
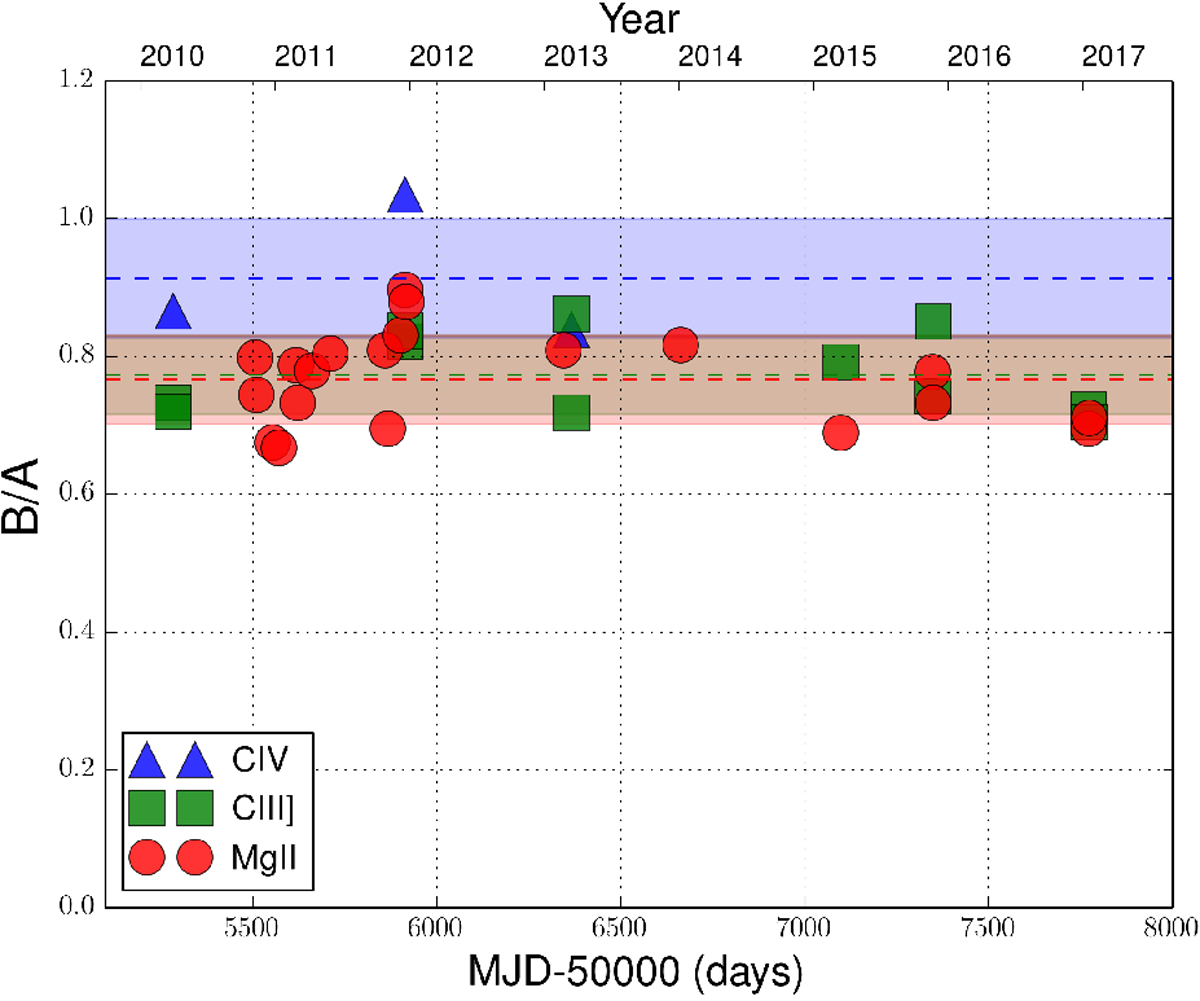
Single-epoch flux ratios of emission lines. The blue triangles, green squares, and red circles represent the C IV, C III], and Mg II flux ratios, respectively. Average values and standard deviations are marked by dashed lines and bands: blue (C IV), green (C III]), and red (Mg II). The green and red bands overlap almost completely, resulting in a brown band.
Current usage metrics show cumulative count of Article Views (full-text article views including HTML views, PDF and ePub downloads, according to the available data) and Abstracts Views on Vision4Press platform.
Data correspond to usage on the plateform after 2015. The current usage metrics is available 48-96 hours after online publication and is updated daily on week days.
Initial download of the metrics may take a while.