Fig. 6
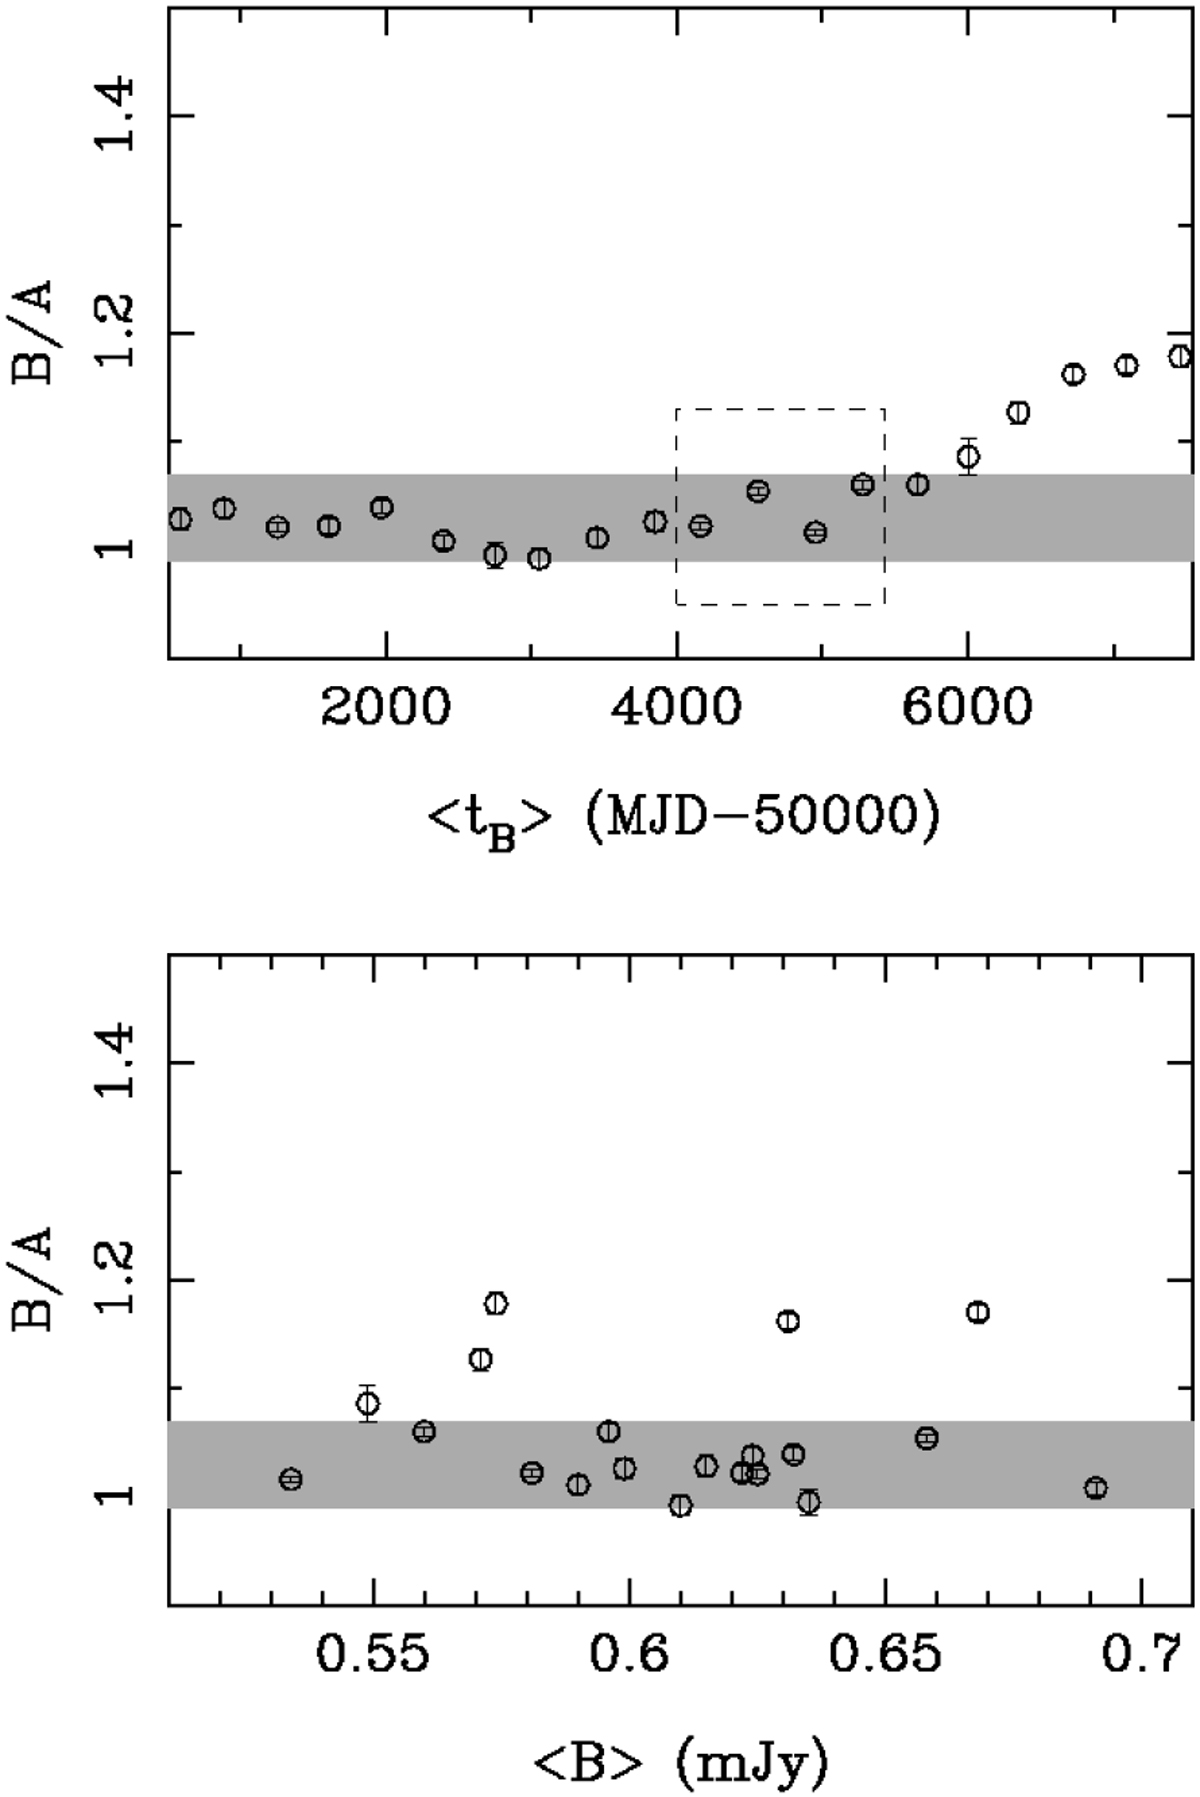
Delay-corrected r-band flux ratio of QSO B0957+561. The 2σ measurements of B∕A are obtained in the overlapping periods between A(+420 d) and B. Here, the ⟨tB ⟩ and ⟨B⟩ values are the epochs and fluxes of B averaged over these periods. The grey highlighted rectangles illustrate the r-band flux ratio from HST spectra in 1999−2000 (2σ confidence interval), while the rectangle with dashed sides highlights the oscillating trend from LT photometric data in 2005−2010. The top panel shows the yearly variability and the bottom panel displays the dependence of B∕A on ⟨B⟩.
Current usage metrics show cumulative count of Article Views (full-text article views including HTML views, PDF and ePub downloads, according to the available data) and Abstracts Views on Vision4Press platform.
Data correspond to usage on the plateform after 2015. The current usage metrics is available 48-96 hours after online publication and is updated daily on week days.
Initial download of the metrics may take a while.