Fig. 11
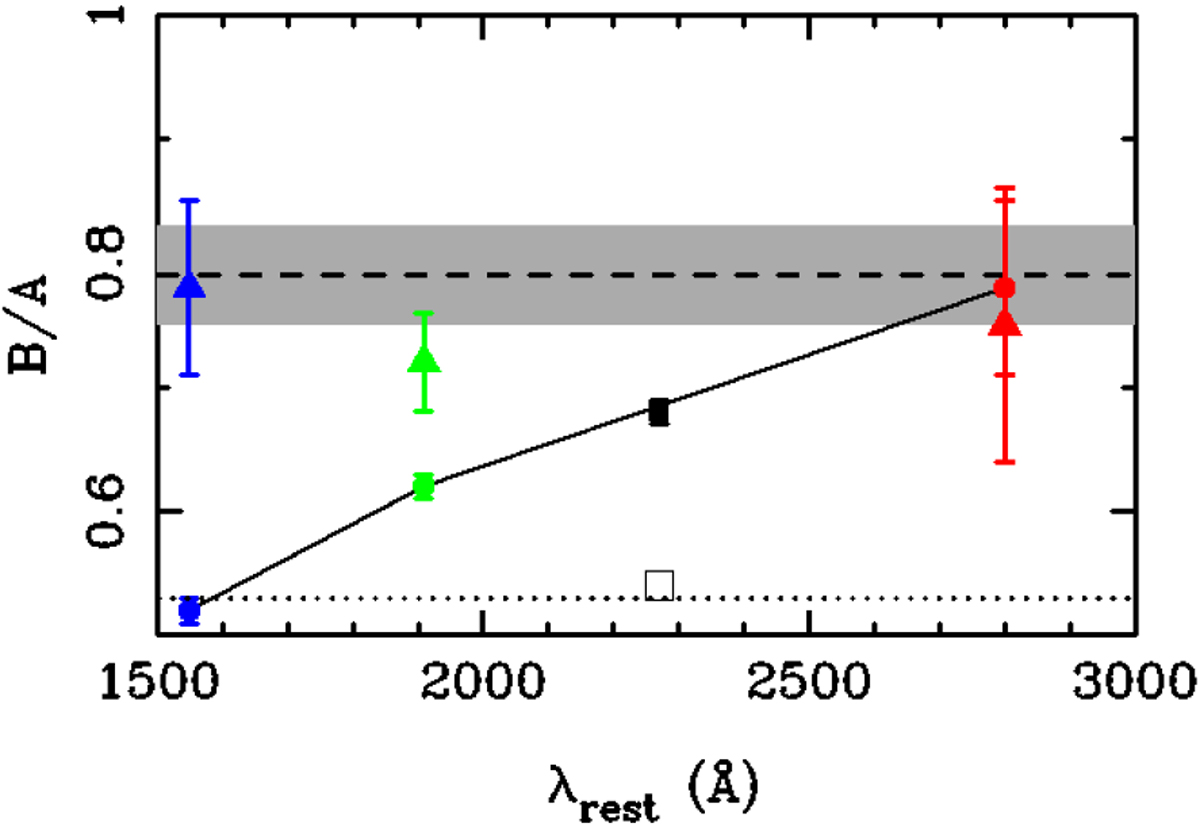
Continuum and emission-line flux ratios of SDSS J1001+5027. The coloured circles and triangles describe the results for the continuum and the emission lines, respectively (see main text). Blue, green, and red are associated with the continuum (line) at 1549 Å (C IV), 1909 Å (C III]), and 2800 Å (Mg II). For comparison purposes, the black filled and open squares are results from the COSMOGRAIL monitoring in the R-band (Rathna Kumar et al. 2013), whereas the horizontal dashed line and the grey highlighted rectangle show the K′ -band flux ratio (1σ confidence interval) from Subaru Telescope adaptive optics observations (Rusu et al. 2016).
Current usage metrics show cumulative count of Article Views (full-text article views including HTML views, PDF and ePub downloads, according to the available data) and Abstracts Views on Vision4Press platform.
Data correspond to usage on the plateform after 2015. The current usage metrics is available 48-96 hours after online publication and is updated daily on week days.
Initial download of the metrics may take a while.