Fig. 4
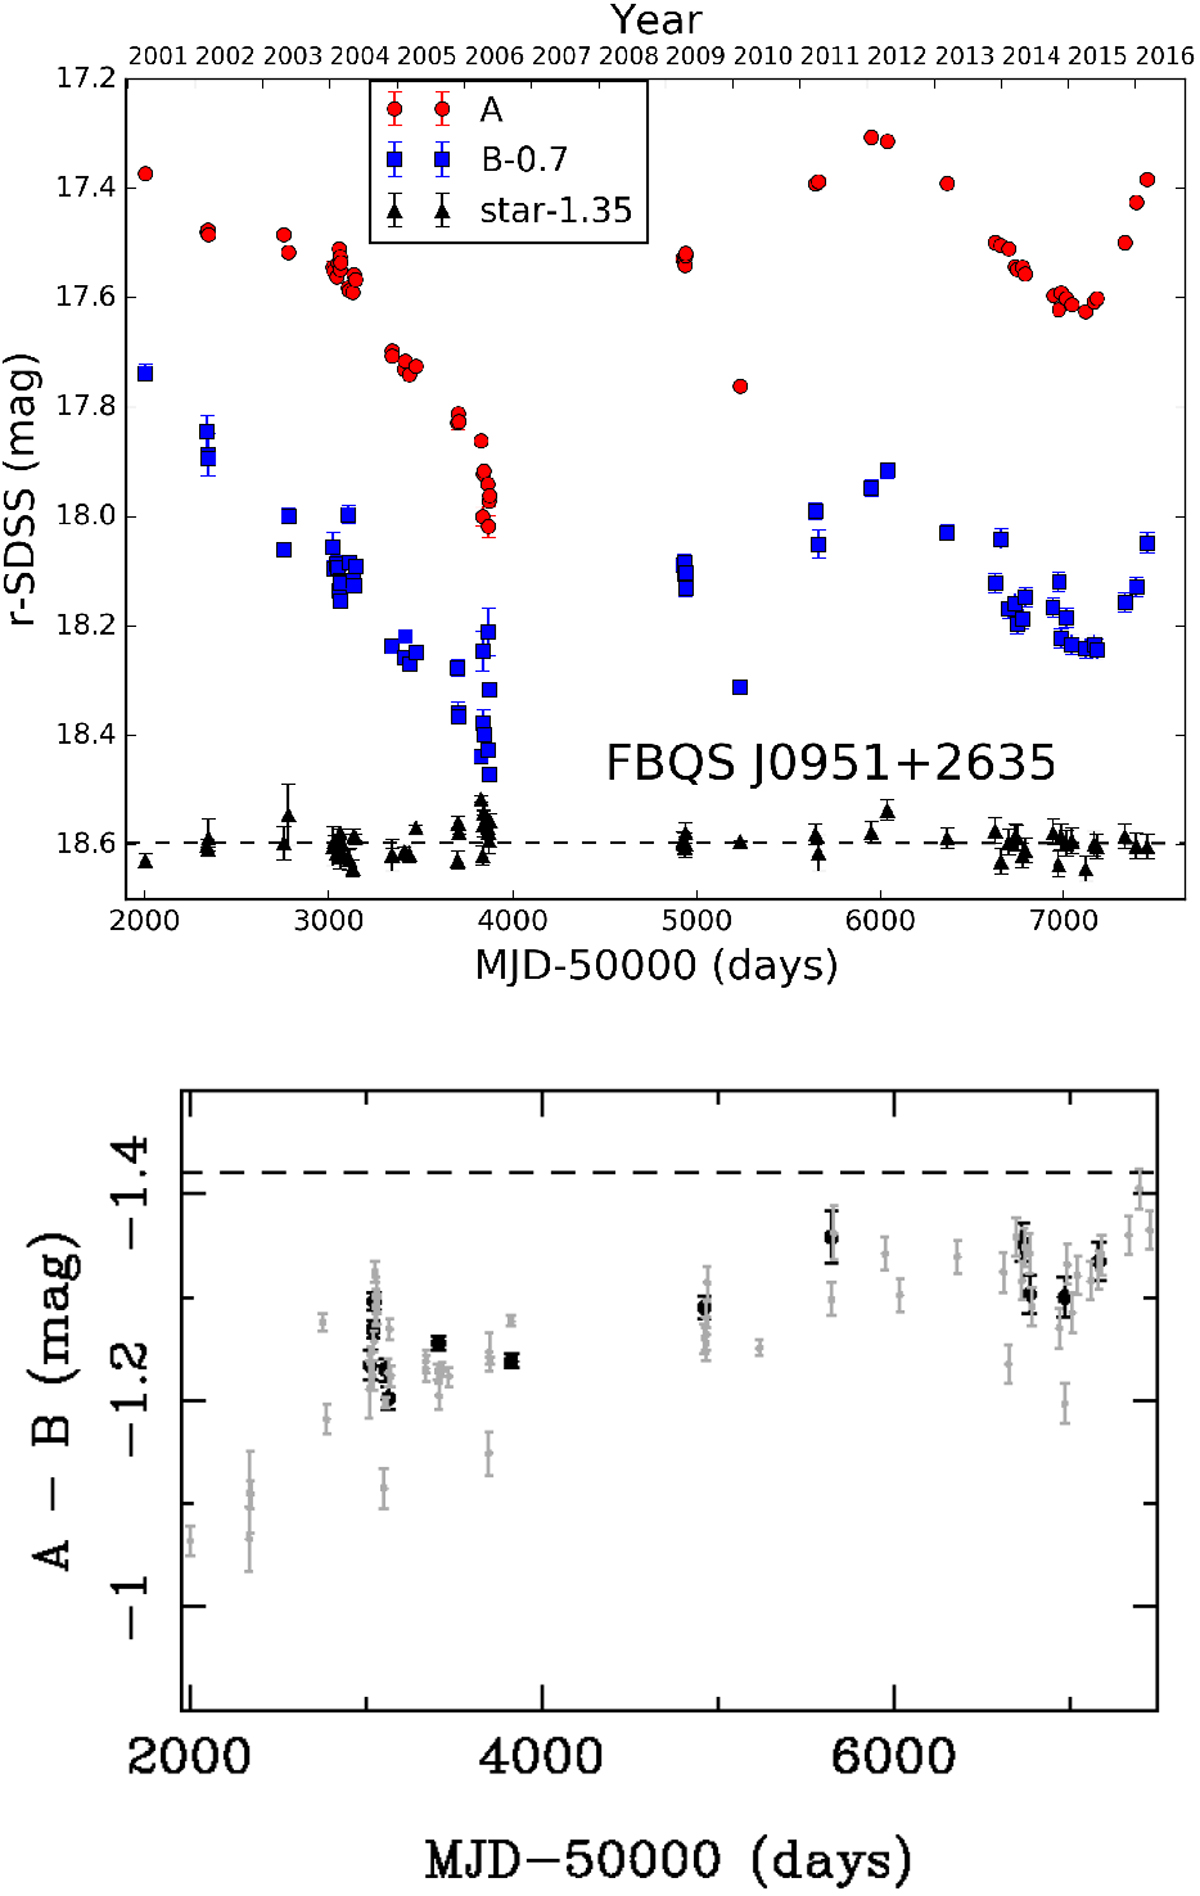
Light curves of FBQS J0951+2635 in the r-band. Top panel: LT-NOT-MAO brightness records of both quasar images and the faint star S3. There is a gap of about 1000 d between the MAO monitoring campaign (before day 4000) and the LT-NOT follow-up observations starting in 2009. The records of B and S3 are offset by −0.70 and −1.35 mag, respectively. Bottom panel: DLC (black data points), where the data of the B image have been shifted by −16 d (time delay) and binned around the dates of the A image (using bins with a semisize of 4 d). We also show the single-epochmagnitude differences (grey data points), as well as the single-epoch flux ratio of the Mg II emission line in magnitudes (horizontal dashed line).
Current usage metrics show cumulative count of Article Views (full-text article views including HTML views, PDF and ePub downloads, according to the available data) and Abstracts Views on Vision4Press platform.
Data correspond to usage on the plateform after 2015. The current usage metrics is available 48-96 hours after online publication and is updated daily on week days.
Initial download of the metrics may take a while.