Fig. 3
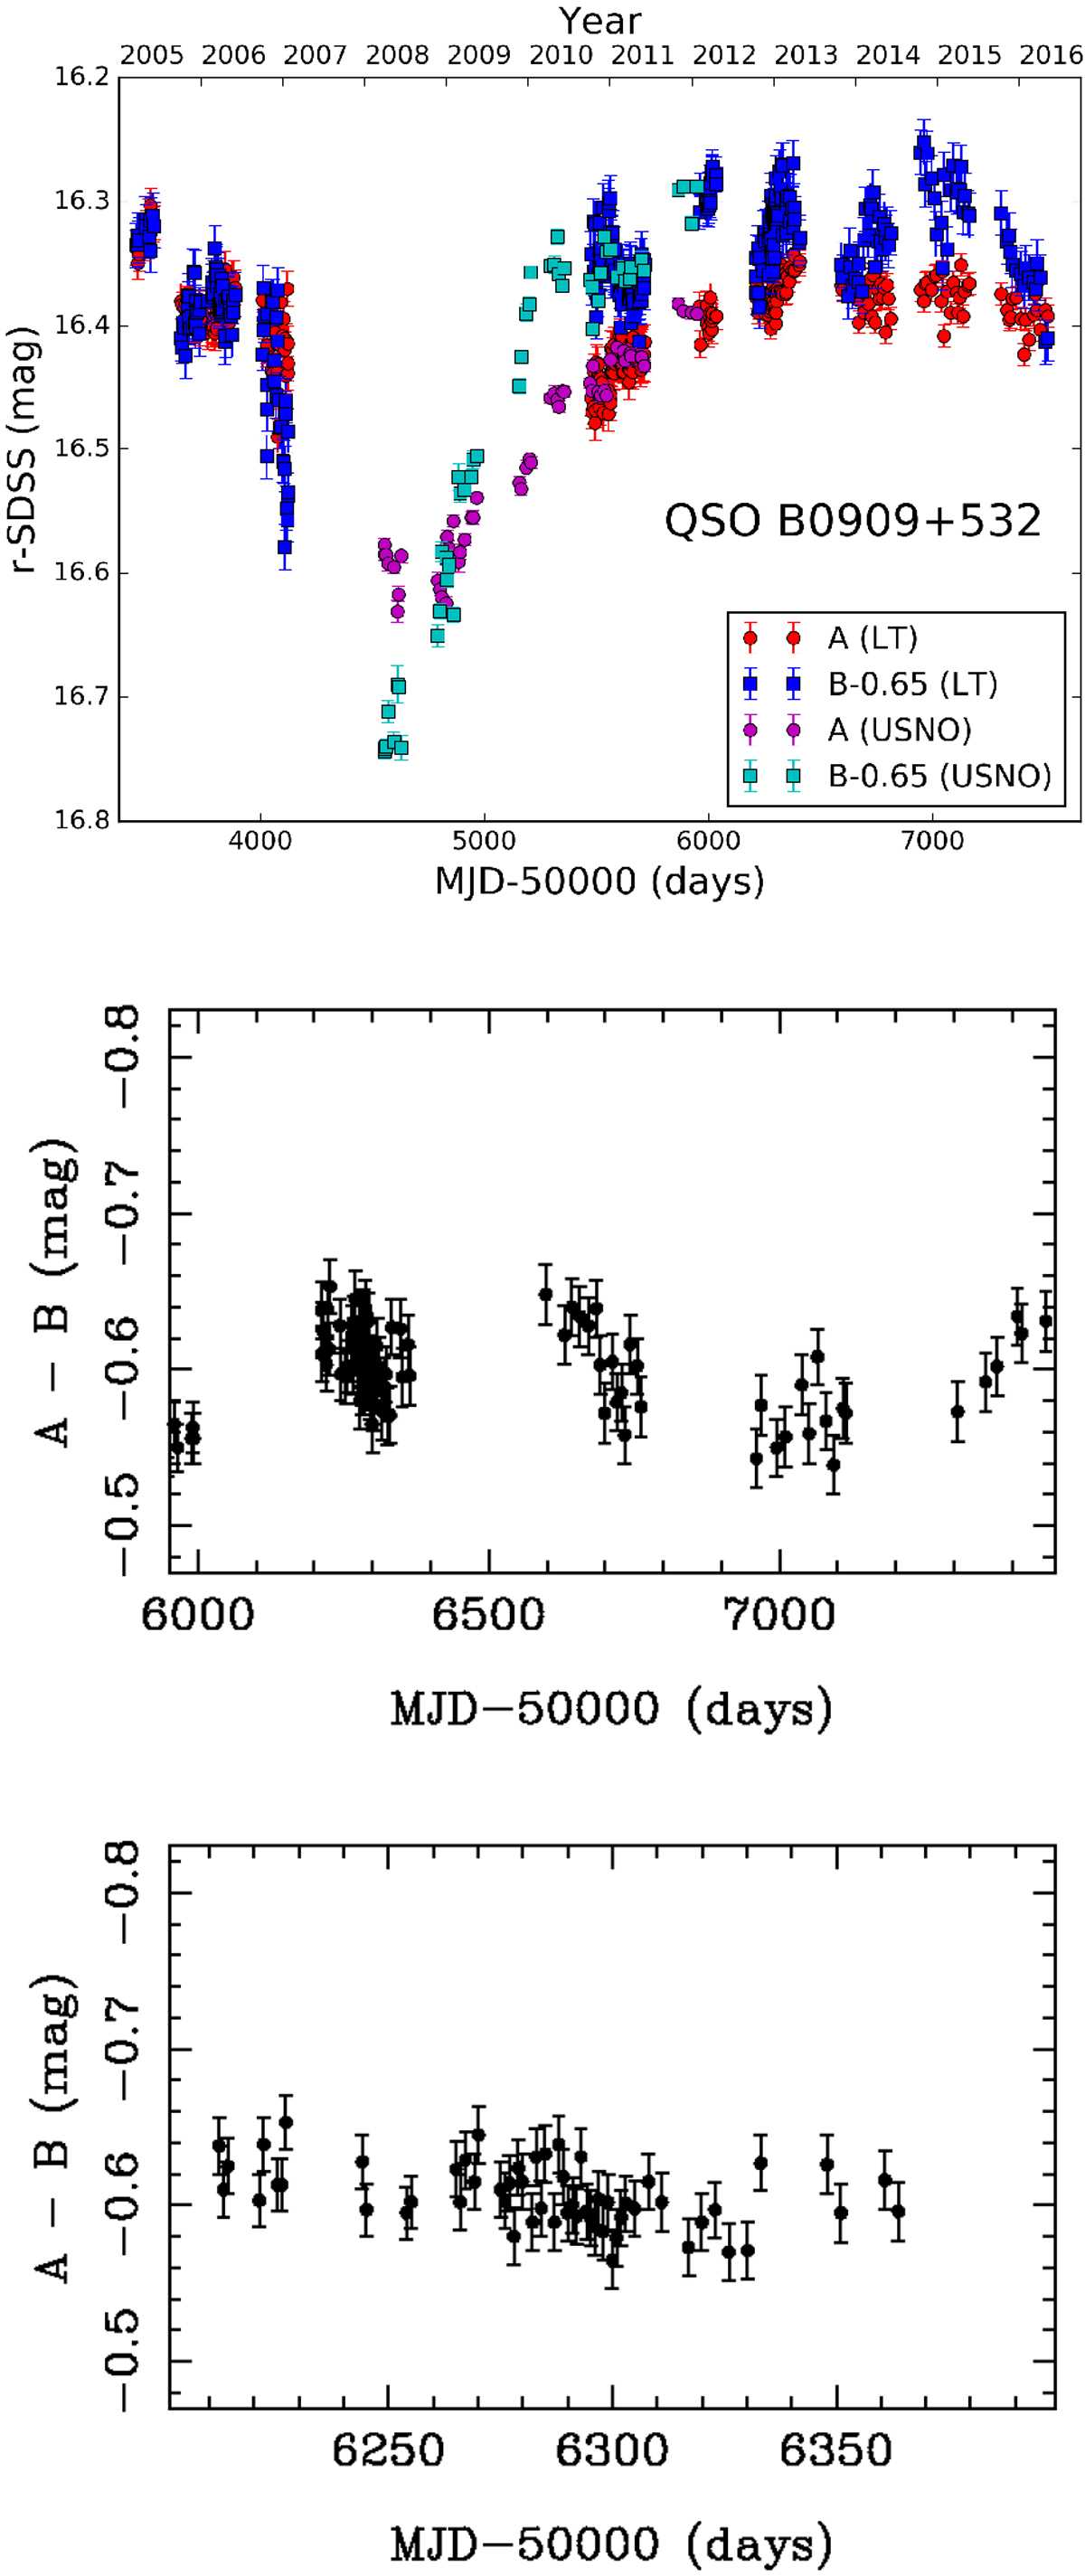
Light curves of QSO B0909+532 in the r-band. Top panel: LT-USNO brightness records of both quasar images. The brightness of B is offset by −0.65 mag to facilitate comparison, and the new LT data correspond to our monitoring in 2012−2016. Middle panel: DLC between 2012 and 2016, and bottom panel: zoomed-in DLC around day 6300. To construct the DLC, the data of the A image have been shifted by −50 d (time delay), and then binned around the dates of the B image (using bins with a semisize of 10 d). Only bins including two or moredata have been taken into account to compute differences between A and B.
Current usage metrics show cumulative count of Article Views (full-text article views including HTML views, PDF and ePub downloads, according to the available data) and Abstracts Views on Vision4Press platform.
Data correspond to usage on the plateform after 2015. The current usage metrics is available 48-96 hours after online publication and is updated daily on week days.
Initial download of the metrics may take a while.