Fig. 13
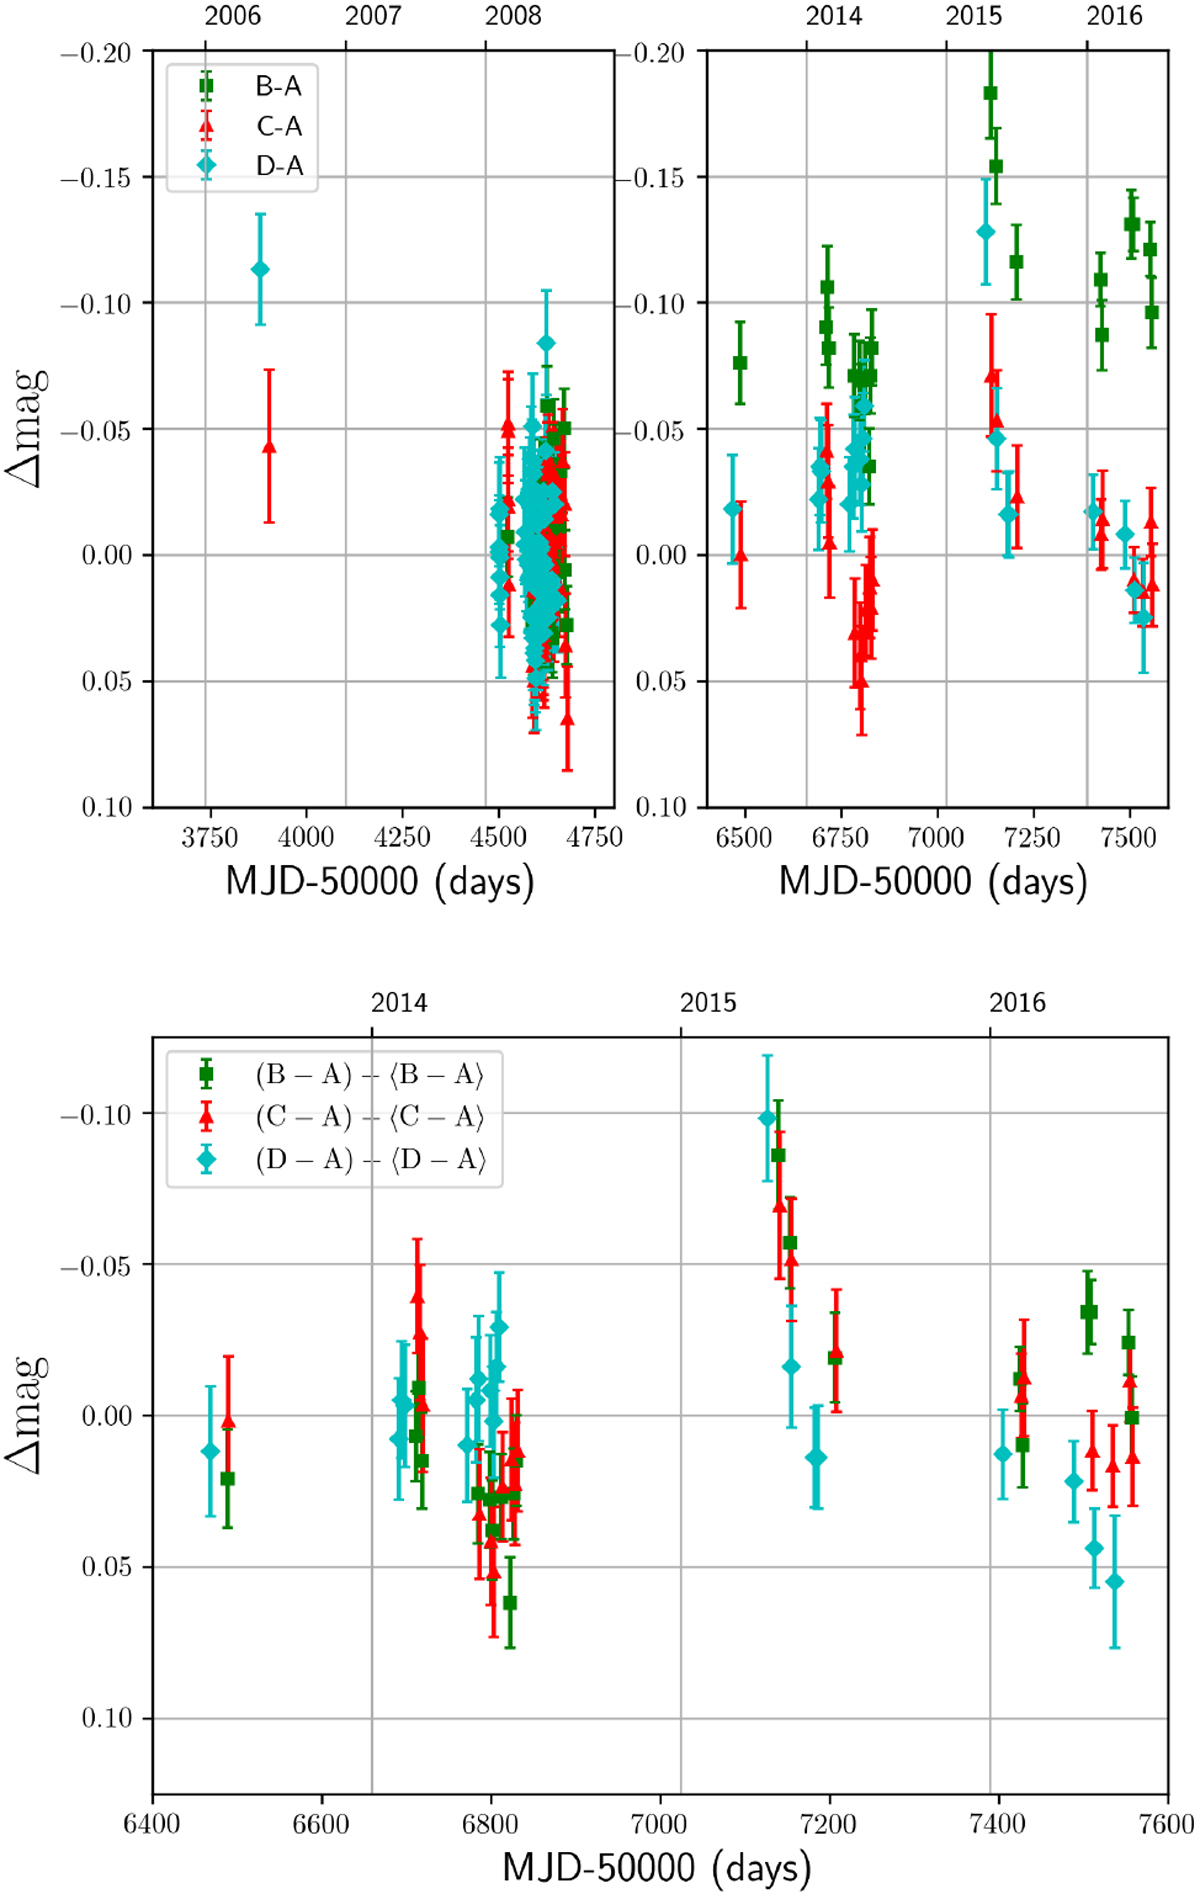
DLCs of QSO B1413+117 from LT observations in the r-band. To construct the DLCs in the top panel, the light curves of the B-D images have been shifted by the time delays and magnitude offsets relative to the image A, and the original brightness record of A haslater been subtracted from the shifted curves (only BA, CA, and DA pairs separated by ≤7 d were considered to compute the differences). Bottom panel: recent mean-subtracted DLCs.
Current usage metrics show cumulative count of Article Views (full-text article views including HTML views, PDF and ePub downloads, according to the available data) and Abstracts Views on Vision4Press platform.
Data correspond to usage on the plateform after 2015. The current usage metrics is available 48-96 hours after online publication and is updated daily on week days.
Initial download of the metrics may take a while.