| Issue |
A&A
Volume 615, July 2018
|
|
|---|---|---|
| Article Number | A155 | |
| Number of page(s) | 29 | |
| Section | Extragalactic astronomy | |
| DOI | https://doi.org/10.1051/0004-6361/201732174 | |
| Published online | 31 July 2018 | |
Molecular line emission in NGC 4945, imaged with ALMA
1
Max-Planck-Institut für Radioastronomie,
Auf dem Hügel 69,
53121
Bonn, Germany
e-mail: chenkel@mpifr-bonn.mpg.de
2
Astronomy Department, Faculty of Science, King Abdulaziz University,
PO Box 80203,
Jeddah
21589, Saudi Arabia
3
Xinjiang Astronomical Observatory, Chinese Academy of Sciences,
830011
Urumqi, PR China
4
Argelander Institut für Astronomie, Universität Bonn,
Auf dem Hügel 71,
53121
Bonn, Germany
5
Jodrell Bank Centre for Astrophysics, University of Manchester,
Oxford Road,
Manchester M13, 9PL, UK
6
UK ALMA Regional Centre Node, University of Manchester,
Oxford Road,
Manchester M13, 9PL, UK
7
SARAO, SKA South Africa,
The Park,
Park Road,
Pinelands
7405, South Africa
8
Rhodes University, RARG, RATT,
PO Box 94,
Grahamstown
6140, South Africa
9
Purple Mountain Observatory & Key Laboratory for Radio Astronomy, Chinese Academy of Sciences,
210008
Nanjing, PR China
10
Department of Physics and Astronomy, UCL,
Gower St.,
London,
WC1E 6BT, UK
11
Dept. of Earth and Space Sciences, Chalmers University of Technology, Onsala Observatory,
43992
Onsala, Sweden
12
LERMA, Observatoire de Paris, College de France, CNRS, PSL Univ., UPMC, Sorbonne Univ.,
Paris, France
13
Observatorio de Madrid, OAN-IGN,
Alfonso XII, 3,
28014
Madrid, Spain
14
INAF-Osservatorio Astrofisico di Arcetri,
Largo E. Fermi, 5,
50125
Firenze, Italy
15
National Radio Astronomy Observatory,
520 Edgemont Road,
Charlottesville,
VA 22903, USA
16
European Southern Observatory, Alonso de Córdova 3107,
Vitacura Casilla
763 0355,
Santiago, Chile
17
Joint ALMA Observatory, Alonso de Córdova 3107,
Vitacura Casilla
763 0355, Santiago,
Chile
18
National Radio Astronomy Observatory,
PO Box O, 1003,
Lopezville Road,
Socorro,
NM 87801-0387,
USA
19
Leiden Observatory, Leiden University,
PO Box 9513,
2300
RA Leiden, The Netherlands
20
Max-Planck-Institut für Extraterrestrische Physik,
Giessenbachstraße 1,
85748
Garching, Germany
21
National Astronomical Observatory of Japan,
2-21-1 Osawa, Mitaka,
181-8588
Tokyo, Japan
22
Netherlands Institue for Radioastronomy ASTRON,
7991
PD Dwingeloo, The Netherlands
23
Dept. of Astrophysical Sciences, Princeton University,
Princeton,
NJ 08544, USA
24
Universität Heidelberg, Zentrum für Astronomie, Inst. für Theoretische Astrophysik,
Albert-Ueberle-Str. 2,
69120
Heidelberg, Germany
25
Key Laboratory of Radio Astronomy, Chinese Academy of Sciences,
830011
Urumqi, PR China
26
Center for Astrophysics, Guangzhou University,
Guangzhou
510006, PR China
27
Universität Heidelberg, Interdisziplinäres Zentrum für Wissens.
Rechnen,
Im Neuenheimer Feld 205, 69120 Heidelberg, Germany
Received:
25
October
2017
Accepted:
20
February
2018
NGC 4945 is one of the nearest (D ≈ 3.8 Mpc; 1″ ≈ 19 pc) starburst galaxies. To investigate the structure, dynamics, and composition of the dense nuclear gas of this galaxy, ALMA band 3 (λ ≈ 3−4 mm) observations were carried out with ≈2″ resolution. Three HCN and two HCO+ isotopologues, CS, C3H2, SiO, HCO, and CH3C2H were measured. Spectral line imaging demonstrates the presence of a rotating nuclear disk of projected size 10″ × 2″ reaching out to a galactocentric radius of r ≈ 100 pc with position angle PA = 45° ± 2°, inclination i = 75° ± 2° and an unresolved bright central core of size ≲2″. The continuum source, representing mostly free-free radiation from star forming regions, is more compact than the nuclear disk by a linear factor of two but shows the same position angle and is centered 0.′′39 ± 0.′′14 northeast of the nuclear accretion disk defined by H2O maser emission. Near the systemic velocity but outside the nuclear disk, both HCN J = 1 → 0 and CS J = 2 → 1 delineate molecular arms of length ≳15″ (≳285 pc) on opposite sides of the dynamical center. These are connected by a (deprojected) ≈ 0.6 kpc sized molecular bridge, likely a dense gaseous bar seen almost ends-on, shifting gas from the front and back side into the nuclear disk. Modeling this nuclear disk located farther inside (r ≲100 pc) with tilted rings provides a good fit by inferring a coplanar outflow reaching a characteristic deprojected velocity of ≈50 km s−1. All our molecular lines, with the notable exception of CH3 C2H, show significant absorption near the systemic velocity (≈571 km s−1), within the range ≈500–660 km s−1. Apparently, only molecular transitions with low critical H2 density (ncrit ≲ 104 cm−3) do not show absorption. The velocity field of the nuclear disk, derived from CH3 C2H, provides evidence for rigid rotation in the inner few arcseconds and a dynamical mass of Mtot = (2.1 ± 0.2) × 108 M⊙ inside a galactocentric radius of 2.′′45 (≈45 pc), with a significantly flattened rotation curve farther out. Velocity integrated line intensity maps with most pronounced absorption show molecular peak positions up to ≈1.′′5 (≈30 pc) southwest of the continuum peak, presumably due to absorption, which appears to be most severe slightly northeast of the nuclear maser disk. A nitrogen isotope ratio of 14N/15N ≈ 200–450 is estimated. This range of values is much higher then previously reported on a tentative basis. Therefore, because 15N is less abundant than expected, the question for strong 15N enrichment by massive star ejecta in starbursts still remains to be settled.
Key words: galaxies: starburst / galaxies: structure / galaxies: ISM / nuclear reactions, nucleosynthesis, abundances / galaxies: individual: NGC4945 / radio lines: ISM
© ESO 2018
1 Introduction
Observing the optically highly obscured central regions of galaxies hosting an active supermassive nuclear engine is fundamental to our understanding of galaxy evolution. The transfer of mass into sub-parsec scale accretion disks and the feeding of the nuclear engine and its feedback, which potentially affect the large-scale appearance of the parent galaxy, are basic phenomena to be studied. The nearby, almost edge-on H2 O megamaser galaxy NGC 4945 is such an active galaxy. Its central region is known to show a rich molecular spectrum hosting not only a nuclear starburst but also an active galactic nucleus (AGN; see, e.g., Marconi et al. 2000; Yaqoob 2012). Past molecular single-dish studies include Henkel et al. (1990, 1994), Dahlem et al. (1993), Mauersberger et al. (1996), Curran et al. (2001), Wang et al. (2004), Hitschfeld et al. (2008), Pérez-Beaupuits et al. (2011), and Monje et al. (2014). As an outstanding galaxy in the Cen A/M 83 group at a distance of only D ≈ 3.8 Mpc (e.g., Karachentsev et al. 2007; Mould & Sakai 2008; 1″ corresponds to ≈19 pc), NGC 4945 hosts one of the three brightest Infrared Astronomical Satellite (IRAS) point sources beyond the Magellanic Clouds (Wang et al. 2004).
Although this Seyfert 2 galaxy has an infrared luminosity a few times that of the Milky Way, it nevertheless suffers from a lack of interferometric studies of molecular high density tracers, a consequence of its southern location. Greenhill et al. (1997) used the 22 GHz H2 O maser lines to map the circumnuclear accretion disk at a galactocentric radius of rGC ≈ 0.45 pc (0.′′ 025), which shows a similar position angle as the large-scale disk, revealing a binding mass of order M = (1–2) × 106 M⊙. More recently, 183 and 321 GHz H2O and even Class I methanol maser emission has also been detected (Hagiwara et al. 2016; Humphreys et al. 2016; Pesce et al. 2016; McCarthy et al. 2017). Cunningham & Whiteoak (2005) mapped the λ ≈ 3 mm lines of HCN (partially), HNC, and HCO+ with an angular resolution of 5.′′6 × 3.′′ 5 and found an elongated morphology, with a position angle consistent with the inner H2 O and the outer large-scale disk. If this gas were to trace a rotating disk, its radius would be rGC ≈ 57 pc, with a rotational velocity of Vrot ≈ 135 km s−1, enclosing a mass of M ≈ 2.5 × 10⁸ M⊙. Also based on Australia Telescope Compact Array (ATCA) data, more recently Green et al. (2016) published HCN, HCO+, and HNC spectra, maps of integrated intensity, and the velocity field with ≈7″ resolution.
A basic concern for the present study is the morphology of the dense molecular gas. In the following, we try to improve our understanding of the interplay between the AGN, the surrounding dense gas environment, and its connection to clouds at larger galactocentric radii. After providing a comprehensive view on measured spatial and kinematical components we look (1) for the presence of a molecular hole or the opposite, a molecular hotspot, at the very center; (2) for the presence of a rotating molecular disk; (3) for the existence of a molecular bar; and (4) for the development of spiral patterns. Radial motions, frequently observed in other galaxies (e.g., Turner 1985; Feruglio et al. 2010; Bolatto et al. 2013; García-Burillo et al. 2014) are another phenomenon to be addressed.
While trying to bridge the gap between the well-known large-scale structure (e.g., Dahlem et al. 1993; Ott et al. 2001) and the sub-parsec maser disk, we also compare observed morphologies with that of the simultaneously measured radio continuum, mainly representing free-free emission from star forming regions (Bendo et al. 2016). Furthermore, we analyze our images in the light of datataken at other wavelengths and briefly compare encountered structures with those from other (carefully selected) prominent nearby starburst galaxies. A superficial first look into chemical properties is also included. Finally, a relatively simple kinematical model of a particularly well ordered component of the dense molecular gas is presented.
Initially, the origin of the rare nitrogen isotope 15N was the major motivation to carry out the present study. Traditionally assigned to low mass stars including novae, more recent models of stellar nucleosynthesis, describing the evolution of massive rapidly rotating stars, also permit the production of significant amounts of 15N through mixing of protons into helium burning shells (e.g., Woosley et al. 1995; Timmes et al. 1995). Direct confirmation of this scenario can be obtained by measuring a low (≈100) 14N/15N ratio in a well-developed starburst galaxy, in which enrichment of the interstellar medium (ISM) by ejecta from massive stars must have occurred. Chin et al. (1999) tentatively reported such a ratio for NGC 4945 based on observationswith the 15 m Swedish-ESO Submillimeter Telescope (SEST). Making use of the higher sensitivity and resolution provided by the Atacama Large Millimeter/Submillimeter Array (ALMA) this result can now be checked.
The focus of this article is the molecular gas. Describing the observations in Sect. 2, overall distributions of molecularline emission (and absorption), including the continuum, are presented in Sect 3. Section 4 provides the analysis, while main results are summarized in Sect. 5. The H42α radio recombination line, which also lies within the covered frequency range, has already been discussed by Bendo et al. (2016) in an accompanying paper.
2 Observations and data reduction
Band 3 (λ ≈ 3−4 mm) images of NGC 4945 (project code: 2012.1.00912.S) were acquired in Cycle 1 with ALMA in a compact 32 antennae configuration on 2013 January 24. The minimal and maximal baseline lengths were ≈20 m and 420 m. Among the 32 antennas only one antenna, DV11, had to be flagged (bandpass). Four spectral windows were placed in Band 3: two in the lower sideband (LSB) and two in the upper sideband (USB); the centers of the sidebands are separated by 12 GHz. The data were obtained using spectral averaging from:
(1) an H12 C14N (hereafter HCN) window centered at a sky frequency of 88.462948 GHz (rest frequency: 88.6316 GHz) with a bandwidth of 468.8 MHz (1588 km s−1) and 480 channels with a spacing of 3.3 km s−1,
(2) an H12 C15N (hereafter HC15N) window (this also includes H13 C14N (H13CN) and other lines) centered at 85.891221 GHz (86.05497 GHz) with a bandwidth of 1875 MHz (6545 km s−1) and 1920 channels with a spacing of 3.4 km s−1,
(3) a 12C32S (hereafter CS) window centered at 97.794508 GHz (97.980950 GHz) with a bandwidth of 937.5 GHz (2874 km s−1) and 960 channels with a spacing of 3.0 km s−1, and
(4) a continuum window (see also Sect. 3.1) at 99.809726 GHz (100 GHz) with a bandwidth of 1875 MHz. The spacing of each of the 128 channels is 44.0 km s−1.
The systemic velocity is only known to an accuracy of about ± 25 km s−1 (e.g., Chou et al. 2007; Bendo et al. 2016). We adopt a barycentric velocity of Vsys = cz = 571 km s−1 (optical convention; see, e.g., Dahlem et al. 1993). The differences between radio and optical velocities, Vrad – Vopt = 1.1 km s−1, and between the barycentric and local standard of rest reference systems, Vbarycentric – VLSR = 4.6 km s−1, are too small to play an important role in the following analysis.
Amplitude calibration was obtained by observing the quasar J1107–448. A flux density of 1.4 Jy was taken from the ALMA calibrator data base. Bandpass and phase calibrators were J1427–4206 and J1248–4559, respectively. While in the following relative, not absolute intensities are mainly addressed, we nevertheless estimate an absolute flux accuracy of ± 10% (e.g., Fomalont et al. 2014; Wilson et al. 2014).
The phase tracking center was αJ2000 = 13h 05m27.s28 and δJ2000 = –49°28′04.′′4 (αB1950 = 13h 02m32.s07 and δB1950 = –49°12′01.′′0; compare with Greenhill et al. 1997). The full width to half power (FWHP) field of view is ≈60″. To investigate basic morphological properties we used Briggs weighting with a robustness parameter of 0.0 (approximately half way between natural and uniform weighting) for a reasonable trade off between sensitivity and resolution. Full synthesized half power beam sizes are then ≈2.′′6 × 1.′′ 5 with position angles of ≈42°. In those cases in which we intended to include emission from spatial scales as large as possible, that is, for moment 1 and 2 and position-velocity (PV) plots (Sects. 4.6.1 and 4.6.2), we applied Briggs weighting with a robustness parameter of +2.0 in order to come close to natural weighting. This leads to almost circular full half power beam sizes of 2.′′ 1 to 2.′′ 3. According to the ALMA Cycle 1 Technical Handbook (their Fig. 6.1), the largest accessible angular scales are, at a 50% intensity level, close to 20″.
The observations lasted almost an hour with an on-source integration time of about 30 min. Five full cycles between phase calibrator and NGC 4945 were performed, integrating on the latter source for about ≈6 min per cycle. Sensitivities in the HCN- and HC15N-related windows are 0.6 mJy beam−1 in ≈25 km s−1 wide channels and 0.7 mJy beam−1 in ≈30 km s−1 wide channels of the CS window. We derived an rms noise level of ≈0.13 mJy beam−1 for the continuum emission near 100 GHz in a 310 MHz wide window (100.15–100.46 GHz, see also Fig. 1). Two versions of image cubes were created. One included the continuum emission. The other was continuum subtracted based on a linear fit to the line-free regions given in the caption to Fig. 1. The data were reduced, calibrated, and imaged with the Common Astronomy Software Application (CASA)1, version 4.0 (see McMullin et al. 2007).
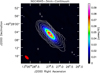 |
Fig. 1 Imageof the λ ≈ 3 mm continuum emission from the central region of NGC 4945 (1″ corresponds to a projected linear scale of ≈19 pc). The mapis based on the line-free sky frequencies of 88.27–88.38 GHz and 88.54–88.70 GHz in the H12 C14N window, 85.60–86.01 GHz and 86.28–86.42 GHz in the H12C15N window, 97.35–97.72 GHz and 98.01–98.24 GHz in the CS window, and 100.15–100.46 GHz in the continuum window (see Sect. 2). The beam size is 2.′′55 × 1.′′ 34 (0.1 Jy beam−1 is equivalent to ≈6.8 K) with a position angle of 44°.2. Contour levels are 0.5, 1, 2, 5, 10, 20, 40, 60, and 80% of the peak flux density of 96 mJy beam−1. The restored beam is shown in the lower left corner. In view of the limited extent of the emission, no primary beam correction has been applied. |
3 Results
3.1 Continuum emission and position of H2O maser disk
Figure 1 shows the 3 mm nuclear continuum emission of NGC 4945 obtained from the line free parts of the four measured bands (see also Sect. 2). Most of this emisison (84% ± 10%) originates from free-free emission (see Bendo et al. 2016 for a detailed analysis, which also suggests that missing flux is not a problem here). This is the only detected source of continuum emission inside the area covered by the ≈1′ sized primary beam. The integrated continuum flux density is 310 ± 1 mJy with a peak of 88.6 ± 0.3 mJy beam−1. We note that the errors given are those of the fit and do not include the estimated calibration uncertainty (≈10%, see Sect. 2). The beam deconvolved size (full width to half maximum) is well described by an ellipse, centered at αJ2000 = 13h 05m27.s4930 and δJ2000 = –49°28′05.′′229. Because of the high S/N of several 100 (rms noise: ≈ 0.13 mJy beam−1, see Sect. 2) the nominal position error is only ≈ 0.′′003. In view of changing weather conditions, the angle between phase calibrator and the target (≈5. °4) and the level of errors in the antenna position measurements, we cautiously estimate that the absolute position uncertainty (compare, e.g., with Chou et al. 2007 and Lenc & Tingay 2009) is of order 0.′′ 1 See also the ALMA knowledge base2, which provides (in the Recent Articles column, question 8) an absolute rms position uncertainty of 0.′′ 04).
Using the Very Long Baseline Array (VLBA) Greenhill et al. (1997) determined the position of the circumnuclear 22 GHz H2 O maser disk, obtaining αB1950 = 13h 02m32.s28 and δB1950 = –49°2′01.′′9 for the core of the curved line with a radius of ≈ 0.′′025, formed by the maser hotspots. In the J2000 system this accretion disk is then centered at αJ2000 = 13h 05m27.s48 and δJ2000 = –49°28′05.′′6 and coincides within the limits of our resolution with the dynamical center (see Sect. 4.6.1). In the following the position of the maser disk is therefore taken as synonymous for the dynamical center. The offset to our continuum peak is (Δ α, Δδ) = (–0.′′ 13, –0.′′ 37), with estimated uncertainties of 0.′′1 in either measurement. This 2.8σ discrepancy is right at the limit of our sensitivity, but supporting evidence for its reality is provided in Sects. 4.1.2 and 4.6.1.
Beam deconvolved angular dimensions of the continuum source in NGC 4945 are 5.′′ 83 ± 0.′′01 × 1.′′ 32 ± 0.′′01 (projected ≈110 pc × 25 pc) along the major and minor axes with a position angle of 41°.4± 0°.1 (compare with Bendo et al. 2016 and, for λ ≈ 13 cm and 1.3 mm, with Lenc & Tingay 2009 and Chou et al. 2007, respectively).
Detected spectral features toward NGC 4945.
3.2 Brief summary of spectral line properties
In this Sect. 3.2, we provide information on spectral properties, referring exclusively to the ALMA data presented here. The basis for detected spatial features is provided by Fig. 2. Additional information related to this image and its positions indicated by white crosses is listed in Table 2, which also provides relevant radial velocities. For those mainly interested in the more general discussion of these data, also including results from other studies, we refer to Sect. 4.
As expected, no spectral lines were found in the continuum spectral window and there are also no detected features close to those of HCN and CS (cf. Sect. 2). Table 1 summarizes the spectral features encountered in the three measured frequency bands containing molecular lines and coarsely characterizes their strength and line shape (i.e., exclusively emission or emission and absorption). The next subsections discuss estimates ofthe recovered flux for individual spectral features and provide a detailed description of the HCN J =1 → 0 morphology.Finally, a short characterization of other lines is also presented. As a general rule, molecular lines from the nuclear region of NGC 4945 tend to show relatively strong emission at blueshifted velocities in the (barycentric) velocity interval V ≈ 400–475 km s−1 southwest of the dynamical center, less emission near the systemic velocity (Vsys ≈ 571 km s−1) and a second spectral peak of line emission near V = 710 km s−1 northeast of the dynamical center. Also worth noting in this context is that the front side of the galactic plane is crossing the minor axis slightly southeast of the nucleus (e.g., Marconi et al. 2000).
3.2.1 Recovered flux density
A basic problem, when analyzing interferometric data is the amount of missing flux. Since our largest accessible angular scale is rather large, with ≈20″ at a 50% intensity level (Sect. 2), the amount of missing flux from the nuclear region should be either negligible or small (see, e.g., the single-dish maps of Dahlem et al. 1993, Henkel et al. 1994, and Mauersberger et al. 1996). Table 1(Cols. 3 and 4) provides peak flux densities derived from the 15 m SEST and those obtained by our measurements for the blue- and redshifted line peaks. It is apparent that at the peak velocities most of the flux has been collected by the ALMA observations. The only discrepancy, which may be significant, is that of CS, where the ALMA data suggest peak flux densities ≈30% lower than those obtained with the SEST. However, even here the discrepancy does not reach the 3σ level.
Cols. 5 and 6 of Table 1 list our integrated intensities from two-dimensional Gaussian fits. A comparison with SEST data obtained with a 1 arcmin beam size indicates that we have collected ≈30, 36, 44, and 50% of the total SEST emission for CS, C3 H2, H13 CN, and HCN. Uncertainties in these percentages range from ≈15% to 35% of the given values, depending on the strength of the respective line.
While our data apparently represent most of the flux at velocities near the line peaks, only 30–50% of the total velocity integrated flux density has been recovered. This can be explained by the fact that the area covered by our ALMA data encompasses only ≈10% of the SEST beam. Emission, mainly arising at near systemic velocities from the outer parts of the galaxy, is not covered by our data. As a consequence, we assume in the following, that our calibration is correct within the previously estimated 10% limits of uncertainty and that missing flux is not relevant within the central 10″ (190 pc) discussed below. Line ratios, discussed in Sect. 4.3, may be even less affected as long as spatial distributions are similar.
3.2.2 HCN J = 1 → 0
As already mentioned, HCN J = 1 → 0 is the strongest spectral feature that we observed. Therefore we use it as a reference for all other molecular lines. Table 2 and Fig. 2 reveal some basic information on detected spectral components. Figure A.1 provides channel maps with a spacing of 25 km s−1, Fig. 3 (upper left) shows a map of integrated HCN J =1 → 0 emission, and Fig. 4 shows line profiles.
The spectrum (Fig. 4) was obtained from an area of size 30″ × 30″ (≈570 pc × 570 pc). In comparison with the SEST spectra (Henkel et al. 1990, 1994; Curran et al. 2001; Wang et al. 2004), the spectral intensity dip near V = 630 km s−1 is more pronounced. This is readily explained by the large SEST beam, ≈1′, and the confinement of the HCN absorption (see below) to a small region and does not indicate substantial amounts of missing fluxnear the systemic velocity in our data. The absorption component, discussed below, was already identified by Cunningham & Whiteoak (2005) and by Green et al. (2016), using ATCA with beam sizes of 5.′′ 6 × 3.′′ 5 and 7″ × 7″, respectively.
Most ofthe emission follows a narrow ridge, hereafter termed the nuclear disk, near position angle PA ≈ +45° east of north, with line peaks detected at low velocities slightly to the southwest and at high velocities slightly to the northeast of the center. At the outermost velocities, V ≈ 350 km s−1 (spatial Peak 2 in Fig. 2 and Table 2) and 770 km s−1 (spatial Peak 11 in Fig. 2 and Table 2), these peaks show an offset of 3.′′ 5 in right ascension and 3.′′ 5 in declination. The offset corresponds to ≈100 pc.
At more intermediate blue- and redshifted velocities with respect to the systemic velocity, the nearly edge-on viewed (Sect. 4.5 and 4.6.2) nuclear disk becomes visible, directed from the center toward the southwest with its approaching and toward the northeast with its receding part. Combined, the morphology of the ridge emission resembles to some degree the millimeter-wave continuum distribution shown in Fig. 1, but the line emission is with ≈10″ (190 pc) more extended.
As already mentioned, the trough in the spectrum around V = 630 km s−1 (Figs. A.1 and 4) is caused by absorption. Absorption is seen toward the center and slightly northeast over the widest velocity range, V ≈ 510–565 km s−1 and 575–660 km s−1 (Fig. A.1). Toward the southwest, absorption is also seen, but only between 600 and 660 km s−1. Between 620 and 660 km s−1, both absorption components are spatially connected and reveal together a morphology that closely resembles that of the millimeter-wave continuum (Fig. 1). Overall, most of the absorption is seen at velocities redshifted with respect to the systemic velocity (see Figs. A.1 and 5 and the discussion in Sect. 4.7). Absolute HCN J = 1 → 0 absorption line intensities reach 50% of the peak continuum flux density (Sects. 3.1 and 3.2.5).
No absorption is seen beyond the extent of the central continuum source. However, emission is also observed well outside the ridge (Table 2, Figs. 2 and A.1). Peak 1 at V < 400 km s−1 belongs to these features, while Peak 3, also seen at low velocities, delineates the southwestern edge of the nuclear disk well displaced from the very center (for details, see Table 2). Already slightly below V = 500 km s−1, weakly emitting clouds appear to form a secondary central ridge, approximately perpendicular to the position angle of the main body of the galaxy. At V ~ 500–700 km s−1, arms can be seen at the ends of this secondary ridge, ≈10″ (projected 190 pc) from the center, directed toward the northeast from its northwestern edge, and toward the southwest from its southeastern edge (Fig. A.1 and, for further discussion, Sect. 4.7).
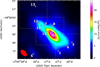 |
Fig. 2 Distribution of the main spatial HCN J = 1 → 0 features with integrated HCN intensity as background. Assigned numbers are also presented in Col. 2 of Table 2, together with additional information. This includes the offset from position 9, the peak of the λ ≈ 3 mm continuum emission (see Fig. 1), which is responsible for the absorption features seen in most spectral lines. For the three quadratic areas surrounded by white dashed lines, see Sect. 3.2.5. The value 1″ corresponds to a projected linear scale of ≈19 pc. The beam size (2.′′71 × 1.′′ 56, position angle 43°) is given in the lower left. |
3.2.3 Rare HCN isotopologues
The H13CN J =1 → 0 line (see Fig. 3, upper right, and Fig. A.2) shows, with smaller amplitudes and lower S/Ns, a similar behavior as HCN J =1 → 0. Similar to HCN, absorption is apparent in the channels between V = 525 and 650 km s−1. Again, we find more absorption at velocities slightly redshifted relative to the systemic velocity, but the clear asymmetry apparent in the HCN J =1 → 0 line is only seen in case of the redshifted northeastern part of the nuclear disk (Fig. 5 and Sect. 4.7 for further discussion). As for the main isotopologue, the absorption is confined to the extent of the nuclear continuum source, while the surrounding gas exhibits emission.
Figures 3 and A.3 show that we also detected the 15N bearing isotopologue. While S/Ns are low, HC15N is detected in the low velocity channels and then again at V ≈ 710 km s−1, displaced bya few arcseconds to the northeast, following the overall kinematics of the central region (Sect. 3.2.1). Therefore, HC15N is seen in those parts of the spectrum where the more abundant isotopologues show relatively strong emission. In the velocity range, where HCN and H13 CN are affected by weak absorption, no HC15N signal is seen; this is consistent with the overall weakness of HCN and H13 CN in this velocity interval. Figure 6 also shows this effect. While the line is seen in the total (lowest panel), central and also, tentatively, in the southwestern spectrum, the northeastern spectrum (upper panel) from the receding part of the galaxy does not show any significant peak. The spectra of the more abundant HCN isotopologues are contaminated by absorption mostly in this part of the spectrum and it is very likely that this also holds in the case of HC15N.
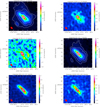 |
Fig. 3 Maps of primary beam corrected velocity integrated intensity (moment 0), obtained with a robustness parameter of 0.0 (Sect. 2). Data reduced with a parameter of +2.0 (close to natural weighting) do not reveal any additional features. The value 1″ corresponds to a projected linear scale of ≈19 pc. Upper left: HCN J = 1 → 0 emission with a restored beam of 2.′′71 × 1.′′ 56 and position angle PA = 43° (see the red spot in the lower left corner of the image). Contour levels are 5, 10, 20, 40, 60, and 80% of the integrated peak flux density of 24.0 Jy km s−1 beam−1. Upper right: H13CN J = 1 → 0 with a restored beam of 2.′′72 × 1.′′ 57, PA = 42°. Center, left: HC15N 1 → 0 (only V > 400 km s−1) with 2.′′ 72 × 1.′′ 57, PA = 42°. Center right: CS J = 2 → 1. Contours are 5, 10, 20, 40, 60, and 80% of the integrated peak flux density of 14.1 Jy km s−1 beam−1. Restored beam: 2.′′57 × 1.′′ 38, PA = 41°. Lower left: C3H2 212 → 101 with 2.′′ 72 × 1.′′ 57, PA = 42°. Lower right: C3HC2H 50 → 40. Restored beam: 2.′′72 × 1.′′ 57, PA = 42°. To convert Jy km s−1 beam−1 into K km s−1 beam−1, multiply by ≈37 (HCN), 39 (H13CN, HC15 N, C3 H2, and CH3C2H), or 36 (CS). |
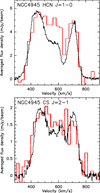 |
Fig. 4 Upper panel, black: HCN J = 1 → 0 spectrum with a channel spacing of 3.3 km s−1 from the central 0.25 arcmin2 of NGC 4945. The covered area is limited by αJ2000 = 13h 05m26s and 13h05m29s and by δJ2000 = –49°28′50″ and –49°28′20″. The ordinate displays unweighted average values from pixels of the entire area (moment –1) as a function of barycentric velocity in units of mJy beam−1. For spatiallyintegrated flux densities, multiply by 200 ± 20. Lower panel, black: A CS J = 2 → 1 spectrum with a channel spacing of 3.0 km s1 from the same region is shown. Ordinate and abscissa: same units as for HCN. For spatially integrated flux densities, multiply by 240 ± 24. Applied pixel size for both spectra: 1″ × 1″. Overlayed spectra (red) with lower velocity resolution and larger beam size (≈1′), matched to the amplitude of our spectra, are taken from Wang et al. (2004). |
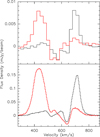 |
Fig. 5 Lowerpanel: HCN J =1 → 0 spectra with a channel spacing of 3.3 km s−1. The black line indicates the spectrum from the northeastern region (peak near V = 710 km s−1) showing absorption. The red line indicates the spectrum from the southwestern region (peak near V = 430 km s−1) showing absorption. The separation between the two regions is the line perpendicular to the nuclear disk crossing the peak of the radio continuum emission (see Figs. 2 and A.1). Upper panel: the same is shown for H13 CN J = 1 → 0, but with a channel width of 24 km s−1. The ordinate provides average flux densities per beam over the covered area. The systemic velocity of the galaxy is close to V = 571 km s−1. |
3.2.4 CS J = 2 → 1
After HCN J = 1 → 0, CS J = 2 → 1 is the strongest molecular transition in our spectral windows. With respect to the velocity integrated HCN line, the integrated CS emission (Figs. 3 and 4 and, for the channel maps, Fig. A.4) shows overall a similar spatial distribution (Fig. 3). However, because it is weaker than the HCN line and because all lines are measured with approximately the same sensitivity (Sect. 2), the emission outside the nuclear ridge is near the detection threshold. Therefore, the observed ridge appears to be narrower. A two-dimensional Gaussian fit reveals for CS J =2 → 1 a beam deconvolved FWHP size of 8.′′ 8 ± 0.′′7 × 1.′′ 9 ± 0.′′1 at a PA = +43.°2 ± 1.°1. Obviously, the emission from the nuclear ridge or disk is, as in the case of HCN J = 1 → 0, more extended than that of the continuum (Sect. 3.1).
Because of the morphological similarity between the λ ≈ 3 mm radio continuum and the integrated CS J = 2 → 1 line according to Figs. 1 and 3, we might expect that CS is even more affected by the continuum radiation than HCN and its weaker isotopologues. However, we find the opposite. While CS line intensities near the systemic velocity are also weaker than in the line wings near V = 430 and 710 km s−1 (Figs. 4 and A.4), the dip near the systemic velocity only amounts to about one-third of the peak flux density near 430 km s−1 (and not to more than two thirds), indicating a much smaller influence of the underlying nuclear 3 mm radio continuum emission. Inspection of individual channels confirms this view.
3.2.5 Other lines
Cyclic C3 H2 (c-C3H2) 212 → 101 is our third strongest line. Its emission is shown in Figs. 3, 6, and A.5. No strong emission is seen outside the nuclear disk in the moment 0 map. However, the outer arms are still weakly present in the channel maps of the Appendix. With respect to absorption, the line shows properties that are intermediate between those of HCN J = 1 → 0 and CS J = 2 → 1. c-C3H2 212 → 101 does not exhibit absorption over the entire extent of the continuum source. We find instead weak absorption northeast of the center at those velocities, where HCN shows more widespread absorption. A comparison of the overall spectra (lower panels of Figs. 4 and 6) and individual channels also shows that the deficit in emission (with respect to the line wings) at near systemic velocities (≈520–620 km s−1) is larger than that of CS but smaller than that of HCN.
There are still a few weaker molecular spectral features to be mentioned (see Fig. 6, where the top three panels (from the areas delineated by dashed white lines in Fig. 2) demonstrate the shift in radial velocity when moving along the plane of the galaxy from the southwest to the northeast with rising velocities). As is apparent from the channel maps (Fig. A.6), the CH3C2H 50 → 40 transition shows no indication for absorption. Unlike CS J = 2 → 1, which still shows a dip in the overall emission spectrum near the systemic velocity (Fig. 4), the CH3C2H profile is flat-topped and a detailed inspection of individual channels shows no pixel with negative flux densities.
While HCO is too weak for a detailed analysis, both SiO J =2 → 1 and H13 C16O+ J =1 → 0 (hereafter H13 CO+) show strong absorption. Because of heavy line blending and because this does not play a major role in the discussion (Sect. 4), we briefly note, rather than show in figures, the following: Selecting the most extreme pixels, for SiO and HCO+ isotopologues absolute flux density levels for absorption in 23 km s−1 channels reach values similar to the emission peaks. For SiO, these levels are ±9 mJy beam−1; for H13 CO+ we find ±14 mJy beam−1. The latter is corroborated, although with lower S/Ns, by the H12 C18O+ J =1 → 0 line near 85 GHz (hereafter HC18O+; see Fig. 6), where the values become about ±5 mJy beam−1. This is more extreme than in the cases of HCN and H13CN J =1 → 0, where we find (again for the most extreme pixels) absorption levels down to –48 and –9 mJy beam−1, but peak emission at 235 and 14 mJy beam−1 in 3.3 and 23 km s−1 wide channels, respectively. For completeness, the corresponding values for CS J = 2 → 1 (3.0 km s−1 channels), c-C3H2 212 → 101 and CH3C2H 50 → 40 (≈23 km s−1 channels) are 95 versus −2 mJy beam−1, 30 versus –2 mJy beam−1, and 9 mJy beam−1 versus no pixel with significant negative flux density.
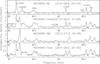 |
Fig. 6 Spectra from the broad HC15N window with seven contiguous channels smoothed, yielding a channel spacing of ≈23 km s−1. The molecular species related to detected spectral features are given in the two top panels and are described in more detail in Table 1. For H42α, see Bendo et al. (2016). Because almost 2 GHz are covered, leading to a complex correlation between velocity and frequency, amplitudes are presented as a function of observed frequency. Lowest panel: spectrum from the central 0.25 arcmin2, similar to the spectra shown in Fig. 4. Three upper panels: spectra from smaller areas, visualized by dashed white lines in Fig. 2, and include (from top to bottom) regions to the northeast of the center, close to the nucleus, and to the southwest of the center. The four numbers in parenthesis on the right-hand side of each of these designations provide the eastern and western edge (in time seconds of right ascension) and the southern and northern edge (in arcseconds of declination) of the chosen area (compare with the moment 0 maps of Figs. 2 and 3). The ordinate represents unweighted average flux densities per beam size for all pixels in the given areas, such that the values for the largest region (lowest panel), encompassing most areas with weak (or even absent) emission, are smallest. Multiply by 40 ± 4 (upper three panels) and 250 ± 25 to obtain spatially integrated flux densities. The applied pixel size is 1″ × 1″. |
4 Discussion
4.1 Spatial morphology
4.1.1 Nuclear core
The molecular emission we observed near the center originates primarily from a highly inclined rotating nuclear disk (Sects. 3.2 and 3.2.5). If it were a ring as suggested by Bergman et al. (1992) or Wang et al. (2004), we should be able to define an inner radius. Similar to Bendo et al. (2016) for the H42α recombination line, however, we see no evidence for a central hole in our data, suggesting that any such hole in the disk is smaller in size than the synthesized beam, which measures 2.6" (≈50 pc) along the major axis of the disk. This is consistent with Chou et al. (2007), who could not identify such a central void in their CO and 13CO J =2 → 1 maps either. We note, however, that their data were obtained with a synthesized beam size of 5.′′ 1 × 2.′′ 8. Our measurements have higher resolution and may trace higher density gas.
Instead of a void we find a central region with strongly enhanced integrated emission. This region is not larger than our beam size and may still be unresolved. It encompasses only ≲40 pc, which agrees with the less tight upper size limit obtained by Chou et al. (2007), ≈55 pc, and is seen in all our maps of integrated intensity (Fig. 3). The cold X-ray reflector (200 pc × 100 pc, with 50% of the X-ray emission arising from the innermost 30 pc) reported by Marinucci et al. (2012) agrees well with the sizes of our dense and dusty nuclear disk and the unresolved central core. The feature with a steep velocity gradient identified in CO J =2 → 1 by Lin et al. 2011; their Fig. 4) may also arise from this core. Only the c-C3H2 212 → 101 line (Fig. 3) shows a peak that is more extended than our beam size along the minor axis of the galaxy, possibly because it is tracing more diffuse gas (e.g., Thaddeus et al. 1985) in spite of its rather high critical density (see Sect. 4.2 for details) or because it is enhanced by photon-dominated-regions (PDRs; for the chemistry, see, e.g., Aladro et al. 2011) associated with the starburst ring proposed by Marconi et al. (2000; see below). The central ≲40 pc appear to host dense gas with particularly high column densities. While there is clearly molecular gas associated with the starburst ring of radius ≈2.′′5 (≈50 pc), proposed by Marconi et al. (2000) on the basis of near-infrared Paα data, this putative ring is not associated with peaks of molecular emission (with c-C3H2 as the possible exception; see Fig. 3). In this context we should note that the proposed Paα ring is actually a sequence of line peaks along the main axis of the galaxy with similar extent as the nuclear disk that we observed (see upper and middle left panels of Fig. 2 in Marconi et al. 2000).
For a better understanding of the central region, the radius of the sphere of influence of the nuclear engine is also of interest. With
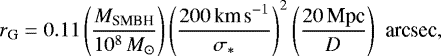
(e.g., Barth 2003), the mass of the nuclear engine MSMBH = (1–2) × 106 M⊙ (Greenhill et al. 1997), distance D = 3.8 Mpc (e.g., Karachentsev et al. 2007; Mould & Sakai 2008), and adopting σ* = 120 km s−1 as the stellar velocity dispersion (Oliva et al. 1995), we obtain rG ≈ 0.′′ 016–0.′′032 or 0.3–0.6 pc. Obviously, this scale is far smaller than our resolution and resembles that of the size of the H2 O megamaser disk (Greenhill et al. 1997).
As already mentioned, the centrally peaked molecular line intensity distributions (Fig. 3) contradict the previously proposed molecular ring structure originally discussed by Bergman et al. (1992; see also Fig. 6 in Wang et al. 2004) on the basis of single-dish 12CO/13CO line intensity ratios as a function of velocity. The same also holds for the molecular ring with an inner radius of 200 pc, reported on the basis of single-dish CO J = 1 → 0 and 2 → 1 observationsby Dahlem et al. (1993). In our denser gas tracers, we clearly see peaks in molecular line emission near V = 430 and 710 km s−1, which potentially form a circumnuclear ring at radius ≈5″ (95 pc) that encloses the nuclear disk (see also Sect. 4.7). The nuclear disk itself extending from this radius toward the unresolved nuclear core provides a rich molecular environment, giving rise to strong emission from a multitude of molecular high densitytracers.
4.1.2 Peak positions
Table 3 provides the coordinates of some relevant peak positions, i.e., those from the continuum and from the redshifted, systemic, and blueshifted emission of the CH3C2H line, which does not appear to be affected by absorption. Table 4 presents the central positions of our unblended lines that are obtained by two-dimensional Gaussian fits using the CASA viewer. The scatter in these positions encompasses ± 0.s07 in right ascension and ± 0.′′4 in declination and the weakest line, HC15N, is not an outlier. We do not see large differences between the peak positions of the various lines. However, there appears to be a small offset relative to the peak of the continuum emission. For the seven transitions listed in Table 4, we obtain an average offset of (Δα, Δδ) = (–0.′′ 60 ± 0.′′49, –0.′′ 60 ± 0.′′33). Excluding HC15N, average and sample standard deviations change insignificantly to (–0.′′ 68 ± 0.′′49, –0.′′ 68 ± –0.′′32). While the standard deviations of the mean seem to imply that the offset is not significant, we note that all seven molecular peaks lie slightly to the southwest of the maximum of the continuum emission, apparently following the main axis of the projected disk. The molecular peak closest to the position of most intense continuum emission (0.′′ 2, toward the south; for formal position uncertainties see Table 4) is that of CH3C2H, showing no absorption (Sect. 3.2.5). Bendo et al. (2016) obtained 0.′′ 2 for their H42α line, which is also not showing absorption.
Keepingin mind that all data were obtained simultaneously so that relative positions should be very accurate (possibly more precise than the 0.′′ 1 mentioned in Sect. 3.1 for absolute positions), we may thus ask, whether there is a connection between the offset and the degree of absorption aline is showing. This correlation is shown in Fig. 7. Since we do not know the depth of the absorption trough in the HC15N line (footnote c of Table 1 and Sect. 3.2.3), this spectral feature has not been included. Errors in the depth of the dip near the systemic velocity may amount to ±8% while systematic position errors are difficult to quantify. We therefore refrain from showing a fit to the data but conclude that there appears to be a change in central position with increasing absorption depth. As already mentioned, this drift points to the southwest. In view of this trend, shown by Fig. 7, the effect may be attributed to absorption predominantly occurring northeast of the dynamical center, shifting the fitted center of the molecular emission to positions southwest of the 3 mm continuum peak. This supports, in addition to the discussion of coordinates in Sect. 3.1 (and the moment 2 map of CH3C2H 50 → 40 provided and discussed in Sect. 4.6.1), our notion that the continuum peak is slightly displaced from the dynamical center of the galaxy.
It is remarkable that HCN and H13CN show similar offsets in Fig. 7, even though their optical depths are likely quite different. HC18O+, which is even more affected by absorption, has its peak at a lower offset with respect to the continuum. Whether this is due to a lower S/N (the line is weak, see Table 1 and Fig. 6) or the consequence of a different spatial distribution remains an open question.
Table 4 also provides results from the λ ≈ 3 mm lines of HNC and HCO+ J =1 → 0, taken from Cunningham & Whiteoak (2005). While the sensitivity and uv coverage of these data do not match those of our ALMA images, we nevertheless note that their HCO+ profile, showing strong absorption, appears to peak southwest of the continuum peak, while HNC, less affected by absorption, appears to peak closer to the continuum position.
Relevant CH3C2H and continuum coordinates.
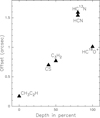 |
Fig. 7 Angular offsets (along the main axis with position angle 225° toward the southwest) of molecular vs. continuum centroid position (obtained from two-dimensional Gaussian fits) as a function of depth of the spectral dip near the systemic velocity in percent of the line peaks at V ≈ 430 km s−1. The percentages given refer to a covered area of 0.25 arcmin2 as described in Fig. 4. Molecular species are indicated. For details, also including line assignments, formal uncertainties and rest frequencies, see Sect. 4.1.2 and Table 1. |
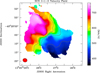 |
Fig. 8 Moment 1 velocity field of HCN J = 1 → 0, clipped at the 5σ level. Contours are 440, 520, 600, and 680 km s−1 from lower right to upper left. Primary beam correction and Briggs weighting (robustness parameter +2.0) have been applied. Therestored beam (2.′′52 × 2.′′ 17, PA = 78°) is shown in the lower left corner of the image. The cross indicates the λ ≈ 3 mm radio continuum peak. |
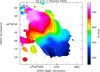 |
Fig. 9 Moment 1 velocity field of CS J = 2 → 1, clipped at the 5σ level. Contours are 440, 520, 600, and 680 km s−1 from lower right to upper left. Primary beam correction and Briggs weighting (robustness parameter +2.0) have been applied. Therestored beam (2.′′22 × 1.′′ 99, PA = 78°) is shown in the lower left corner of the image. The cross indicates the λ ≈ 3 mm radio continuum peak. |
4.1.3 Beyond the nuclear disk
Off the central ridge (i.e., the nuclear disk), our map of integrated HCN J =1 → 0 emission (Figs. 2 and 3) shows a distinct secondary peak at αJ2000 = 13h 05m28.s1, δJ2000 = –49°28′13″, (Δ α,Δδ) = (+6″,–8″) toward the southeast with respect to the continuum peak. The ratio of flux densities between the secondary and primary peaks is 0.15 ± 0.03. Near this offset position, at (+3″,–6″), lies Knot B, following the nomenclature of Marconi et al. 2000, their Fig. 2). Knot B is a region of enhanced near infrared Paα emission, related to star formation, and is located above the galactic plane of NGC 4945, toward the observer. We speculate that both objects are connected; Knot B represents merely the star forming front side of a giant molecular complex, while our data (not affected by obscuration) reveal the entire cloud. In this context it is important to note that the region encompassing the Paα and the secondary molecular peak is not seen in H42α (Bendo et al. 2016). There the 3σ H42α limit is 0.15 times its flux at the center of the galaxy. This may suggest that massive star formation is limited to the front side also accessible by near-infrared spectroscopy.
The huge cavity, ≈5″ (≈100 pc) in diameter, discovered by Marconi et al. (2000) a few arcseconds northwest of the center (see again their Fig. 2 and Pérez-Beaupuits et al. 2011) might also be apparent in some of our channel maps. The northwestern part of the Ψ -shaped structure, encountered between barycentric V ≈ 530 and 570 km s−1 (see Table 2 and Fig. A.1) may confine the bubble on its western, southern, and eastern sides. Knot C (Marconi et al. 2000) is not clearly seen in our molecular line maps. For the connection between nuclear core, nuclear disk, and the outer arms mentioned in Sect. 3.2.2, see Sect. 4.7.
4.2 Why are some lines absorbed and others not?
There are several possible reasons why we measure some lines with signifiant amounts of absorption, while at least one of our molecular transitions (the CH3C2H 50 → 40 line) and the H42α recombination line (for this, see Bendo et al. 2016) appear to be seen entirely in emission. This may be caused by (1) differentlevels of line excitation, (2) different frequencies leading to changes in continuum flux density and morphology,(3) optical depth effects, (4) drastically different, directly detectable spatial distributions, (5) different chemical properties, or (6) a wide range of associated critical densities. In the following we briefly discuss these possibilities.
(1) Excitation: All molecular lines analyzed here connect levels up to ≈10 K above the ground state. This upper limit is likely much smaller than the kinetic temperature throughout the nuclear disk, and therefore no effect due to excitation is expected.
(2) Frequencies: The frequency range of our lines is too small to allow for a strong influence of variations in continuum morphology and intensity on the strength of the absorption features. Strongest absorption is seen in the HCO+ isotopologues and SiO. HC13O+ J =1 → 0 and SiO J =2 → 1 are characterized by frequencies above that of C3 H2 212 → 101 and below HCN J = 1 → 0 and CS J =2 → 1, which are less affected by absorption. Considering HCO+ and HCN isotopologues, the amount of absorption appears to be molecule dependent and does not change significantly when considering different isotopologues at slightly different frequencies (Fig. 7).
(3) Line saturation: Optical depth effects capable of reducing the effective critical density by a factor of τ in the optically thick case do not make a notable difference. This is most apparent in our data, when considering HCN, H13 CN, and HC15N (Sect. 3.2.4). The same holds for H13 CO+ and HC18O (our data), when a spectrum from the main species (HCO+; Fig. 6 in Cunningham & Whiteoak 2005) is added.
(4) and (5) Chemistry and morphology: Aspects related to spatial distribution and molecular chemistry have to be considered together, because the chemistry may strongly affect observed morphologies in different molecular lines, and similarly, different environments may exhibit different chemical compositions. According to Table 4, all tracers show a similar, elongated distribution, as the main axis is consistent with the position angle of the nuclear disk and there is a tendency to have slightly smaller sizes for weaker lines. The latter is likely due to the noise level, which is (in absolute terms) similar for all lines (see Sect. 2). There is, however, one notable exception. While CS J = 2 → 1 is clearly stronger than c-C3H2 212 → 101 (compare Figs. 4 and 6), c-C3H2 appears to be equally extended. This is consistent with the fact that c-C3H2 is abundant in diffuse low density clouds (e.g., Thaddeus et al. 1985), while CS is more concentrated near sites of massive star formation (e.g., Mauersberger et al. 1989; Shirley et al. 2003). Possibly representing more diffuse gas and being more widespread than CS, c-C3H2 should be less affected by the compact nuclear region with strongest continuum emission. Nevertheless, absorption in the c-C3H2 212 → 101 line is more pronounced than in CS J = 2 → 1 (cf. Figs. 4 and 6).
(6) Critical densities: Using the Leiden Atomic and Molecular Database (LAMBDA; Schöier et al. 2005; van der Tak et al. 2007) and for CH3C2H Askne et al. (1984), we can obtain critical densities (where rates of spontaneous radiative decay are matched by collisional de-excitation) for all observed molecular transitions. Accounting only for the Einstein-A coefficient and the collision rate (downwards) related to the measured transition in the LAMBDA database, we obtain in order of increasing relevance of absorption for CH3C2H, CS, C3 H2, HCN, SiO, and HCO+ density values of ncrit ≈ 1 × 10⁴, 3 × 10⁵, 1 × 10⁶, 2 × 10⁶, 2 × 10⁶, and 2 × 105 cm−3, respectively. For example, CS shows a critical density similar to that of HCO+, but only HCO+ shows deep absorption that is comparable to that of SiO (Sect. 3.2.5). Thus we do not see a dependence between critical density and absorption depth in most molecular lines. The inclusion of the HNC J =1 → 0 data by Cunningham & Whiteoak (2005) with ncrit ≈ 3 × 105 cm−3 and a systemic velocity emission level of order 25% of the line peak does not make the problem more transparent. We note, however, that CH3C2H has a significantly lower critical density than all the other lines that we observed such as the CO J =2 → 1 line measured by Chou et al. (2007); in both cases, no absorption is apparent.
To summarize, notable absorption appears to be only found when critical densities are well in excess of ncrit ≈ 104 cm−3. This is likely due to different spatial distributions, which however cannot be assessed with the angular resolutions attained by Chou et al. (2007) and our study. With 84% ± 10% of the continuum caused by bremsstrahlung (Bendo et al. 2016), the higher density tracers are likely concentrated close to the many individual continuum sources related to massive star formation, while those with low critical densities should emit from more extended regions. While we think that this is the most plausible explanation, there still may be a caveat. CH3C2H 50 → 40 line emission is weaker than that of HCN/HCO+ J = 1 → 0 and CS J = 2 → 1 emission and therefore its optical depth may be lower. More severe photon trapping in the stronger lines may reduce their effective critical densities below those given here (e.g., Shirley 2015). However, this is not supported by our low estimate of the HCN J = 1 → 0 optical depth in Sect. 4.4. In any case, subarcsecond resolution is required to reveal the differences in the small-scale distributions of the molecular tracers and the millimeter-wave continuum (for comparison, see, e.g., the high resolution 2.3 GHz continuum data presented by Lenc & Tingay 2009).
4.3 Line intensity ratios
Single dish observations have already addressed a number of chemical fingerprints of the central region of NGC 4945 (e.g., Henkel et al. 1990, 1994; Curran et al. 2001; Wang et al. 2004; Monje et al. 2014). The second-to-last of these studies contains a particularly large collection of molecular tracers between 81 and 355 GHz. However, because of a lack of interferometric data these studies could not account for the influence of absorption onto overall line profiles and integrated intensities and, in addition, detailed comparisons with spectral properties of other galaxies were not yet possible more than a decade ago. Our study only covers a small frequency interval, but has superior sensitivity and angular resolution. In addition, we can refer to spectral line surveys of other galaxies. We focus on the line wings of NGC 4945 near barycentric V = 430 and 710 km s−1, where absorption does not play a role.
With respect to the molecular species that we measured, the CS/HCN ratio has been claimed to be a possible starburst/AGN tracer (Meijerink et al. 2007; Izumi et al. 2013, 2016), while CH3C2H, c-C3H2, and HCO have been identified as tracers of UV fields in galaxies (e.g., García-Burillo et al. 2002; Martín et al. 2009; Aladro et al. 2015). SiO can highlight the presence of shocks (e.g., Gusdorf et al. 2008; Guillet et al. 2009; Duarte-Cabral et al. 2014).
In the following we compare line intensities I (see Table 5) at the positions of strongest emission of the southwestern blue- and northeastern redshifted line peaks. We note, that the values differ from those given in Table 1, where area integrated intensities are derived; taking flux density or temperature ratios is not critical in this context. Since a detailed discussion of chemical issues is well beyond the scope of this article, the following offers merely some highly superficial first insights into the chemical complexity of the gas in the nuclear disk of NGC 4945. Following Fig. 17 of Meijerink et al. (2007), our I(HCN)/I(CS) line peak intensity ratios of ≈2.5 with an estimated uncertainty of 10% (see Table 6) are consistent with a PDR of density n(H2) ≈ 106 cm−3 and ≈103 times the local interstellar radiation field as well as with an X-ray Dominated Ragion (XDR) of density 104...5 cm−3. But a more detailed discussion on physical and chemical boundary conditions is clearly still required.
A comparison with the eight galaxies covered by the λ ≈ 3 mm line survey of Aladro et al. (2015) provides additional insights. Our λ ≈ 3 mm I(HCN)/I(CS) line intensity ratios are in line with seven of the eight targets studied by Aladro et al. (2015). Among these seven, NGC 253 isoutstanding. It is the strongest molecular line emitter outside the Local Group and has a distance, inclination, and infrared luminosity similar to that of NGC 4945 (see also Sect. 4.8). It is therefore selected as the representative one of the seven for Table 6. Only in M 51, the ratio is, at 5.2 ± 0.1, significantly higher. M 51 is a Seyfert galaxy in which the inner spiral arms were also part of the measurement. This adds complexity but the highratio is likely related to the presence of a nuclear jet leading to shock enhanced HCN (Matsushita et al. 2015). Our I(HCN)/I(H13CN) peak flux density ratios are, at ≈15, smaller than for most of the galaxies of the Aladro sample, indicating a relatively high optical depth. This makes sense because the data from Aladro et al. (2015) were taken with ≈25″ resolution, while in NGC 4945 we consider exclusively those two compact ≈2″ (≈40 pc) sized regions with highest unabsorbed intensity. Nevertheless, the ratios for the two ULIRGs in their study, Arp 220 and Mrk 231, are even smaller (4–7) in spite of particularly large 12C/13C isotope ratios (Henkel et al. 2014), indicating that there the bulk of the molecular gas is assembled in a compact volume of very high opacity (e.g., Rangwala et al. 2011; Aalto et al. 2015a,b; Martín et al. 2016; Scoville et al. 2017).
The galaxy with a similar I(HCN)/I(H13CN) ratio in the Aladro et al. (2015) sample is NGC 253, which is also supposed to have a similar 12C/13C ratio (see Wang et al. 2004; Henkel et al. 2014) of ≈40 versus 40–50. Therefore opacity effects should not be significant when comparing the NGC 253 and NGC 4945 data sets. From Table 6 we find that ratios are qualitatively similar, but nevertheless there are some notable differences. Following Martín et al. (2006) the chemistry in the nuclear region of NGC 253 is dominated by low velocity shocks, which can be traced by SiO. Our line ratios from NGC 4945 indicate that SiO is less prominent with respect to other tracers, so shocks may still play an important but slightly less dominant role. Surprisingly, the “ubiquitous” (Thaddeus et al. 1985) c-C3H2 is less prominent in NGC 253 than in our NGC 4945 molecular hotspots. In view of the large region studied in NGC 253, this result appears to be counterintuitive. It can possibly be explained by massive star formation and a more pronounced dominance of PDRs in NGC 4945. Another interesting feature is the underabundance of CH3C2H with respect to c-C3H2 in NGC 4945 (Table 6). If high temperatures support the formation of CH3C2H as suggested by Aladro et al. (2015), this may hint at higher temperatures in the central region of NGC 253 than in our two selected locations of NGC 4945. We conclude that the AGN in NGC 4945 (NGC 253 is devoid of an AGN) does not have a great influence. The greater dominance of PDRs in NGC 4945, a possibly higher Tkin in the nuclear region of NGC 253, and the small radius of the sphere of influence of the nuclear engine in NGC 4945 (Sect. 4.1.1) all suggest that the presence or absence of an AGN does not dominate the differences outlined above.
The I(HCN)/I(H13CN) ratios at barycentric V = 430 and 710 km s−1 are, near 15, identical within uncertainties. If the gas is well mixed, this indicates similar opacities, in apparent disagreement with the strong gradient in I(CO 2 → 1)/I(CO 1 → 0) along the major axis, from 0.9 to 1.6, obtained by Dahlem et al. (1993, their Fig. 6). CO 2 → 1/1 → 0 line ratios much larger than unity, as seen near 700 km s−1, are indicative of (1) highly excited gas with low CO opacity, (2) partially displaced CO J = 1 → 0 and 2 → 1 emitting regions with different levels of excitation or (3) relative pointing errors between the CO J =1 → 0 and 2 → 1 line data. Very high excitation is indicated by the detection of the 321 GHz line of H2 O near v = 700 km s−1 (but not at other velocities), about 1850 K above the ground state (Pesce et al. 2016). Similar I(HCN)/I(H13CN) ratios and drastically different CO 2 → 1/1 → 0 ratios near barycentric V = 400 and 710 km s−1 (0.9 versus 1.6) would suggest in the absence of CO-pointing errors that, unlike our data from high column density positions, the single-dish CO data of Dahlem et al. (1993) include large amounts of more diffuse gas.
Parameters of velocity integrated molecular lines.
Peak flux densities in single 1″ sized pixels.
Integrated line intensity ratios.
4.4 Nitrogen isotope ratio
As already mentioned in the introduction, Chin et al. (1999) reported a tentative detection of HC15N J = 1 → 0 emission, suggesting an H13 CN/HC15N ratio of order two. This has been interpreted as a hint of efficient stellar 15N ejection into the ISM of starbursts from rotationally induced mixing of protons into the helium-burning shells of young massive stars (e.g., Woosley et al. 1995; Timmes et al. 1995). NGC 4945, with its nuclear starburst, is an ideal target to test this scenario.
In view of the weakness of the HC15N line, single pixel peak flux densities, as shown in Table 5, cannot be used. Covering the entire measured region, we find for the J = 1 → 0 lines from Table 1 (Col. 6) and Table 4 (Col. 9) velocity integrated intensities of I(HCN)/I(H13CN) = 26.5 ± 2.3, I(HCN)/I(HC15N) = 227 ± 41, and I(H13CN)/I(HC15N) = 8.5 ± 1.7; the errors do not include calibration uncertainties (for these uncertainties, see Sect. 2). For 12C/13C ≈ 40–50 (Wang et al. 2004; Hitschfeld et al. 2008; for NGC 253, see Henkel et al. 2014), this would imply a plausible average HCN opacity of two and a 14N/15N ratio of ≈400. The latter matches the value encountered in the local Galactic disk (Dahmen et al. 1995) and is much higher than that tentatively deduced by Chin et al. (1999).
Nevertheless, in view of the possible influence of absorption and differences between the northeastern and southwestern edge of the inner disk (see, e.g., the huge difference in the CO J = 2 → 1/1 → 0 ratio as a function of velocity – Dahlem et al. 1993, their Fig. 6), a closer inspection is warranted. Smoothingseven contiguous channels as in Fig. 6, we obtain peak flux densities of 13.9 (H13CN-southwest), 13.5 (H13CN-northeast), 3.5 (HC15N-southwest), and 2.2 mJy beam−1 (HC15N-northeast). The latter is barely above the noise level and does not necessarily imply different abundance ratios in the southwest and northeast. Adding and dividing the respective flux densities, we obtain with this method an I(H13CN)/I(HC15N) ratio of order five. Again, this is well above the ratio deduced from the tentative detection of Chin et al. (1999) and would imply a 14N/15N value similar or slightly below that of the solar system, 270 (e.g., Dahmen et al. 1995), where some enrichment from massive star ejecta may have played a role (Chin et al. 1999). To summarize, the measured range of ratios, 14N/15N ≈ 200–500, which we find in NGC 4945, is not in contradiction with the traditional view that 15N is mainly synthesized in low mass stars. More recently, this has been also proposed by Adande & Ziurys (2012) based on Galactic data (see also Ritchey et al. 2015 and Furuya 2017).
While our observations demonstrate that the ratio is ≫100, it remains to be seen whether it is ≈200 or ≈450. This will await ALMA measurements with higher sensitivity than those presented in this work with 30 minutes of on-source integration time. Furthermore, in subsequent studies 13C/15N ratios should be quantified in more than one molecular species to account for possible fractionation effects as modeled by Roueff et al. (2015;see their Fig. 3), even though they may not be significant because of the high kinetic temperatures likely characterizing the molecular gas in the nuclear disk of NGC 4945.
4.5 Inclinations
Assuming that the observed emission arises from a flat disk with azimuthal symmetry, the ratio of the lengths of the minor to the major axis of our two-dimensional Gaussian fits provides a direct measure of the inclination. Such an estimate is not biased (as at optical or near-infrared wavelengths) by extinction due to dust. The resulting inclination angles are given in Col. 8 of Table 4. For the outer disk, i = 78° ± 3° (Ott et al. 2001), while for the nuclear region (Chou et al. 2007) proposed i = 62° ± 2° on the basis of CO J = 2 → 1 data. We also get inclinations below, or even far below, those of the large-scale disk for some lines, i.e., 71° from CS J =2 → 1 and values close to that of Chou et al. (2007) from HCN and H13 CN J =1 → 0. However, the lines also collect emission from outside the nuclear disk (Sects. 3.2.2, 4.1.3 and in particular 4.7) and thus broaden the extent of the emission along the minor axis, yielding unrealistically low inclinations. Our other four lines, HC18O+ J = 1 → 0, c-C3H2 212 → 101, CH3C2H 50 → 40 and HC15N J =1 → 0, which are too weak to trace much of the less intense emission outside the nuclear disk, yield instead i = 75°–78°, i.e., values perfectly consistent with the inclination on larger scales. We conclude that the inner disk still retains the inclination of the outer one, while some molecular lines are contaminated by emission from regions outside the inner ≈10″ × 2″ sized region representing the nuclear disk. While this is an obvious explanation for CO (Chou et al. 2007), HCN, and CS, it is remarkable that the optically thinner H13CN (but not HC15N) is following HCN. We conclude that four of our seven analyzed transitions show the same inclination as the outer disk, which would not be the case if the inclinations were different. Furthermore, the radio continuum arising predominantly from bremsstrahlung related to star formation with associated molecular clouds (Bendo et al. 2016), provides with its extent given in Sect. 3.1 an inclination of i = 76.9° ± 0.1° (see also Sect. 4.6.2 for a modeled inclination). In this sense NGC 4945 is remarkable because a correlation between nuclear and large-scale disk inclination is absent in statistically relevant samples of active spirals (e.g., Ulvestad & Wilson 1984 and Sect. 4.7 below).
4.6 Kinematics
4.6.1 Observational constraints
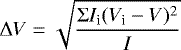
Figures 8–11 provide images of the intensity (Ii) weighted line-of-sight velocity distributions (I = ΣIi)

(moment 1) and the intensity weighted velocity dispersions
(moment 2) of the two strongest lines, those of HCN and CS. We emphasize not only basic morphological features, but we also try to account for as much large-scale structure as possible, and thus these figures present Briggs weighted images (weighting robustness parameter +2.0) to come close to natural weighting. While they are affected by different degrees of absorption, the velocity fields of HCN and CS look very similar and are at first order consistent with rotation of a disk around a central source. Furthermore, in spite of this absorption, the systemic velocity contour passes within the limits of accuracy (≈1”) through the center of the galaxy (see also Cunningham & Whiteoak 2005). However, our isovelocity contours are not as regular as those of the H42α recombination line. There, isophotes are approximately perpendicular to the main axis of the galaxy (PA ≈ –45°; see Bendo et al. 2016), giving rise to the impression that the innermost gas is rotating like a rigid body. A comparison with the H91α+H92α data of Roy et al. (2010, their Fig. 2), obtained with an even smaller beam size (1.′′ 4 × 1.′′ 2 instead of the 2.′′ 0 to 2.′′ 5 used here) also reveals this difference. While in the innermost ≈4″ (≈75 pc) their isovelocity contours areroughly parallel to each other and perpendicular to the position angle of the galaxy, their contours in the northeast (particularly the 680 km s−1 contour) are displaced northward from the main axis. This also holds in the case of CO J = 2 → 1 (Chou et al. 2007). However, our HCN data (Fig. 8) show instead a twist to the south, while CS (Fig. 9) is neutral in this respect. While it might be that absorption significantly affects the observed velocity fields, the main cause of the differences may be emission from outside the nuclear disk (Sect. 4.7).
When considering the distribution of line widths, there is another notable feature: The region with largest dispersion (≳80 km s−1 in Figs. 10 and 11) is, as expected, located at the center of the galaxy. Perhaps a part of this could be related to the nonthermal source with jet-like morphology detected by Lenc & Tingay (2009) at an offset of ≈1″ from the dynamical center. However, a detailed inspection of the spectra indicates that the fits of the central region are questionablebecause of absorption near systemic velocities (see, e.g., Sect. 3.2.2 and Table 2). Toward the northwest and southeast slightly off the region exhibiting absorption (e.g., Fig. A.1), wide line emission is seen, because here parts of the approaching and receding disk are seen simultaneously. Toward the absorbing region itself, the near-systemic velocities are blocked, thereby inhibiting meaningful fits of the line widths.
In view of the line contamination by absorption and, likely even more importantly, by gas arising from outside the nuclear disk (Sects. 3.2.2, 4.1.3, and 4.7), we thus prefer to choose the CH3C2H 50 → 40 line. While its emission is ≈35 times weaker than that of HCN J = 1 → 0, it is not significantly affected by absorption and traces solely the nuclear disk. Figures 3 and 12–13 show the distributions of velocity integrated intensity, velocity, and velocity dispersion exclusively for the nuclear disk. The velocity field turns out to be highly regular, similar to that derived for the H42α recombination line (Bendo et al. 2016). Twists to the north or south (e.g., Chou et al. 2007) are absent and the most blueshifted and redshifted velocities are found in the outermost regions of the nuclear disk along its major axis.
While the velocity field is very regular, the velocity dispersion looks more complex. Instead of one peak extended along a southeast-northwest axis (Figs. 10, and 11), we find three (Fig. 13). The central one, elongated along the main axis of the galaxy and not perpendicular to it, is accompanied by two additional regions with wider lines to the northeast and southwest, separated by a total of 5.′′ 9 ± 0.′′2. At these locations we observe the transition between rigid body rotation and steep rotation curve to a flat one (see also Chou et al. 2007). At a radius of 2.′′45 (≈45 pc) and with a rotation velocity of 140 km s−1 we obtain with Eq. (1) of Mauersberger et al. (1996; η = 1) an enclosed mass of M2.45 = 2.1 × 10⁸ M⊙ with an estimated error of 10%, in good agreement with Cunningham & Whiteoak (2005). For comparison, Roy et al. (2010) obtain with the H92α line 3 × 10⁷ M⊙ for the mass inside a radius of 1″ (≈19 pc). Furthermore, we note that the nuclear region is slightly lopsided: The center of the line connecting the two outer peaks of line width is located ≈1.′′4 southwest of the continuum peak (see Table 3). Systemic velocities (Vbarycentric ≈ 571 km s−1) are found about 0.′′9 (≈15–20 pc) southwest of the continuum peak and may be closer to the position of the maser disk (Greenhill et al. 1997) given in Sect. 3.1. While uncertainties with respect to the value of the systemic velocity (Sect. 2) and the relative positions of the continuum peak and the maser disk are significant, most of the star formation represented by the continuum emission (see Bendo et al. 2016) appears to originate slightly northeast of the dynamical center. The lopsidedness of the central region of NGC 4945 also explains why molecular lines with significant absorption show integrated intensity peaks slightly shifted to the southwest: With the bulk of the continuum arising from the northeast, line emission is likely more quenched by absorption at this side of the center than in the southwestern part of the inclined nuclear disk (see Sect. 4.1.2 and Fig. 7).
Figure 14 shows a PV diagram along the major axis, which may be compared with the CO based diagrams of Chou et al. (2007) and Lin et al. (2011). At a 3 mJy beam−1 level, no structure can be recognized except particularly prominent emission near 710 km s−1 and a less prominent enhancement near 430 km s−1. At levels >4.5 mJy beam−1 the clumpiness of the gas becomes apparent. The size of these condensations at a given velocity is of order 2″, roughly corresponding to 40 pc, which is not only the linear size of our beam but is also a characteristic linear scale of giant molecular clouds (see, e.g., Rosolowski et al. 2003 for M 33). Furthermore, the high intensity backbone of the rotation curve is steeper between barycentric V ≈ 500 and 570 km s−1 and is flatter between ≈470 and 500 km s−1 than over the entire velocity range. Overall, the PV diagram from CH3C2H shows much less complexity than that of CO J = 2 → 1 (compare with Figs. 1 and 4 of Lin et al. 2011).
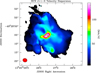 |
Fig. 10 Map of the HCN J = 1 → 0 moment 2 velocity dispersion, clipped at the 5σ level. Primary beam correction and Briggs weighting (robustness parameter +2.0) have been applied. The restored beam (2.′′ 52 × 2.′′ 17, PA = 78°) is shown in the lower left corner of the image. The cross indicates the λ ≈ 3 mm radio continuum peak, while the position of the secondary maximum in the south (also seen in Fig. 11) is inconspicuous in all other aspects. |
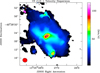 |
Fig. 11 Map of the CS J = 2 → 1 moment 2 velocity dispersion, clipped at the 5σ level. Primary beam correction and Briggs weighting (robustness parameter +2.0) have been applied. The restored beam (2.′′ 22 × 1.′′ 99, PA = 79°) is shown in the lower left corner of the image. The cross indicates the λ ≈ 3 mm radio continuum peak, while the secondary peak in the south (also seen in Fig. 10) is inconspicuous in all other aspects. |
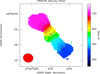 |
Fig. 12 CH3C2H 50 → 40 velocity fieldclipped at the 5σ level. Unlike in Figs. 8 and 9, the emission is confined to the nuclear disk. Primary beam correction and Briggs weighting (robustness parameter +2.0) has been applied. The contours start at 470 km s−1 and reach 695 km s−1; their spacingis 25 km s−1. The restoredbeam (2.′′65 × 2.′′ 28, PA = 80°) is shown in the lower left corner of the image. The cross indicates the λ ≈ 3 mm radio continuum peak. |
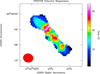 |
Fig. 13 Map of the CH3C2H 50 → 40 velocity dispersion clipped at the 5σ level. Primary beam correction and Briggs weighting (robustness parameter +2.0) has been applied. The restored beam (2.′′ 65 × 2.′′ 28, PA = 80°) is shown in the lower left corner of the image. The cross indicates the λ ≈ 3 mm radio continuum peak. |
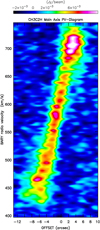 |
Fig. 14 Position-velocity plot of CH3C2H 50 → 40 along the major axis with the abscissa scaled relative to the continuum peak. Contour: 7 mJy beam−1. The plot emphasizes (1) the clumpiness of the gas, (2) the steepening of the rotation curve between barycentric V ≈ 500 km s−1 and the systemic velocity of V ≈ 571 km s−1 and (3) its flattening between 470 and 500 km s−1. |
4.6.2 Kinematical model of the nuclear disk involving tilted rings
From the data cube (e.g., Fig 12) it is evident that NGC 4945 contains a rather well-behaved, regularly rotating nuclear disk that is best seen in our CH3C2H 50 → 40 line (1) because of an absence of significant absorption and (2) because weaker spatial components outside the disk are below our sensitivity limit. It is in principle straightforward to perform a parametrization of this (and other) line(s) in terms of a (tilted-) ring analysis (Rogstad et al. 1974). As, however, the disk is observed to be at high inclination and the half power width of the point spread function is large compared to the diameter of the disk along the minor axis, a kinematical analysis on a velocity field might fail: line of sight and smearing effects render a velocity field unreliable. In addition we are interested in the radial profiles of the line strengths of the detected lines and we want to test the feasibility of simultaneous fits of several lines. This is only possible with a three-dimensional modeling approach, in which an observation is simulated, based on input parameters, to then adjust the parameters based on a comparison of observed and modeled data. Here we hence attempt a (tilted-)ring modeling with the software TIRIFIC (Józsa 2007, 2016).
The naturally weighted data cube was primary beam corrected and converted to radio velocity using 85.45727 GHz (see Table 1) as reference frequency. Accordingly, the CH3C2H line is tracked at the correct velocity, while in addition the c-C3H2 212 –101 line and H42α (for the latter, see Bendo et al. 2016) are also part of this analysis. Furthermore, the analyzed PV plots show weak emission from lines likely belonging to HOCO+ 404 → 303 (νrest = 85.53148 GHz) and c-C3H2 432 → 423 (νrest = 85.65642 GHz), which are too inconspicuous to be apparent in the spectra shown in Fig. 6. To accelerate the analysis the data cube was binned along the spatial axes (still providing a pixel size fully sampling the synthesized beam).
The fitting strategy follows an established path (see, e.g., Zschaechner et al. 2012; Gentile et al. 2013; Kamphuis et al. 2013; Schmidt et al. 2014; de Blok et al. 2014). Including a large set of parameters in the model (e.g., inward or outward motion, vertical motion, and several modes of surface brightness inhomogeneities) necessarily leads to a good fit at the expense of a more and more arbitrary model parametrization. Too many parameters can be degenerate to some degree. We hence intend to find the simplest model that compares well to the data. We point out that both the definition of simple and the notion of a good fit is subjective. We also cannot guarantee to have found a unique solution. On the other hand we tested a wide range (see below) of parameter combinations, such that the solution presented is rather well established.
Fitting started with a flat-disk model, assuming a flat rotation curve. The number of nodes between which the model is interpolated using an Akima interpolation is varied from parameter to parameter. Beyond a radius of 15″, there is no meaningful observational contribution to any model. Near 2″, we are limited by our angular resolution. The rotation curve rises steeply at the center, which is why we choose a denser sampling there.
A simple rotating disk model already gives a reasonable fit to the data. In the following we fit four disks simultaneously to the data, also with the aim to check whether CH3C2H and H42α model parameters are consistent with those of C3 H2 212 → 110 (hereafter c-C3H2–2) and the line assigned to c-C3H2 J = 432 → 423 (hereafter c-C3H2–4). It is assumed that all lines share rotation velocity, inclination, position angle, and central position. Notably, the c-C3H2–4 and H42α lines have some channels in common, which is why the weak C3 H2 J = 4 feature had to be included in the model. Otherwise TIRIFIC’s χ2 -minimization would be pushed into a wrong minimum. The parameterization of the c-C3H2–4 disk is however unreliable. c-C3H2–2 shows strong absorption, which is why the model surface brightness (Fig. 15, upper panel) is unreliable near the center.
Both a radially varying scale height and a radially varying velocity dispersion can improve fits to the data. These parameters were found to provide best fits if varied independently from each other for each line.
TiRiFiC allows us to test the following kinematic behavior: A central radial (in- or outward) motion (parameter V RAD) can vary linearly with height |z| above or below the plane (parameter DV RA, see also Schmidt et al. 2014), i.e.,

This motion is performed parallel to the main disk. We tested the following scenarios, keeping parameters identical for all lines: (1) radially varying radial motion in addition to radially varying vertical gradients of the radial motion, (2) constant radial motion at all radii, and (3) constant radial motion at a given vertical height at all radii and a constant vertical gradient of the radial motion at all radii.
As the latter provided a comparable fit to the other solutions and was slightly favorable compared to a model with a constant radial motion throughout the disk, we used this model to reduce the numbers of nodes for the rotation curve to obtain the final solution (Figs. 15–18). Fitting started with a flat-disk model, assuming a flat rotation curve. Initial parameters (constant surface brightness, inclination, position angle, rotation speed) were based on a rough inspection of the cube. While TiRiFiC in the chosen nested-interval mode depends on an initial guess of parameters, it generally converges quickly starting from a rough guess if the number of initial parameters is low. Consecutively, the number of parameters were increased to allow, for example, an implementation of a radial surface brightness profile, a rotation curve, and additional parameters. When it was found that the introduction of additional parameters did not visibly improve the model, we chose not to use those parameters. Errors were estimated by fitting the two (in the model identical) halves of the galaxy independently (segments 1, 2, 3, and 4 on one and segments 5, 6, 7, and 8 on the other side, covering in this way the four lines) and taking the average deviation from the final solution averaged over this and the one or two neighboring nodes as the error.
Representing the results for modeled segments 1, 2, 3, and 4, Fig. 15 shows the surface brightness of the various tracers as a function of galactocentric radius, indicating peak values in the inner 5″. Figure 16 provides the rotation curve (upper panel), rising fast and settling between 130 and 180 km s−1 at larger radii, consistent with, for example, Ott et al. (2001). Position angle and inclination could be kept constant, the latter to a slightly lower value than that favored in Sect. 4.5, which was based solely on the ellipticity of the measured distributions and the assumption of azimuthal symmetry. An inclination of 75° to 78° (see Sect. 4.5) would correspond to deviations of order 2.5–5.5σ, given the error bars in Fig. 16. Figure 17 provides scale heights of order 20–30 pc at galactocentric radii of 5″–15″, while the velocity dispersion (Fig. 18) is of order 20 km s−1 except for our C3 H2–4 line, where S/Ns and blending with H42α likely lead to unreliable results.
Using the obtained model parameters, we created PV diagrams along the most important lines, one cut along the major axis and three perpendicular to it crossing either the dynamical center of the galaxy or the southwestern 430 km s−1 and northeastern 710 km s−1 peaks (Fig. 19). Figure 20 shows both the observed (blue contours) and the modeled (red contours) distributions in the form of PV-diagrams along these four cuts from the northeast to the southwest (upper left panel) and from the southeast to the northwest (other panels). The overall agreement is good. A careful comparison of the minor axis PV diagrams shows that particularly the c-C3H2–2 and CH3C2H lines (some and likely no absorption, respectively; see Sect. 3.2.5) provide evidence for noncircular motion. In Fig. 20, from left to right, rising velocities (and not merely widened line widths) are encountered along the minor axis. With the southeastern (left) parts of the minor axis cuts representing the near and the northwestern (right) parts the far side of the galaxy (Sect. 3.2), the rising velocities toward the far side imply radially outflowing gas. The second panel of Fig. 16 provides the absolute value of the DV RA parameter, where we set V RAD = 0. A careful inspection of the velocity gradients in Fig. 20 along the minor axis reveals outflow velocities of order 50 km s−1. This corresponds in the model to theDVRA value at 1″ above or below the plane of the galaxy (Fig. 16, second panel), which is roughly consistent with the modeled thickness of the nuclear disk (Fig. 17). Higher sensitivity and resolution measurements of various tracers would be worthwhile to obtain more information on the distribution, kinematics, mass, momentum and energy of this gas in the nuclear disk.
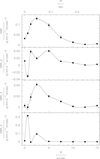 |
Fig. 15 Final parametrization: surface brightness. Negative values might reflect statistical errors, but might also be due to absorption. From top to bottom we present c-C3 H2 J = 212 → 110 (SBR), CH3C2H 50 → 40 (SBR-2) and, overlapping, c-C3H2 J = 432 → 423 (SBR-3) andH 42α (SBR-4; see Table 1 for details to the transitions). The abscissa shows galactocentric radii and the ordinate shows emission in units of Jy km s−1 arcsec−2. Further information is given in Sect. 4.6.2. |
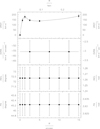 |
Fig. 16 Final parametrization (from top to bottom): rotation velocity, vertical velocity gradient DV RA (see Sect. 4.6.2), inclination, and position angle as a function of galactocentric radius. These are the parameters, which are assumed to be shared by all the lines included in Figs. 15, 17, 18 and 20. |
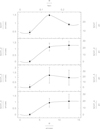 |
Fig. 17 Final parametrization: full scale height. From top to bottom: in the same order as in Fig. 15, c-C3 H2 (SCHT), CH3C2H (SCHT-2) and, overlapping, c-C3H2 (SCHT-3) and H 42α (SCHT-4). The ordinate on the left-hand side shows scale height in arcseconds; the ordinate on the right-hand side denotes scale height in pc, both as a function of galactocentric radius. |
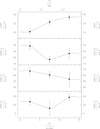 |
Fig. 18 Final parametrization: Intrinsic dispersion (see Sect. 4.6.1) as a function of galactocentric radius (this may be compared with Fig. 13). From top to bottom we show as in Fig. 15 c-C3 H2 (DSP), CH3C2H (DSP-2) and, overlapping, c-C3H2 (DSP-3) andH 42α (DSP-4; see Table 1). |
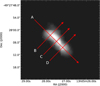 |
Fig. 19 Slicepositions of PV-diagrams in Fig. 20 overlaid on a velocity integrated intensity map of the CH3 C2H 50 → 40 line (see, e.g., Table 1 and Fig. 3.) The PV-diagrams in Fig. 20 are all directed from left (east) to right (west). |
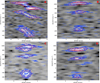 |
Fig. 20 PV-diagrams along the lines shown in Fig. 19, each with (from top to bottom) c-C3 H2 212 → 101, CH3 C2H 50 → 40 and, overlapping, C3H2 432 → 423 and H42α. The velocity scale refers to that of the CH3C2H line (see Sect. 4.6.2 and Table 1). Dark: low intensity; light gray: high intensity. Top left panel: cut A (see also Fig. 19) along the major axis from the northeast toward the southwest. Top right panel: cut B perpendicular to the major axis crossing the 710 km s−1 peak from the southeast toward the northwest. Bottom left panel: cut C perpendicular to the major axis, central line. Bottom right panel: cut D perpendicular to the major axis crossing the 430 km s−1 peak. A, B, C or D are displayed in the upper right corner of their respective panels. Blue contours: original data cube. Red contours: model data cube with constant vertical gradient in radial motion and finalrotation curve (see top two panels of Fig. 16). Contours: 0.1, 0.2, 0.4, 0.8 mJy beam−1. |
4.7 The bar
From systematic observations of spiral galaxies with high resolution it is known that the orientation of the outer large-scale disk is not connected with that of the innermost accretion disk (e.g., Ulvestad & Wilson 1984). This has been established in a particularly convincing form for those H2O megamaser galaxies, where the 22 GHz water vapor hotspots form a close to edge-on circumnuclear disk with Keplerian rotation and a characteristic size of 1 pc, providing direct information on the innermost geometry of the galaxy. NGC 4945 (Greenhill et al. 1997)and NGC 1068 (see below and, e.g., Greenhill et al. 1996; Gallimore et al. 2001) belong to this class of objects.
For thegas to travel from kpc scales to the accretion structures at ≈1 pc, almost the entire angular momentum must be lost to feed the central monster. Gravitational torques may provide an efficient mechanism. The bars within bars model proposed by Shlosman et al. (1989) postulates the presence of a series of embedded bars, gradually removing the angular momentum from the gas, distorting its orientation and funneling it into the central region of a galaxy. While the determination of disk orientations in the central parsec requires interferometric observations at radio wavelengths, measurements of such galaxies on larger scales down to ≈100 pc are possible thanks to the Hubble Space Telescope (HST). Greene et al. (2013) and Pjanka et al. (2017) have investigated the orientation of 18 such disk-megamaser galaxies and have found that structures on a ≈100 pc scale are consistent with being randomly distributed with respect to both the kpc-sized large-scale and the pc-sized megamaser disks.
Based on H I and CO data with 23″ resolution from NGC 4945, Ott et al. (2001) found systematic departures from uniform circular motion and S-shaped velocity contours suggesting the presence of a large-scale kpc-sized bar at position angle ≈35° and approximate azimuthal angle (counterclockwise) of 40° extending out to ~150″ from the nucleus.
Lin et al. (2011) modeled the inner few 100 pc of NGC 4945, which is closer to the scales discussed in this work. These authors demonstrated that S-shaped CO iso-velocity contours can be reproduced by a shock along spiral density waves, which are excited by a rapidly rotating bar. In view of the radio recombination line analysis of Bendo et al. (2016) and the CH3C2H velocity field presented in Fig. 12, we cannot confirm the presence of S-shaped iso-velocity contours in the 10″ × 2″ sized nuclear disk. Furthermore, their adopted inclination for this nuclear disk (62°) appears to be too low by at least 10° (Sect. 4.1.1 and Fig. 16). Nevertheless, making use of our most intense line, that of the high density tracer HCN J = 1 → 0, we can study the connection between the nuclear disk and its dense surrounding gas in unprecedented detail.
We do not find outer rings or tori off the major axis of the nuclear disk, in a broad velocity range (≈100 km s−1) around the systemic velocity; instead we find two arms, the western one bending to the north and northeast, the eastern one bending toward the south and southwest (Figs. A.1 and 21). Each of these arms extends mainly along the declination axis over at least ≈15″; this is close to the largest accessible angular scale of our measurements (see Sect. 2), corresponding to 250–300 pc. Length, orientation, and curvature are in impressive agreement with the two spiral arms proposed by Lin et al. (2011; their Figs. 4 and 6), except near the center, where the arms do not wrap around the nucleus, but appear to start on their respective side.
Near the systemic velocity there is a narrow velocity range, where absorption toward the nucleus is relatively weak and emission can be viewed partially also in between the inner starting points of the arms. We may recognize in the HCN J = 1 → 0 image a direct connection between the two arms (Fig. 21 and also Fig. A.1). While the CS J = 2 → 1 line is overall weaker (e.g., Tables 1 and 4 and Fig. 4), it is less affected by nuclear absorption (Fig. 4 and Sect. 4.2) and therefore provides a clearer view onto the connection between the arms and the nuclear disk. We find (Fig. 22) a broad east-west connection, extending (due to a lesser influence of absorption) more to the south than in the HCN J = 1 → 0 image. Thisis the signature of a bar-like feature having a total length of slightly less than 10″ (≈150 pc linear size, corresponding to ≈600 pc at i ≈ 75°). This connecting bar-like feature (hereafter termed the bar, which is smaller than the bar proposed by Ott et al. 2001)apparently touches the nuclear disk at its near and far side at a galactocentric radius of ≈100 pc (assuming azimuthal symmetry for the nuclear disk) and may allow for substantial inflow of gas. In projection, the bar is not located exactly perpendicular to the nuclear disk, but is elongated roughly along the east-west direction and may form an azimuthal angle of ≈60°, counterclockwise, to the midline of the nuclear disk in the plane of the sky. The eastern side, which is the front side of the bar, is located partially in front of the northeastern side of the continuum source and might therefore provide more severe absorption there than in the southwest. Such an enhanced absorption is not clearly seen by our HCN and H13CN J = 1 → 0 spectra (Sect. 3.2.2 and Fig. 5). However, most of the northeastern absorption of HCN and H13CN J = 1 → 0 (Figs. A.1, 5 and A.2) is seen at receding velocities with respect to the systemic velocity and therefore suggests inflow. These are the kinematics expected in the case of a bar. Using the Herschel Space Observatory and analyzing HF J = 1 → 0 absorption lines toward the nuclear region of NGC 4945, Monje et al. (2014) found a velocity component centered at ≈640 km s−1, redshifted with respect to the systemic velocity of the galaxy. This was interpreted as inflow from radial distances ≲200 pc, which agrees with our much higher resolution data. The scenario resulting from our measurements including Sects. 4.6.2 and 4.7 is schematically shown in Fig. 23.
The recently detected 36 GHz Class I methanol maser (McCarthy et al. 2017), located ≈10″ southeast of the center, is (if part of the plane of the galaxy) several 100 pc off the AGN and is thus likely either part of the front side of the bar or part of the southeastern arm. This agrees well with the findings of Ellingsen et al. (2017) that the 36 GHz Class I methanol masers in NGC 253 are located at a projected distance of order 300 pc off the center.
To summarize, we propose that there is an inflow of gas through the bar from galactocentric radii of ≈300 to ≈100 pc toward the nuclear disk. On the other hand, the rotation of the nuclear disk, reaching galactocentric radii of up to ≈100 pc at azimuthal angles ≈60° off the bar, is disturbed by outflowing gas. The strong emission from the outer edges of the nuclear disk, seen at 430 and 710 km s−1, may thus not merely be caused by its geometry, with tangentially viewed locations of a highly inclined rotating disk yielding particularly large column densities near Vsys ± Vrot. Instead, the peaks in line emission may be further enhanced by the fact that inflow from the bar meets outflow from inside the nuclear disk, leading to the formation of a ring near r = 100 pc.
4.8 Specific case of NGC 4945
To place our analysis in a slightly broader context, we compare our findings with respect to the properties of the nuclear region of NGC 4945 with those of two additional nearby galaxies. One of these was selected on the basis of being as similar as possible with respect to NGC 4945. Furthermore, it can be considered as the template for star forminggalaxies outside the Local Group. This galaxy has been observed with a linear resolution similar to ours and is, like NGC 4945, also suitable for a comparison with the less active central molecular zone (CMZ) of our Galaxy. The other target is a slightly more distant object that is even more active than NGC 4945, which allows us to check how differences in overall activity (i.e., infrared luminosity) may influence central regions on ≈100 pc sized linear scales.
The first of these two galaxies is NGC 253. NGC 4945 and NGC 253 share many properties. Both are starbursting galaxies with similar infrared luminosity, distance, inclination and position angle (e.g., Henkel et al. 1986; Engelbracht et al. 1998; Walter et al. 2017) and also appear to show similar 12C/13C ratios and HCN J = 1 → 0 optical depths (Sect. 4.3). Even the position angles of their bars are not far apart (≈90° for NGC 4945 and ≈65° for NGC 253; Canzian et al. 1988; Engelbracht et al. 1998; Iodice et al. 2014). However, projected sizes of their nuclear disks are very different with 10″ versus 30″ (≈200 versus 600 pc). Themore widespread dense gas in NGC 253, not containing an AGN, does not show the kind of nuclear concentration seen in NGC 4945. The NH3 data from Lebrón et al. (2011) and the multiline images from Meier et al. (2015) and Walter et al. (2017) provide good examples for the morphology of the dense gas in NGC 253. Maps of these non-CO molecular tracers reveal no overwhelmingly strong emission from the nucleus of NGC 253, but exhibit instead a chain of blobs along the plane of the galaxy, extending over more than half a kpc. We note, however, that if the bar in NGC 4945 were not seen ends-on but from the side, we would see molecular emission along a similarly extended ridge as toward NGC 253. NGC 253 also hosts a (likely starburst-driven) wind with a rate of roughly 9 M⊙, limiting nuclear star formation activity (Bolatto et al. 2013), as well as a spectacular 1.5 kpc sized OH plume also indicating outflowing molecular material from the nuclear region (Turner 1985). The above similarities and the molecular outflow in NGC 253 suggest that both galaxies, NGC 4945 (see Sect. 4.6.2) and NGC 253, share outflowing molecular gas in their central parts and possibly inflowing molecular gas associated with their respective bars farther outside.
NGC 1068, the other galaxy, shows a much higher degree of activity. Recent ALMA studies were obtained by García-Burillo et al. (2014, 2016, 2017) and Viti et al. (2014). This LIRG (to our knowledge the nearest one) hosts a slightly off-centered molecular disk of size ≈350 pc with a warped innermost disk-like structure of a few parsec in length. Outside the disk, CO traces two elongated filaments parallel to the major axis of a large-scale bar, while a pseudo-ring consisting of two arms is encountered at its outer end. Inflow is found inside this ring and the outer bar region. However, further inside the kinematics of the circumnuclear disk and a bow shock at a galactocentric radius of ≈400 pc reveal an outward flow perturbed by rotation. The molecular outflow rate is much higher than the star formation rate and is therefore likely AGN driven.
Apparently, in NGC 1068 the boundary between inner outflowing and outer inflowing gas is located at much larger radii than in NGC 4945, which is possibly related to the different activity levels of their respective AGN. To summarize, all three well-studied galaxies, i.e., NGC 253, NGC 1068, and NGC 4945, share outflowing gas in their inner regions, while farther out at least NGC 1068, likely along with NGC 253 and NGC 4945 (because of their bar-like structures) experience inflow. In this context we still have to emphasize that the outflow that we see in the nuclear disk does not include the spatially unresolved molecular core of size ≲2″, which is much smaller in linear size than the nuclear disk in NGC 1068. Again, a stronger AGN activity in NGC 1068 might be responsible for this difference.
As already mentioned, bars can change the orientation of parts of their parent galaxies and the presence of several bars can distort the geometry in a way that even on intermediate (≈100 pc) scales there is little connection to the orientations at largest and smallest scales (e.g., Pjanka et al. 2017). However, NGC 4945 does not show any such change in spite of the suggested presence of a bar (Figs. 21 and 22) reaching the nuclear disk at a galactocentric radius of ≈100 pc and the more extended bar at a different azimuthal angle farther out proposed by Ott et al. (2001). This is a puzzle that remains, for the moment, unexplained, leaving NGC 4945 as one of the few known megamaser galaxies (Pjanka et al. 2017) forming a pc-scale 22 GHz H2 O disk, a nuclear 200 pc scale disk and a large-scale disk with similar orientation.
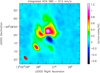 |
Fig. 21 Primary beam corrected HCN J = 1 → 0 emission (Briggs weighting with a robustness parameter of 0.0) integrated over the velocity interval 585–612 km s−1, the near systemic velocity range, where nuclear absorption is not as strong as at adjacent velocities. The arms (mainly green, see Sect. 4.7) are visible in the northwest and southeast, likely connected by the elongated region of strong emission along an east-west axis. See Fig. 22 for an even clearer image, where absorption plays a lesser role. |
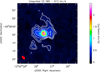 |
Fig. 22 Primary beam corrected CS J = 2 → 1 emission (Briggs weighting with a robustness parameter of 0.0) integrated over the velocity interval 585–612 km s−1, the near systemic velocity range, where nuclear absorption is not as strong as at adjacent velocities. Contours are 0.025, 0.05, 0.1, 0.2, 0.4, 0.6, and 0.8 times the integrated peak flux density of 2.48 Jy km s−1 beam−1. Overall, line absorption plays a lesser role than in Fig. 21. While the southern region of enhanced emission is part of the southeastern arm, the hotspot around 7″ farther to the east is (as in Fig. 21) a separate feature, possibly related to Knot B of Marconi et al. (2000; see our Sect. 4.1.3). |
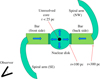 |
Fig. 23 Sketch of the central parts of NGC 4945 viewed from a position above the plane and on top of the center of the galaxy. The blue arrows indicate modeled or observationally suggested radial motions of the gas. |
5 Conclusions
We have observed the dense molecular gas with linear resolution of ≈40 pc in the nuclear region of the prominent southern starburst galaxy NGC 4945 using 32 ALMA antennas in compact configuration during Cycle 1. λ ≈ 3 mm (Band3) spectral line imaging in the range (rest-frame) 85.1–86.9 GHz and around 88.6 and 98.0 GHz led to the following main results:
(1) While showing a higher degree of activity, the central part of NGC 4945 is viewed with a similar inclination as our Galactic center region (i ≈ 75° versus 90°) and with a similar position angle (45° versus 63°). The receding side is also located in the northeast and a bar is only a few 10° off our line of sight. In addition, the central part of NGC 4945 may exhibit a similar lopsidedness as the central molecular zone (CMZ) of our Galaxy (e.g., Ginsburg et al. 2016) with star formation most vigorously occurring slightly northeast of the center (for NGC 4945 defined in this work as the location of the maser disk – Greenhill et al. 1997). The radio continuum mainly representingfree-free emission from star forming regions appears to peak slightly (less than an arcsecond) northeast of the central megamaser disk of the galaxy. This is corroborated (a) by a comparison with the position of the megamaser disk, (b) by a comparison with molecular line peak positions, (c) by a comparison with the moment 2 distribution of our CH3C2H 50 → 40 map, and (d) by a comparison with the line of systemic velocity in the corresponding moment 1 map.
(2) Most molecular lines that we observed are affected by absorption toward the nuclear millimeter-wave continuum source at velocities from about –60 to +90 km s−1 relative to the systemic velocity (taken as 571 km s−1 on a barycentric scale). The only line that is not affected by significant absorption is the CH3C2H 50 → 40 transition, likely due to its low critical density with respect to the other molecular lines studied in this work. With the radio continuum apparently peaking slightly northeast of the maser disk, line emission being affected by absorption against this continuum component is shifted toward the southwest.
(3) Inside the roughly 10″ × 2″ (≈200 pc × 40 pc) sized nuclear disk there is a spatially unresolved molecular core of size ≲2″ (≲40 pc) with particularly intense molecular line emission that is consistent in size with the core of the nuclear X-ray source detected by Chandra (Marinucci et al. 2012). Outside, starting at deprojected galactocentric radii of ≈300 pc (adopting an inclination i = 75°), we find two spiral-like arms: one in the west turning toward the northeast and one in the east turning toward the southwest. The front and back sides of the nuclear disk are connected to the arms by a thick bar-like gaseous feature extending (again adopting i = 75°) from galactocentric radii of ≈100 pc out to ≈300 pc. This bar-like structure is seen almost ends-on at a position angle of ≈90° east of north; the eastern section is the front side. This configuration may be responsible for the fact that the northeastern part of the continuum source is absorbed over a wider range of velocities than the southwestern one. If the bar-like component were seen from the side, the extent of the central molecular ridge would approximately triple from 10″ to 30″ and would then be similar in size to the nuclear region encountered in NGC 253. But this central molecular ridge would contain a prominent compact core that is absent in NGC 253. Considering molecular line intensity ratios between NGC 253 and the molecular peak positions in NGC 4945, notable differences are found with respect to SiO, c-C3H2, and CH3C2H in the λ ≈ 3 mm band. The recently detected Class I methanol maser in NGC 4945 (McCarthy et al. 2017) is likely either part of the front side of the bar or part of the southeastern spiral-like arm and thus, similar to the corresponding masers in NGC 253 (Ellingsen et al. 2017), very far from the dynamical center of the galaxy.
(4) Position-velocity cuts perpendicular to the plane of the galaxy, following the minor axis, reveal outflowing gas with a characteristic deprojected velocity of 50 km s−1 for the nuclear disk. Farther out, if the bridge between the outer arms and the nuclear disk represents a bar, gas should be inflowing. Thus the 430 and 710 km s−1 componentsat the outer edges of the nuclear disk at galactocentric radii of ≈100 pc may not only be prominent for geometric reasons but also because inflow from outside may meet outflow from inside the nuclear disk, possibly forming a ring confining the nuclear disk.
(5) It is remarkable that on all scales, from the extended disk encompassing >20 kpc to the H2 O megamaser disk highlighting the central parsec, position angle and inclination do not appear greatly changed. While the assumption of azimuthal symmetry suggests i = 77° for the nuclear 10″ × 2″ disk, the application of a ring model leads to a best value of 72°–73°.
(6) Initially designed to prove that the rare 15N isotope is mainly synthesized in massive rotating stars, our project does not provide a clear-cut result in this respect. Instead of confirming a previous tentatively obtained very low 14N/15N ratio of ≈100 (Chin et al. 1999) explained bylarge amounts of 15N being ejected by rotating massive stars in the starburst region, we obtain a much higher ratio in the more common range between those of the solar system and the local interstellar medium (200–500). Thus, 15N being mainly formed by lower mass (< 8 M⊙) stars, as proposed by Adande & Ziurys (2012) for Galactic sources, is a viable alternative in view of the data from NGC 4945 as well.
(7) A position-velocity diagram of the nuclear disk in the CH3C2H 50 → 40 line indicates slight deviations from a straight line in the southwestern part. Furthermore, individual molecular complexes of size ≲40 pc could be identified, possibly representing giant molecular clouds.
(8) We neither find a pronounced molecular counterpart to the star forming ring at r ≈ 50 pc proposed by Marconi et al. (2000) and based on near infrared Paα line data nor emission from their Knot C, northwest of the nuclear disk. Their Knot B in the southeast, however, is likely detected delivering the strongest HCN J = 1 → 0 and CS J = 2 → 1 emission peak outside the nuclear disk. Furthermore, the northwestern part of the Ψ-shaped structure encountered in HCN J = 1 → 0 between barycentric V ≈ 530 and 570 km s−1 (Table 2 and Fig. A.1) may confine the supernova-driven superbubble reported by Marconi et al. (2000) in the east, south and west.
Now that we know which tracer can provide a realistic description of the distribution of dense molecular gas in the innermost regions of NGC 4945 without being strongly affected by absorption, more sensitive measurements of CH3C2H with similar resolution as those presented in this work are not only mandatory but will also be feasible by making use of the high sensitivity of ALMA. An essential part of such studies would be a characterization of the outflow, for example, AGN or starburst related, and the properties of the gas in the bar-like structure. To achieve these goals, measurements of the excitation conditions of the gas would also be desirable. Most urgent, however, are observations with significantly higher resolution, aiming to resolve the ≲2″ molecular core. This core, giving rise to strong quasi-thermal emission, has so far not been studied but has the potential to close the main remaining gap in our knowledge between the large-scale properties and the nuclear pc-scale 22 GHz H2 O maser disk in one of our nearest and most prominent extragalactic molecular goldmines, NGC 4945.
Acnowledgements
We wish to thank an anonymous referee for helpful comments. This work was partially carried out within the Collaborative Research Council 956, subproject A6, funded by the Deutsche Forschungsgemeinschaft (DFG). G.I.G. Józsa was supported by the National Research Foundation of South Africa (grant number 109048). Y. Gong was supported by the National key research and development program under grant 2017YFA0402702 and the National Natural Science Foundation of China (NSFC grant nos. 11127903). S. García-Burillo appreciates economic support from Spanish grants ESP2015-68964-P and AYA2016-76682-C3-2-P. R. S. Klessen acknowledges support from the DFG via SFB 881 (subprojects B1, B2, and B8) and in SPP 1573 (grant numbers KL 1358/18.1, KL 1358/19.2). RSK furthermore thanks the European Research Council for funding in the ERC Advanced Grant STARLIGHT (project number 339177). The paper is based on observations carried out with the Atacama Large Millimeter/Submillimeter Array (ALMA). Project: ADS/JAO.ALMA#2012.1.00912.S (Cycle 1). ALMA is a partnership of ESO (representing its member states), NSF (USA) and NINS (Japan), together with NRC (Canada) and NSC and ASIAA (Taiwan) and KASI (Republic of Korea), in cooperation with the Republic of Chile. The Joint ALMA Observatory is operated by ESO, AUI/NRAO and NAOJ. We wish to thank the members of the German ALMA Regional Center (ARC) node at the Argelander-Institut für Astronomie of the University of Bonn for their support and help with the data reduction. This research has made use of NASA’s Astrophysical Data System. The NASA/IPAC Extragalactic Database (NED), also used, is operated by the Jet Propulsion Laboratory, California Institute of Technology, under contract with the National Aeronautics and Space Administration. Finally, we made use of HyperLeda (http://leda.univ-lyon1.fr) from the University of Lyon.
Appendix A Channel maps
Complementing the various molecular moment 0, 1, and 2 maps in the main text (Figs. 2, 3, 8–13), here channel maps of the most prominent unblended spectral features are presented. These are the HCN J = 1 → 0, H13CN J = 1 → 0, HC15N J = 1 → 0, CS J = 2 → 1, c-C3H2 212 → 101 and CH3C2H 50 → 40 transitions in order of decreasing line intensity of the main isotopic species.
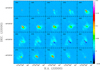 |
Fig. A.1 H12C14N (HCN) J = 1 → 0 channel maps with the crosses indicating (as in case of Figs. A.2–A.6) the position of the radio continuum peak. The spacing between tick marks along the y-axis corresponds to 10″. Central barycentric velocities in km s−1 are given in the upper left corners of each map. The systemic velocity is near 571 km s−1 (Sect. 2). The wedge provides intensities in units of Jy beam−1. We note the dark areas between 525 and 650 km s−1, where the line is seen in absorption. The large-scale rotation of the highly inclined galaxy is such that emission at low velocities is mainly originating from the southwest of the center, while high velocity emission arises from the northeast. The value 0.1 Jy corresponds to ≈4.0 K main beam brightness temperature. The value 1″ represents a projected linear scale of 19 pc. The beam size is shown in the lower right corner of the figure. |
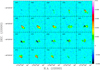 |
Fig. A.2 H13C14N (H13 CN) J = 1 → 0 channel maps. For the units of velocity, ordinate, and wedge as well as for the position of the crosses, see Fig. A.1. As in case of the main isotopic species, absorption is present near the systemic velocities between 525 and 650 km s−1. The value 0.01 Jy corresponds to ≈0.42 K. The beam size is shown in the lower right corner of the figure. |
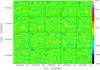 |
Fig. A.3 H12C15N (HC15 N) J = 1 → 0 channel maps. For the units of velocity, ordinate, and wedge as well as the position of the crosses, see Fig. A.1. We note that the signal seen is very close to the noise level. This or a weak transition of SO or CH3 OH may explain the emission at V ≈ 350 km s−1. Near the systemic velocity, where the more abundant HCN isotopologues exhibit weak absorption, no signal is seen, which is likely also a consequence of S/Ns that are too low. The value 0.002 Jy corresponds to ≈ 85 mK. The beam size is shown in the lower right corner of the figure. |
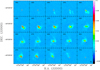 |
Fig. A.4 12C32S (CS) J = 2 → 1 channel maps. For the units of velocity, ordinate, and the wedge as well as for the position of the crosses, see Fig. A.1. The value 0.1 Jy corresponds to ≈3.3 K. The beam size is shown in the lower right corner of the figure. |
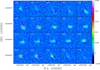 |
Fig. A.5 c-C3H2 212 → 101 channel maps. For the units of velocity, ordinate, and the wedge as well as for the position of the crosses, see Fig. A.1. The value 0.02 Jy corresponds to ≈0.85 K. The beam size is shown in the lower right corner of the figure. The emission seen at an apparent c-C3 H2 velocity of ≈300 km s−1 is caused by the redshifted part of the CH3C2H J = 50 → 40 line, emitting near 710 km s−1 (see also Figs. 6 and A.6). |
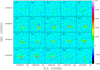 |
Fig. A.6 CH3C2H 50 → 40 channel maps. For the units of velocity, ordinate, and wedge as well as the position of the crosses, see Fig. A.1. The value 0.01 Jy corresponds to ≈0.42 K. The beam size is shown in the lower right corner of the figure. |
References
- Aalto, S., García-Burillo, S., Muller, S., et al. 2015a, A&A, 574, A85 [NASA ADS] [CrossRef] [EDP Sciences] [Google Scholar]
- Aalto, S., Martín, S., Costagliola, F., et al. 2015b, A&A, 584, A42 [NASA ADS] [CrossRef] [EDP Sciences] [Google Scholar]
- Adande, G. R., & Ziurys, L. M. 2012, ApJ, 744, 194 [NASA ADS] [CrossRef] [Google Scholar]
- Aladro, R., Martín, S., Martín-Pintado, J., et al. 2011, A&A, 535, A84 [NASA ADS] [CrossRef] [EDP Sciences] [Google Scholar]
- Aladro, R., Martín, S., Riquelme, D., et al. 2015, A&A, 579, A101 [NASA ADS] [CrossRef] [EDP Sciences] [Google Scholar]
- Askne, J., Höglund, B., Hjalmarson, Å, & Irvine, W. M. 1984, A&A, 130, 311 [NASA ADS] [Google Scholar]
- Barth, A. J. 2003, in Carnegie Obs. Astrophys. Ser. Vol. 1, ed. L. C. Ho (Pasadena, CA: Carnegie Observatories) [Google Scholar]
- Bendo, G. J., Henkel, C., D’Cruze, M. J., et al. 2016, MNRAS, 463, 252 [NASA ADS] [CrossRef] [Google Scholar]
- Bergman, P., Aalto, S., Black, J. H., & Rydbeck, G. 1992, A&A, 265, 403 [NASA ADS] [Google Scholar]
- Bolatto, A. D., Warren, S. R., Leroy, A. K. 2013, Nature, 499, 450 [NASA ADS] [CrossRef] [PubMed] [Google Scholar]
- Canzian, B., Mundy, L. G., & Scoville, N. Z. 1988, ApJ, 333, 157 [NASA ADS] [CrossRef] [Google Scholar]
- Chin, Y.-N., Henkel, C., Langer, N., & Mauersberger, R. 1999, ApJ, 512, L143 [NASA ADS] [CrossRef] [Google Scholar]
- Chou, R. C. Y., Peck, A. B., Lim, J., et al. 2007, ApJ, 670, 116 [NASA ADS] [CrossRef] [Google Scholar]
- Cunningham, M. R., & Whiteoak, J. B. 2005, MNRAS, 364, 37 [NASA ADS] [CrossRef] [Google Scholar]
- Curran, S. J., Johansson, L. E. B., Bergman, P., Heikkilä, A., & Aalto, S. 2001, A&A, 367, 457 [NASA ADS] [CrossRef] [EDP Sciences] [Google Scholar]
- Dahlem, M., Golla, G., Whiteoak, J. B., et al. 1993, A&A, 270, 29 [NASA ADS] [Google Scholar]
- Dahmen, G., Wilson, T.L., & Matteucci, F. 1995, A&A, 295, 194 [NASA ADS] [Google Scholar]
- de Blok, W. J. G., Józsa, G. I. G., Patterson, M., et al. 2014, A&A, 566, A80 [NASA ADS] [CrossRef] [EDP Sciences] [Google Scholar]
- Duarte-Cabral, A., Bontemps, S., Motte, F., et al. 2014, A&A, 570, A1 [NASA ADS] [CrossRef] [EDP Sciences] [Google Scholar]
- Ellingsen, S. P., Chen, X., Breen, S. L., & Qiao, H. H. 2017, MNRAS, 472, 604 [NASA ADS] [CrossRef] [Google Scholar]
- Engelbracht, C. W., Rieke, M. J., Rieke, G. H., Kelly, D. M., & Achtermann, J. M. 1998, ApJ, 505, 639 [NASA ADS] [CrossRef] [Google Scholar]
- Feruglio, C., Maiolino, R., Piconcelli, E., et al. 2010, A&A, 518, L155 [NASA ADS] [CrossRef] [EDP Sciences] [Google Scholar]
- Fomalont, E., van Kempen, T., Kneissl, R., et al. 2014, Messenger, 155, 19 [Google Scholar]
- Furuya, K. 2017, IAU Symp. 332, in press, [arXiv:1711.04406] [Google Scholar]
- Gallimore, J. F., Henkel, C., Baum, S. A., et al. 2001, ApJ, 556, 694 [NASA ADS] [CrossRef] [Google Scholar]
- García-Burillo, S., Martín-Pintado, J., Fuente, A., Usero, A., & Neri, R. 2002, ApJ, 575, L55 [NASA ADS] [CrossRef] [Google Scholar]
- García-Burillo, S., Combes, F., Usero, A., et al. 2014, A&A, 576, A125 [NASA ADS] [CrossRef] [EDP Sciences] [Google Scholar]
- García-Burillo, S., Combes, F., Ramos Almeida, C., et al. 2016, ApJ, 823, L12 [NASA ADS] [CrossRef] [Google Scholar]
- García-Burillo, S., Viti, S., Combes, F., et al. 2017, A&A, 608, A56 [NASA ADS] [CrossRef] [EDP Sciences] [Google Scholar]
- Gentile, G., Józsa, G. I. G., Serra, P., et al. 2013, A&A. 554, A125 [NASA ADS] [CrossRef] [EDP Sciences] [Google Scholar]
- Ginsburg, A., Henkel, C., Ao, Y., et al. 2016, A&A, 586, A50 [NASA ADS] [CrossRef] [EDP Sciences] [Google Scholar]
- Green, C. E., Cunningham, M. R., Green, J. A., et al. 2016, MNRAS, 457, 2470 [NASA ADS] [CrossRef] [Google Scholar]
- Greene, J. E., Seth, A., den Brok, M., et al. 2013, ApJ, 771, 121 [NASA ADS] [CrossRef] [Google Scholar]
- Greenhill, L. J., Gwinn, C. R., Antonucci, R., & Barvainis, R. 1996, ApJ, 472, L21 [NASA ADS] [CrossRef] [Google Scholar]
- Greenhill, L. J., Moran, J. M., & Herrnstein, J. R. 1997, ApJ, 481, L23 [NASA ADS] [CrossRef] [Google Scholar]
- Guillet, V., Jones, A. P., & Pineau Des Forêts G. 2009, A&A, 497, 145 [Google Scholar]
- Gusdorf, A., Cabrit, S., Flower, D. R., & Pineau Des Forêts G. 2008, A&A, 482, 809 [Google Scholar]
- Hagiwara, Y., Horiushi, S., Doi, A., Miyoshi, M., & Edwards, P. G. 2016, ApJ, 827, 69 [NASA ADS] [CrossRef] [Google Scholar]
- Henkel, C., Wouterloot, J. G. A., & Bally, J. 1986, A&A, 155, 193 [NASA ADS] [Google Scholar]
- Henkel, C., Whiteoak, J. B., Nyman, L.-A., & Harju, J. 1990, A&A, 230, L5 [NASA ADS] [Google Scholar]
- Henkel, C., Whiteoak, J.B., & Mauersberger, R. 1994, A&A, 284, 17 [NASA ADS] [Google Scholar]
- Henkel, C., Asiri, H., Ao, Y., et al. 2014, A&A, 565, A3 [NASA ADS] [CrossRef] [EDP Sciences] [Google Scholar]
- Hitschfeld, M., Aravena, M., Kramer, C., et al. 2008, A&A, 479, 75 [NASA ADS] [CrossRef] [EDP Sciences] [Google Scholar]
- Humphreys, E. M. L., Vlemmings, W. H. T., Impellizzeri, C. M. V., et al. 2016, A&A, 592, L13 [NASA ADS] [CrossRef] [EDP Sciences] [Google Scholar]
- Iodice, E., Arnaboldi, M., Rejkuba, M., et al. 2014, A&A, 567, A86 [NASA ADS] [CrossRef] [EDP Sciences] [Google Scholar]
- Izumi, T., Kohno, K., Martín, S., et al. 2013, PASJ, 65, 100 [NASA ADS] [Google Scholar]
- Izumi, T., Kohno, K., Aalto, S., et al. 2016, ApJ, 818, 42 [NASA ADS] [CrossRef] [Google Scholar]
- Józsa, G. I. G. 2016, Astrophysics Source Code Library [record ascl:1208.008] [Google Scholar]
- Józsa, G. I. G., Kenn, F., Klein, U., & Oosterloo, T. A. 2007, A&A, 468, 731 [NASA ADS] [CrossRef] [EDP Sciences] [Google Scholar]
- Kamphuis, P., Rand, R. J., Józsa, G. I. G., et al. 2013, MNRAS, 434, 2069 [NASA ADS] [CrossRef] [Google Scholar]
- Karachentsev, I. D., Tully, R. B., Dolphin, A., et al. 2007, AJ, 133, 504 [NASA ADS] [CrossRef] [Google Scholar]
- Lebrón, M., Mangum, J. G., Mauersberger, R., et al. 2011, A&A, 534, A56 [NASA ADS] [CrossRef] [EDP Sciences] [Google Scholar]
- Lenc, E., & Tingay, S. J. 2009, AJ, 137, 537 [NASA ADS] [CrossRef] [Google Scholar]
- Lin, L.-H., Taam, R. E., Yen, D. C. C., Muller, S., & Lim, J. 2011, ApJ, 731, 15 [NASA ADS] [CrossRef] [Google Scholar]
- Marconi, A., Oliva, E., van der Werf, P. P., et al. 2000, A&A, 357, 24 [NASA ADS] [Google Scholar]
- Marinucci, A., Risaliti, G., Wang, J., et al. 2012, MNRAS, 423, L6 [NASA ADS] [CrossRef] [Google Scholar]
- Martín, S., Mauersberger, R., Martín-Pintado, J., Henkel, C., & García-Burillo, S. 2006, ApJS, 164, 450 [NASA ADS] [CrossRef] [Google Scholar]
- Martín, S., Mart"i"n-Pintado, J., & Viti, S. 2009, ApJ, 706, 1323 [NASA ADS] [CrossRef] [Google Scholar]
- Martín, S., Aalto, S., Sakamoto, K., et al. 2016, A&A, 590, A25 [NASA ADS] [CrossRef] [EDP Sciences] [Google Scholar]
- Matsushita, S., Trung, D.-V., Boone, F., et al. 2015, ApJ, 799, 26 [NASA ADS] [CrossRef] [Google Scholar]
- Mauersberger, R., Henkel, C., Wilson, T. L., & Harju, J. 1989, A&A, 226, L5 [NASA ADS] [Google Scholar]
- Mauersberger, R., Henkel, C., Whiteoak, J. B., Chin, Y.-N., & Tieftrunk, A.R. 1996, A&A, 309, 705 [NASA ADS] [Google Scholar]
- McCarthy, T. P., Ellingsen, S. P., Chen, X., et al. 2017, ApJ, 846, 156 [NASA ADS] [CrossRef] [Google Scholar]
- McMullin, J. P., Waters, B., Schiebel, D., Young, W., & Golap, K. 2007, Astronomical Data Analysis Software and Systems XVI. ASP Conf. Ser., 376, 127 [NASA ADS] [Google Scholar]
- Meier, D. S., Walter, F., Bolatto, A. D., et al. 2015, ApJ, 801, 63 [NASA ADS] [CrossRef] [Google Scholar]
- Meijerink, R., Spaans, M., & Israel, F. P. 2007, A&A, 461, 793 [NASA ADS] [CrossRef] [EDP Sciences] [Google Scholar]
- Monje, R. R., Lord, S., Falgarone, E., et al. 2014, ApJ, 785, 22 [NASA ADS] [CrossRef] [Google Scholar]
- Mould, J., & Sakai, S. 2008, ApJ, 686, L75 [NASA ADS] [CrossRef] [Google Scholar]
- Oliva, E., Origlia, L., Kotilainen, J. K., & Moorwood, A. F. M. 1995, A&A, 301, 55 [NASA ADS] [Google Scholar]
- Ott, M., Whiteoak, J. B., Henkel, C., & Wielebinski, R. 2001, A&A, 372, 463 [NASA ADS] [CrossRef] [EDP Sciences] [Google Scholar]
- Pérez-Beaupuits, J. P., Spoon, H. W. W., Spaans, M., & Smith, J. D. 2011, A&A, 533, A56 [NASA ADS] [CrossRef] [EDP Sciences] [Google Scholar]
- Pesce, D. W., Braatz, J. A., & Impellizzeri, C. M. V. 2016, ApJ, 827, 68 [NASA ADS] [CrossRef] [Google Scholar]
- Pjanka, P., Greene, J. E., Seth, A. C., et al. 2017, ApJ, 844, 165 [NASA ADS] [CrossRef] [Google Scholar]
- Rangwala, N., Maloney, P. R., Glenn, J., et al. 2011, ApJ, 743, 94 [NASA ADS] [CrossRef] [Google Scholar]
- Ritchey, A M., Federman, S. R., & Lambert, D. L. 2015, ApJ, 804, L3 [NASA ADS] [CrossRef] [Google Scholar]
- Rogstad, D. H., Lockhart, I. A., & Wright, M. C. H. 1974, ApJ, 193, 309 [NASA ADS] [CrossRef] [Google Scholar]
- Rosolowski, E., Engargiola, G., Plambeck, R., & Blitz, L. 2003, ApJ, 599, 258 [NASA ADS] [CrossRef] [Google Scholar]
- Roueff, E., Loison, J. C., & Hickson, K. M. 2015, A&A, 576, A99 [NASA ADS] [CrossRef] [EDP Sciences] [Google Scholar]
- Roy, A. L., Osterloo, T., Goss, W. M., & Anantharamaia, K.R. 2010, A&A, 517, A82 [NASA ADS] [CrossRef] [EDP Sciences] [Google Scholar]
- Schmidt, P., Józsa, G. I. G., Gentile, G., et al. 2014, A&A, 561, A28 [NASA ADS] [CrossRef] [EDP Sciences] [Google Scholar]
- Schöier, F. L., van der Tak, F. F. S., van Dishoeck E. F., & Black, J. H 2005, A&A 432, 369 [NASA ADS] [CrossRef] [EDP Sciences] [Google Scholar]
- Scoville, N., Murchikova, L., Walter, F., et al. 2017, ApJ, 836, 66 [NASA ADS] [CrossRef] [Google Scholar]
- Shirley, Y. L. 2015, PASP, 127, 299 [NASA ADS] [CrossRef] [Google Scholar]
- Shirley, Y. L., Evans, N. J., Young, K. E., Knez, C., & Jaffe, D. T 2003, ApJS, 149, 375 [NASA ADS] [CrossRef] [Google Scholar]
- Shlosman, I., Frank, J., & Begelman, M. C. 1989, Nature, 338, 45 [NASA ADS] [CrossRef] [Google Scholar]
- Thaddeus, P., Vrtilek, J. M., & Gottlieb, C. A. 1985, ApJ, 299, L63 [NASA ADS] [CrossRef] [Google Scholar]
- Timmes, F. X., Woosley, S. E., & Weaver, T. A. 1995, ApJS, 98, 617 [NASA ADS] [CrossRef] [Google Scholar]
- Turner, B. E. 1985, ApJ, 299, 312 [NASA ADS] [CrossRef] [Google Scholar]
- Ulvestad, J. S. & Wilson, A. S. 1984, ApJ, 285, 439 [NASA ADS] [CrossRef] [Google Scholar]
- van der Tak, F. F. S., Black, J. H., Schöier, F. L., Jansen, D. J., & van Dishoeck, E. F. 2007, A&A, 468, 627 [NASA ADS] [CrossRef] [EDP Sciences] [Google Scholar]
- Viti, S. García-Burillo, S., Fuente, A., et al. 2014, A&A, 570, A28 [NASA ADS] [CrossRef] [EDP Sciences] [Google Scholar]
- Walter, F., Bolatto, A. D., Leroy, A. K., et al. 2017, ApJ, 835, 265 [NASA ADS] [CrossRef] [Google Scholar]
- Wang, M., Henkel, C., Chin, Y.-N., et al. 2004, A&A, 422, 883 [NASA ADS] [CrossRef] [EDP Sciences] [Google Scholar]
- Wilson, C. D., Rangwala, N., Glenn, J., et al. 2014, ApJ, 789, L36 [NASA ADS] [CrossRef] [Google Scholar]
- Woosley, S. E. & Weaver, T. A. 1995, ApJS, 101, 181 [NASA ADS] [CrossRef] [Google Scholar]
- Yaqoob, T. 2012, MNRAS, 423, 3360 [NASA ADS] [CrossRef] [Google Scholar]
- Zschaechner, L. K., Rand, R. J., Heald, G. H., Gentile, G., & Józsa, G. I. G. 2012, ApJ, 760, 37 [NASA ADS] [CrossRef] [Google Scholar]
All Tables
All Figures
|
Fig. 1 Imageof the λ ≈ 3 mm continuum emission from the central region of NGC 4945 (1″ corresponds to a projected linear scale of ≈19 pc). The mapis based on the line-free sky frequencies of 88.27–88.38 GHz and 88.54–88.70 GHz in the H12 C14N window, 85.60–86.01 GHz and 86.28–86.42 GHz in the H12C15N window, 97.35–97.72 GHz and 98.01–98.24 GHz in the CS window, and 100.15–100.46 GHz in the continuum window (see Sect. 2). The beam size is 2.′′55 × 1.′′ 34 (0.1 Jy beam−1 is equivalent to ≈6.8 K) with a position angle of 44°.2. Contour levels are 0.5, 1, 2, 5, 10, 20, 40, 60, and 80% of the peak flux density of 96 mJy beam−1. The restored beam is shown in the lower left corner. In view of the limited extent of the emission, no primary beam correction has been applied. |
| In the text | |
|
Fig. 2 Distribution of the main spatial HCN J = 1 → 0 features with integrated HCN intensity as background. Assigned numbers are also presented in Col. 2 of Table 2, together with additional information. This includes the offset from position 9, the peak of the λ ≈ 3 mm continuum emission (see Fig. 1), which is responsible for the absorption features seen in most spectral lines. For the three quadratic areas surrounded by white dashed lines, see Sect. 3.2.5. The value 1″ corresponds to a projected linear scale of ≈19 pc. The beam size (2.′′71 × 1.′′ 56, position angle 43°) is given in the lower left. |
| In the text | |
|
Fig. 3 Maps of primary beam corrected velocity integrated intensity (moment 0), obtained with a robustness parameter of 0.0 (Sect. 2). Data reduced with a parameter of +2.0 (close to natural weighting) do not reveal any additional features. The value 1″ corresponds to a projected linear scale of ≈19 pc. Upper left: HCN J = 1 → 0 emission with a restored beam of 2.′′71 × 1.′′ 56 and position angle PA = 43° (see the red spot in the lower left corner of the image). Contour levels are 5, 10, 20, 40, 60, and 80% of the integrated peak flux density of 24.0 Jy km s−1 beam−1. Upper right: H13CN J = 1 → 0 with a restored beam of 2.′′72 × 1.′′ 57, PA = 42°. Center, left: HC15N 1 → 0 (only V > 400 km s−1) with 2.′′ 72 × 1.′′ 57, PA = 42°. Center right: CS J = 2 → 1. Contours are 5, 10, 20, 40, 60, and 80% of the integrated peak flux density of 14.1 Jy km s−1 beam−1. Restored beam: 2.′′57 × 1.′′ 38, PA = 41°. Lower left: C3H2 212 → 101 with 2.′′ 72 × 1.′′ 57, PA = 42°. Lower right: C3HC2H 50 → 40. Restored beam: 2.′′72 × 1.′′ 57, PA = 42°. To convert Jy km s−1 beam−1 into K km s−1 beam−1, multiply by ≈37 (HCN), 39 (H13CN, HC15 N, C3 H2, and CH3C2H), or 36 (CS). |
| In the text | |
|
Fig. 4 Upper panel, black: HCN J = 1 → 0 spectrum with a channel spacing of 3.3 km s−1 from the central 0.25 arcmin2 of NGC 4945. The covered area is limited by αJ2000 = 13h 05m26s and 13h05m29s and by δJ2000 = –49°28′50″ and –49°28′20″. The ordinate displays unweighted average values from pixels of the entire area (moment –1) as a function of barycentric velocity in units of mJy beam−1. For spatiallyintegrated flux densities, multiply by 200 ± 20. Lower panel, black: A CS J = 2 → 1 spectrum with a channel spacing of 3.0 km s1 from the same region is shown. Ordinate and abscissa: same units as for HCN. For spatially integrated flux densities, multiply by 240 ± 24. Applied pixel size for both spectra: 1″ × 1″. Overlayed spectra (red) with lower velocity resolution and larger beam size (≈1′), matched to the amplitude of our spectra, are taken from Wang et al. (2004). |
| In the text | |
|
Fig. 5 Lowerpanel: HCN J =1 → 0 spectra with a channel spacing of 3.3 km s−1. The black line indicates the spectrum from the northeastern region (peak near V = 710 km s−1) showing absorption. The red line indicates the spectrum from the southwestern region (peak near V = 430 km s−1) showing absorption. The separation between the two regions is the line perpendicular to the nuclear disk crossing the peak of the radio continuum emission (see Figs. 2 and A.1). Upper panel: the same is shown for H13 CN J = 1 → 0, but with a channel width of 24 km s−1. The ordinate provides average flux densities per beam over the covered area. The systemic velocity of the galaxy is close to V = 571 km s−1. |
| In the text | |
|
Fig. 6 Spectra from the broad HC15N window with seven contiguous channels smoothed, yielding a channel spacing of ≈23 km s−1. The molecular species related to detected spectral features are given in the two top panels and are described in more detail in Table 1. For H42α, see Bendo et al. (2016). Because almost 2 GHz are covered, leading to a complex correlation between velocity and frequency, amplitudes are presented as a function of observed frequency. Lowest panel: spectrum from the central 0.25 arcmin2, similar to the spectra shown in Fig. 4. Three upper panels: spectra from smaller areas, visualized by dashed white lines in Fig. 2, and include (from top to bottom) regions to the northeast of the center, close to the nucleus, and to the southwest of the center. The four numbers in parenthesis on the right-hand side of each of these designations provide the eastern and western edge (in time seconds of right ascension) and the southern and northern edge (in arcseconds of declination) of the chosen area (compare with the moment 0 maps of Figs. 2 and 3). The ordinate represents unweighted average flux densities per beam size for all pixels in the given areas, such that the values for the largest region (lowest panel), encompassing most areas with weak (or even absent) emission, are smallest. Multiply by 40 ± 4 (upper three panels) and 250 ± 25 to obtain spatially integrated flux densities. The applied pixel size is 1″ × 1″. |
| In the text | |
|
Fig. 7 Angular offsets (along the main axis with position angle 225° toward the southwest) of molecular vs. continuum centroid position (obtained from two-dimensional Gaussian fits) as a function of depth of the spectral dip near the systemic velocity in percent of the line peaks at V ≈ 430 km s−1. The percentages given refer to a covered area of 0.25 arcmin2 as described in Fig. 4. Molecular species are indicated. For details, also including line assignments, formal uncertainties and rest frequencies, see Sect. 4.1.2 and Table 1. |
| In the text | |
|
Fig. 8 Moment 1 velocity field of HCN J = 1 → 0, clipped at the 5σ level. Contours are 440, 520, 600, and 680 km s−1 from lower right to upper left. Primary beam correction and Briggs weighting (robustness parameter +2.0) have been applied. Therestored beam (2.′′52 × 2.′′ 17, PA = 78°) is shown in the lower left corner of the image. The cross indicates the λ ≈ 3 mm radio continuum peak. |
| In the text | |
|
Fig. 9 Moment 1 velocity field of CS J = 2 → 1, clipped at the 5σ level. Contours are 440, 520, 600, and 680 km s−1 from lower right to upper left. Primary beam correction and Briggs weighting (robustness parameter +2.0) have been applied. Therestored beam (2.′′22 × 1.′′ 99, PA = 78°) is shown in the lower left corner of the image. The cross indicates the λ ≈ 3 mm radio continuum peak. |
| In the text | |
|
Fig. 10 Map of the HCN J = 1 → 0 moment 2 velocity dispersion, clipped at the 5σ level. Primary beam correction and Briggs weighting (robustness parameter +2.0) have been applied. The restored beam (2.′′ 52 × 2.′′ 17, PA = 78°) is shown in the lower left corner of the image. The cross indicates the λ ≈ 3 mm radio continuum peak, while the position of the secondary maximum in the south (also seen in Fig. 11) is inconspicuous in all other aspects. |
| In the text | |
|
Fig. 11 Map of the CS J = 2 → 1 moment 2 velocity dispersion, clipped at the 5σ level. Primary beam correction and Briggs weighting (robustness parameter +2.0) have been applied. The restored beam (2.′′ 22 × 1.′′ 99, PA = 79°) is shown in the lower left corner of the image. The cross indicates the λ ≈ 3 mm radio continuum peak, while the secondary peak in the south (also seen in Fig. 10) is inconspicuous in all other aspects. |
| In the text | |
|
Fig. 12 CH3C2H 50 → 40 velocity fieldclipped at the 5σ level. Unlike in Figs. 8 and 9, the emission is confined to the nuclear disk. Primary beam correction and Briggs weighting (robustness parameter +2.0) has been applied. The contours start at 470 km s−1 and reach 695 km s−1; their spacingis 25 km s−1. The restoredbeam (2.′′65 × 2.′′ 28, PA = 80°) is shown in the lower left corner of the image. The cross indicates the λ ≈ 3 mm radio continuum peak. |
| In the text | |
|
Fig. 13 Map of the CH3C2H 50 → 40 velocity dispersion clipped at the 5σ level. Primary beam correction and Briggs weighting (robustness parameter +2.0) has been applied. The restored beam (2.′′ 65 × 2.′′ 28, PA = 80°) is shown in the lower left corner of the image. The cross indicates the λ ≈ 3 mm radio continuum peak. |
| In the text | |
|
Fig. 14 Position-velocity plot of CH3C2H 50 → 40 along the major axis with the abscissa scaled relative to the continuum peak. Contour: 7 mJy beam−1. The plot emphasizes (1) the clumpiness of the gas, (2) the steepening of the rotation curve between barycentric V ≈ 500 km s−1 and the systemic velocity of V ≈ 571 km s−1 and (3) its flattening between 470 and 500 km s−1. |
| In the text | |
|
Fig. 15 Final parametrization: surface brightness. Negative values might reflect statistical errors, but might also be due to absorption. From top to bottom we present c-C3 H2 J = 212 → 110 (SBR), CH3C2H 50 → 40 (SBR-2) and, overlapping, c-C3H2 J = 432 → 423 (SBR-3) andH 42α (SBR-4; see Table 1 for details to the transitions). The abscissa shows galactocentric radii and the ordinate shows emission in units of Jy km s−1 arcsec−2. Further information is given in Sect. 4.6.2. |
| In the text | |
|
Fig. 16 Final parametrization (from top to bottom): rotation velocity, vertical velocity gradient DV RA (see Sect. 4.6.2), inclination, and position angle as a function of galactocentric radius. These are the parameters, which are assumed to be shared by all the lines included in Figs. 15, 17, 18 and 20. |
| In the text | |
|
Fig. 17 Final parametrization: full scale height. From top to bottom: in the same order as in Fig. 15, c-C3 H2 (SCHT), CH3C2H (SCHT-2) and, overlapping, c-C3H2 (SCHT-3) and H 42α (SCHT-4). The ordinate on the left-hand side shows scale height in arcseconds; the ordinate on the right-hand side denotes scale height in pc, both as a function of galactocentric radius. |
| In the text | |
|
Fig. 18 Final parametrization: Intrinsic dispersion (see Sect. 4.6.1) as a function of galactocentric radius (this may be compared with Fig. 13). From top to bottom we show as in Fig. 15 c-C3 H2 (DSP), CH3C2H (DSP-2) and, overlapping, c-C3H2 (DSP-3) andH 42α (DSP-4; see Table 1). |
| In the text | |
|
Fig. 19 Slicepositions of PV-diagrams in Fig. 20 overlaid on a velocity integrated intensity map of the CH3 C2H 50 → 40 line (see, e.g., Table 1 and Fig. 3.) The PV-diagrams in Fig. 20 are all directed from left (east) to right (west). |
| In the text | |
|
Fig. 20 PV-diagrams along the lines shown in Fig. 19, each with (from top to bottom) c-C3 H2 212 → 101, CH3 C2H 50 → 40 and, overlapping, C3H2 432 → 423 and H42α. The velocity scale refers to that of the CH3C2H line (see Sect. 4.6.2 and Table 1). Dark: low intensity; light gray: high intensity. Top left panel: cut A (see also Fig. 19) along the major axis from the northeast toward the southwest. Top right panel: cut B perpendicular to the major axis crossing the 710 km s−1 peak from the southeast toward the northwest. Bottom left panel: cut C perpendicular to the major axis, central line. Bottom right panel: cut D perpendicular to the major axis crossing the 430 km s−1 peak. A, B, C or D are displayed in the upper right corner of their respective panels. Blue contours: original data cube. Red contours: model data cube with constant vertical gradient in radial motion and finalrotation curve (see top two panels of Fig. 16). Contours: 0.1, 0.2, 0.4, 0.8 mJy beam−1. |
| In the text | |
|
Fig. 21 Primary beam corrected HCN J = 1 → 0 emission (Briggs weighting with a robustness parameter of 0.0) integrated over the velocity interval 585–612 km s−1, the near systemic velocity range, where nuclear absorption is not as strong as at adjacent velocities. The arms (mainly green, see Sect. 4.7) are visible in the northwest and southeast, likely connected by the elongated region of strong emission along an east-west axis. See Fig. 22 for an even clearer image, where absorption plays a lesser role. |
| In the text | |
|
Fig. 22 Primary beam corrected CS J = 2 → 1 emission (Briggs weighting with a robustness parameter of 0.0) integrated over the velocity interval 585–612 km s−1, the near systemic velocity range, where nuclear absorption is not as strong as at adjacent velocities. Contours are 0.025, 0.05, 0.1, 0.2, 0.4, 0.6, and 0.8 times the integrated peak flux density of 2.48 Jy km s−1 beam−1. Overall, line absorption plays a lesser role than in Fig. 21. While the southern region of enhanced emission is part of the southeastern arm, the hotspot around 7″ farther to the east is (as in Fig. 21) a separate feature, possibly related to Knot B of Marconi et al. (2000; see our Sect. 4.1.3). |
| In the text | |
|
Fig. 23 Sketch of the central parts of NGC 4945 viewed from a position above the plane and on top of the center of the galaxy. The blue arrows indicate modeled or observationally suggested radial motions of the gas. |
| In the text | |
|
Fig. A.1 H12C14N (HCN) J = 1 → 0 channel maps with the crosses indicating (as in case of Figs. A.2–A.6) the position of the radio continuum peak. The spacing between tick marks along the y-axis corresponds to 10″. Central barycentric velocities in km s−1 are given in the upper left corners of each map. The systemic velocity is near 571 km s−1 (Sect. 2). The wedge provides intensities in units of Jy beam−1. We note the dark areas between 525 and 650 km s−1, where the line is seen in absorption. The large-scale rotation of the highly inclined galaxy is such that emission at low velocities is mainly originating from the southwest of the center, while high velocity emission arises from the northeast. The value 0.1 Jy corresponds to ≈4.0 K main beam brightness temperature. The value 1″ represents a projected linear scale of 19 pc. The beam size is shown in the lower right corner of the figure. |
| In the text | |
|
Fig. A.2 H13C14N (H13 CN) J = 1 → 0 channel maps. For the units of velocity, ordinate, and wedge as well as for the position of the crosses, see Fig. A.1. As in case of the main isotopic species, absorption is present near the systemic velocities between 525 and 650 km s−1. The value 0.01 Jy corresponds to ≈0.42 K. The beam size is shown in the lower right corner of the figure. |
| In the text | |
|
Fig. A.3 H12C15N (HC15 N) J = 1 → 0 channel maps. For the units of velocity, ordinate, and wedge as well as the position of the crosses, see Fig. A.1. We note that the signal seen is very close to the noise level. This or a weak transition of SO or CH3 OH may explain the emission at V ≈ 350 km s−1. Near the systemic velocity, where the more abundant HCN isotopologues exhibit weak absorption, no signal is seen, which is likely also a consequence of S/Ns that are too low. The value 0.002 Jy corresponds to ≈ 85 mK. The beam size is shown in the lower right corner of the figure. |
| In the text | |
|
Fig. A.4 12C32S (CS) J = 2 → 1 channel maps. For the units of velocity, ordinate, and the wedge as well as for the position of the crosses, see Fig. A.1. The value 0.1 Jy corresponds to ≈3.3 K. The beam size is shown in the lower right corner of the figure. |
| In the text | |
|
Fig. A.5 c-C3H2 212 → 101 channel maps. For the units of velocity, ordinate, and the wedge as well as for the position of the crosses, see Fig. A.1. The value 0.02 Jy corresponds to ≈0.85 K. The beam size is shown in the lower right corner of the figure. The emission seen at an apparent c-C3 H2 velocity of ≈300 km s−1 is caused by the redshifted part of the CH3C2H J = 50 → 40 line, emitting near 710 km s−1 (see also Figs. 6 and A.6). |
| In the text | |
|
Fig. A.6 CH3C2H 50 → 40 channel maps. For the units of velocity, ordinate, and wedge as well as the position of the crosses, see Fig. A.1. The value 0.01 Jy corresponds to ≈0.42 K. The beam size is shown in the lower right corner of the figure. |
| In the text | |
Current usage metrics show cumulative count of Article Views (full-text article views including HTML views, PDF and ePub downloads, according to the available data) and Abstracts Views on Vision4Press platform.
Data correspond to usage on the plateform after 2015. The current usage metrics is available 48-96 hours after online publication and is updated daily on week days.
Initial download of the metrics may take a while.