Fig. 20
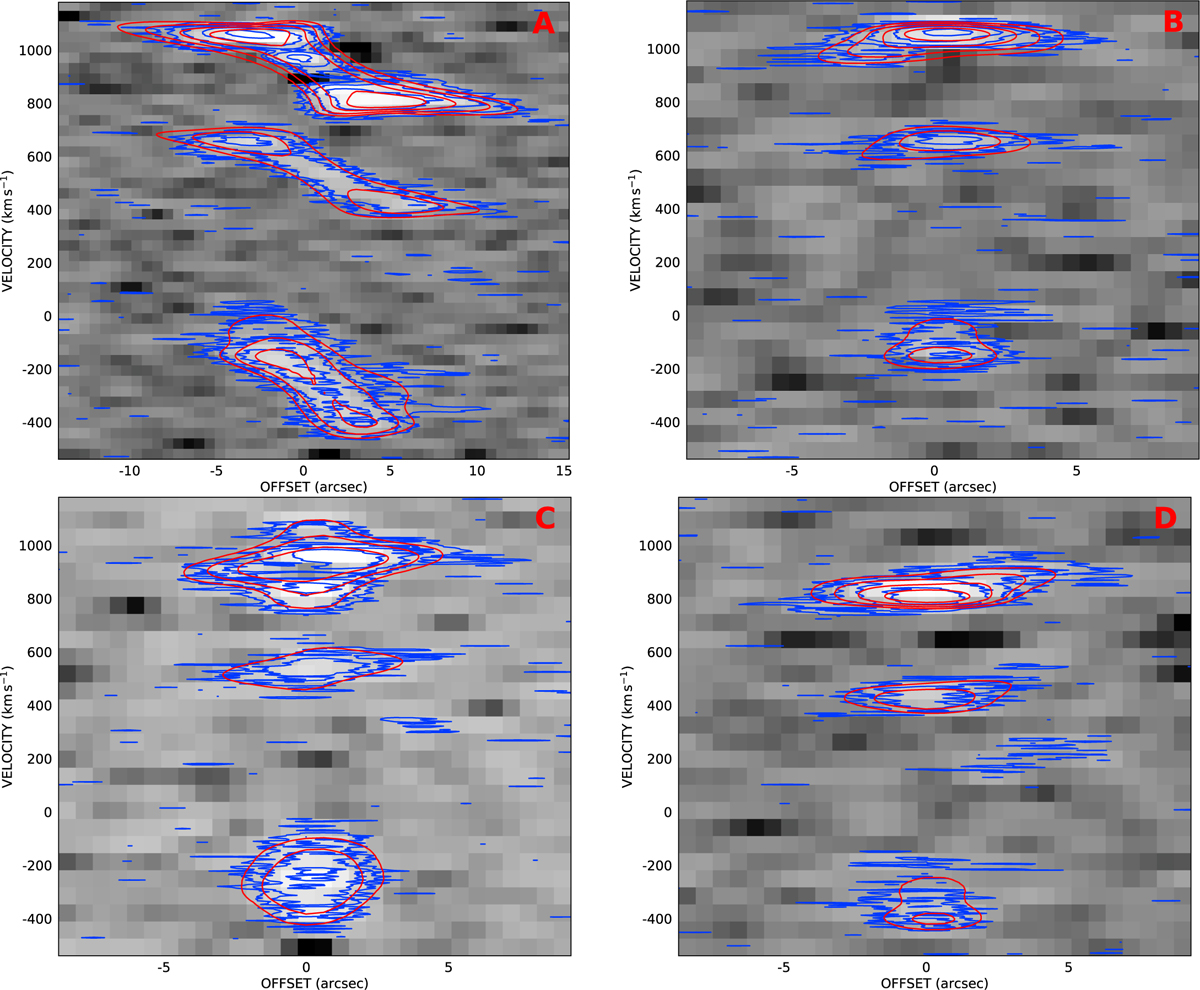
PV-diagrams along the lines shown in Fig. 19, each with (from top to bottom) c-C3 H2 212 → 101, CH3 C2H 50 → 40 and, overlapping, C3H2 432 → 423 and H42α. The velocity scale refers to that of the CH3C2H line (see Sect. 4.6.2 and Table 1). Dark: low intensity; light gray: high intensity. Top left panel: cut A (see also Fig. 19) along the major axis from the northeast toward the southwest. Top right panel: cut B perpendicular to the major axis crossing the 710 km s−1 peak from the southeast toward the northwest. Bottom left panel: cut C perpendicular to the major axis, central line. Bottom right panel: cut D perpendicular to the major axis crossing the 430 km s−1 peak. A, B, C or D are displayed in the upper right corner of their respective panels. Blue contours: original data cube. Red contours: model data cube with constant vertical gradient in radial motion and finalrotation curve (see top two panels of Fig. 16). Contours: 0.1, 0.2, 0.4, 0.8 mJy beam−1.
Current usage metrics show cumulative count of Article Views (full-text article views including HTML views, PDF and ePub downloads, according to the available data) and Abstracts Views on Vision4Press platform.
Data correspond to usage on the plateform after 2015. The current usage metrics is available 48-96 hours after online publication and is updated daily on week days.
Initial download of the metrics may take a while.