Fig. 7
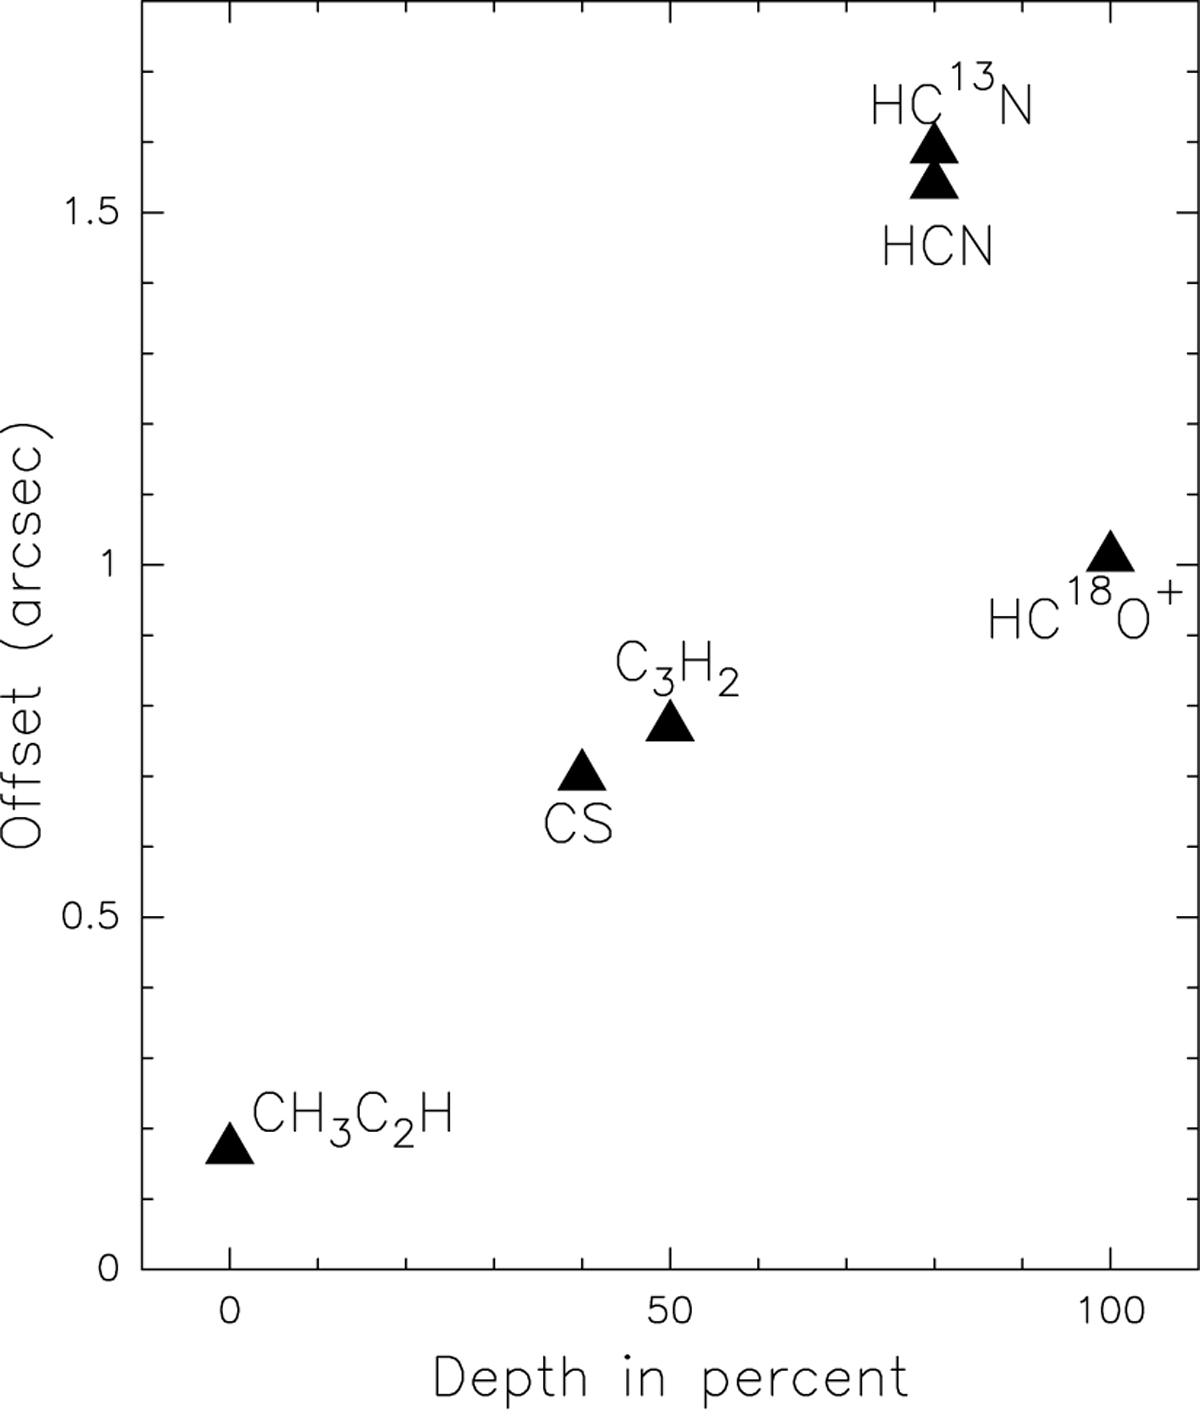
Angular offsets (along the main axis with position angle 225° toward the southwest) of molecular vs. continuum centroid position (obtained from two-dimensional Gaussian fits) as a function of depth of the spectral dip near the systemic velocity in percent of the line peaks at V ≈ 430 km s−1. The percentages given refer to a covered area of 0.25 arcmin2 as described in Fig. 4. Molecular species are indicated. For details, also including line assignments, formal uncertainties and rest frequencies, see Sect. 4.1.2 and Table 1.
Current usage metrics show cumulative count of Article Views (full-text article views including HTML views, PDF and ePub downloads, according to the available data) and Abstracts Views on Vision4Press platform.
Data correspond to usage on the plateform after 2015. The current usage metrics is available 48-96 hours after online publication and is updated daily on week days.
Initial download of the metrics may take a while.