Fig. 3
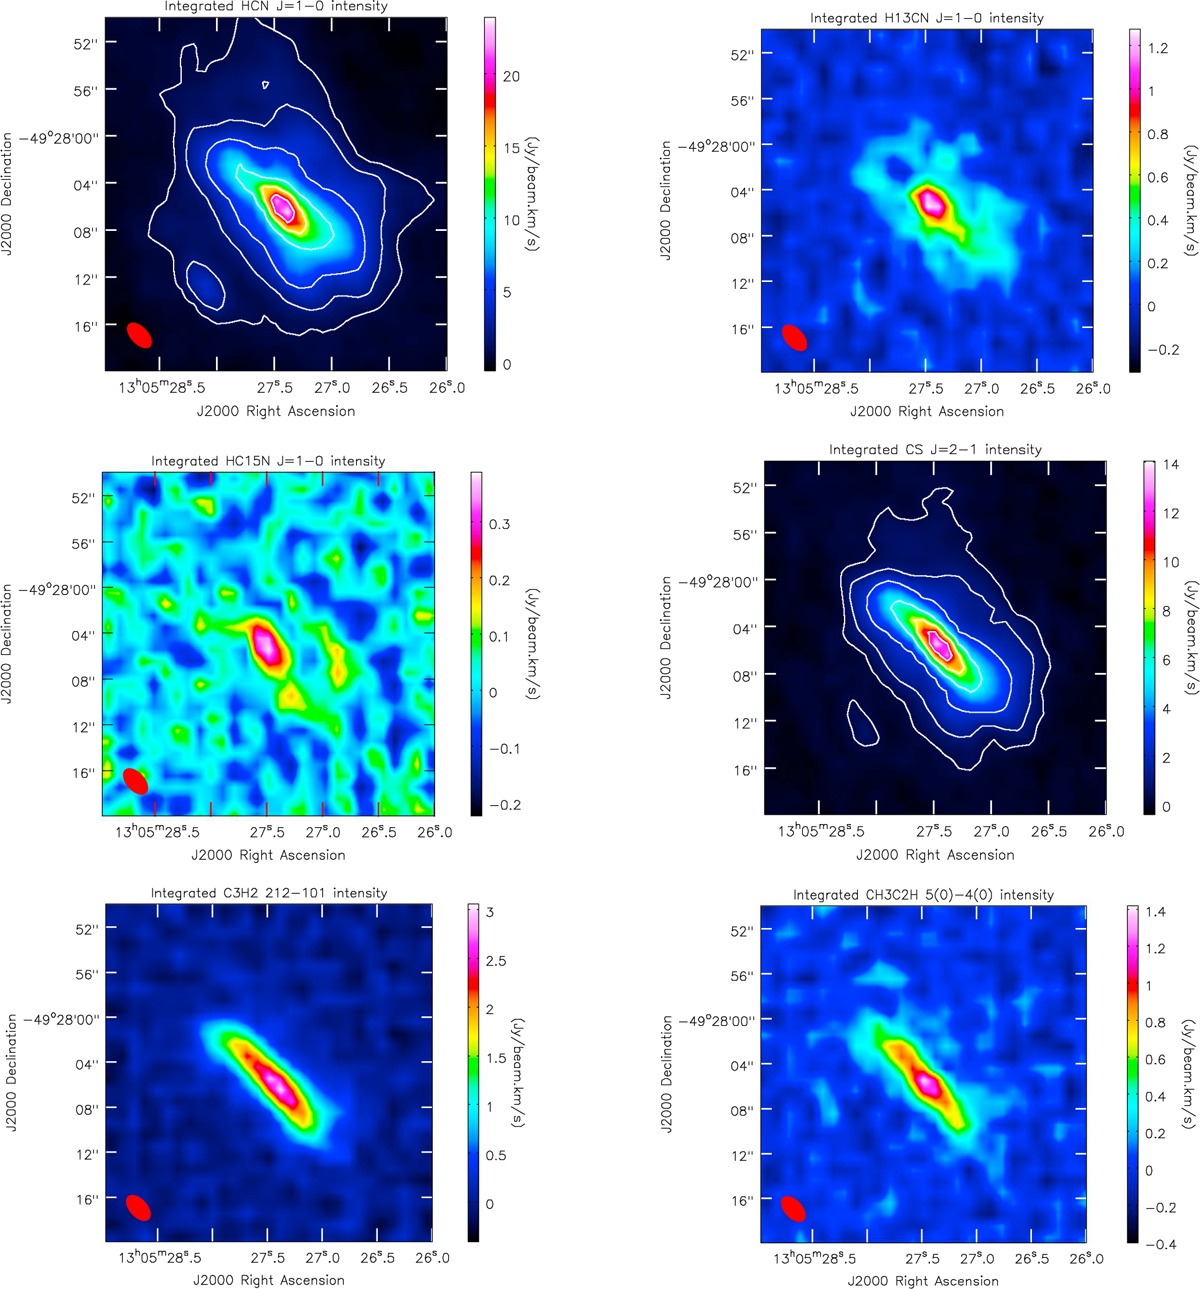
Maps of primary beam corrected velocity integrated intensity (moment 0), obtained with a robustness parameter of 0.0 (Sect. 2). Data reduced with a parameter of +2.0 (close to natural weighting) do not reveal any additional features. The value 1″ corresponds to a projected linear scale of ≈19 pc. Upper left: HCN J = 1 → 0 emission with a restored beam of 2.′′71 × 1.′′ 56 and position angle PA = 43° (see the red spot in the lower left corner of the image). Contour levels are 5, 10, 20, 40, 60, and 80% of the integrated peak flux density of 24.0 Jy km s−1 beam−1. Upper right: H13CN J = 1 → 0 with a restored beam of 2.′′72 × 1.′′ 57, PA = 42°. Center, left: HC15N 1 → 0 (only V > 400 km s−1) with 2.′′ 72 × 1.′′ 57, PA = 42°. Center right: CS J = 2 → 1. Contours are 5, 10, 20, 40, 60, and 80% of the integrated peak flux density of 14.1 Jy km s−1 beam−1. Restored beam: 2.′′57 × 1.′′ 38, PA = 41°. Lower left: C3H2 212 → 101 with 2.′′ 72 × 1.′′ 57, PA = 42°. Lower right: C3HC2H 50 → 40. Restored beam: 2.′′72 × 1.′′ 57, PA = 42°. To convert Jy km s−1 beam−1 into K km s−1 beam−1, multiply by ≈37 (HCN), 39 (H13CN, HC15 N, C3 H2, and CH3C2H), or 36 (CS).
Current usage metrics show cumulative count of Article Views (full-text article views including HTML views, PDF and ePub downloads, according to the available data) and Abstracts Views on Vision4Press platform.
Data correspond to usage on the plateform after 2015. The current usage metrics is available 48-96 hours after online publication and is updated daily on week days.
Initial download of the metrics may take a while.