Fig. 2
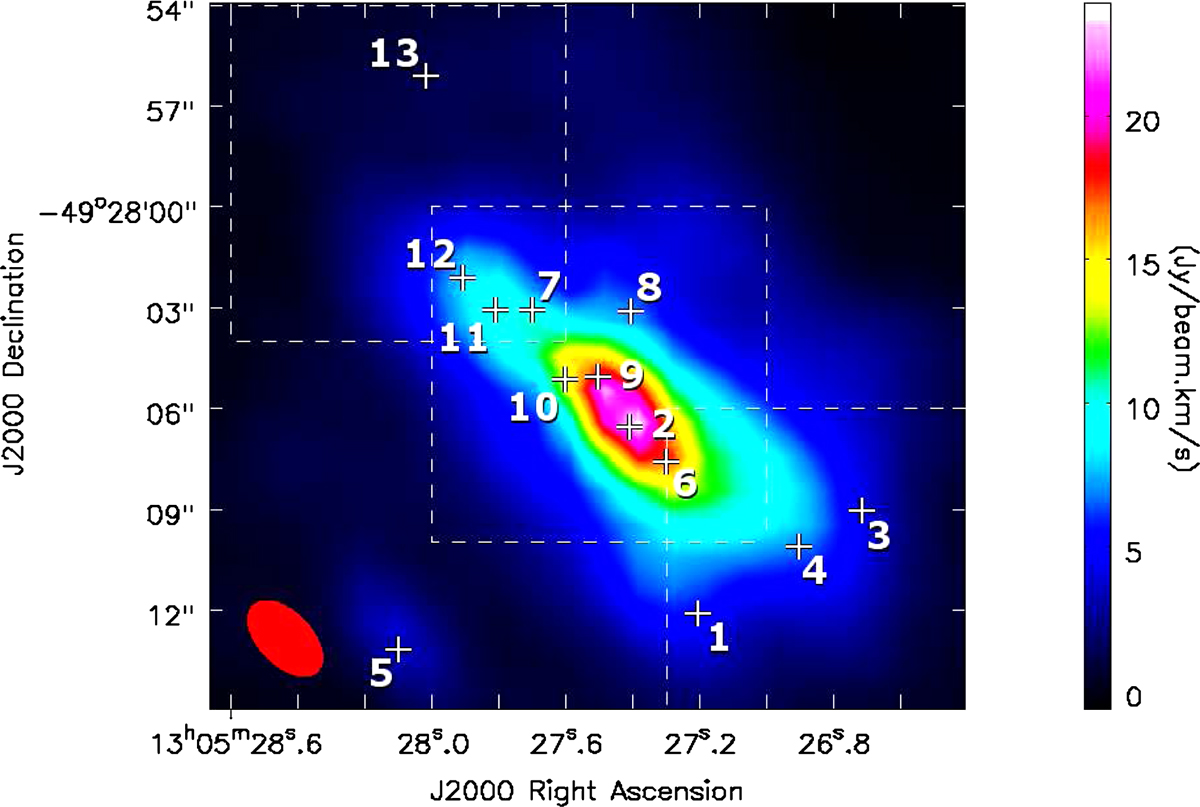
Distribution of the main spatial HCN J = 1 → 0 features with integrated HCN intensity as background. Assigned numbers are also presented in Col. 2 of Table 2, together with additional information. This includes the offset from position 9, the peak of the λ ≈ 3 mm continuum emission (see Fig. 1), which is responsible for the absorption features seen in most spectral lines. For the three quadratic areas surrounded by white dashed lines, see Sect. 3.2.5. The value 1″ corresponds to a projected linear scale of ≈19 pc. The beam size (2.′′71 × 1.′′ 56, position angle 43°) is given in the lower left.
Current usage metrics show cumulative count of Article Views (full-text article views including HTML views, PDF and ePub downloads, according to the available data) and Abstracts Views on Vision4Press platform.
Data correspond to usage on the plateform after 2015. The current usage metrics is available 48-96 hours after online publication and is updated daily on week days.
Initial download of the metrics may take a while.