Fig. 6
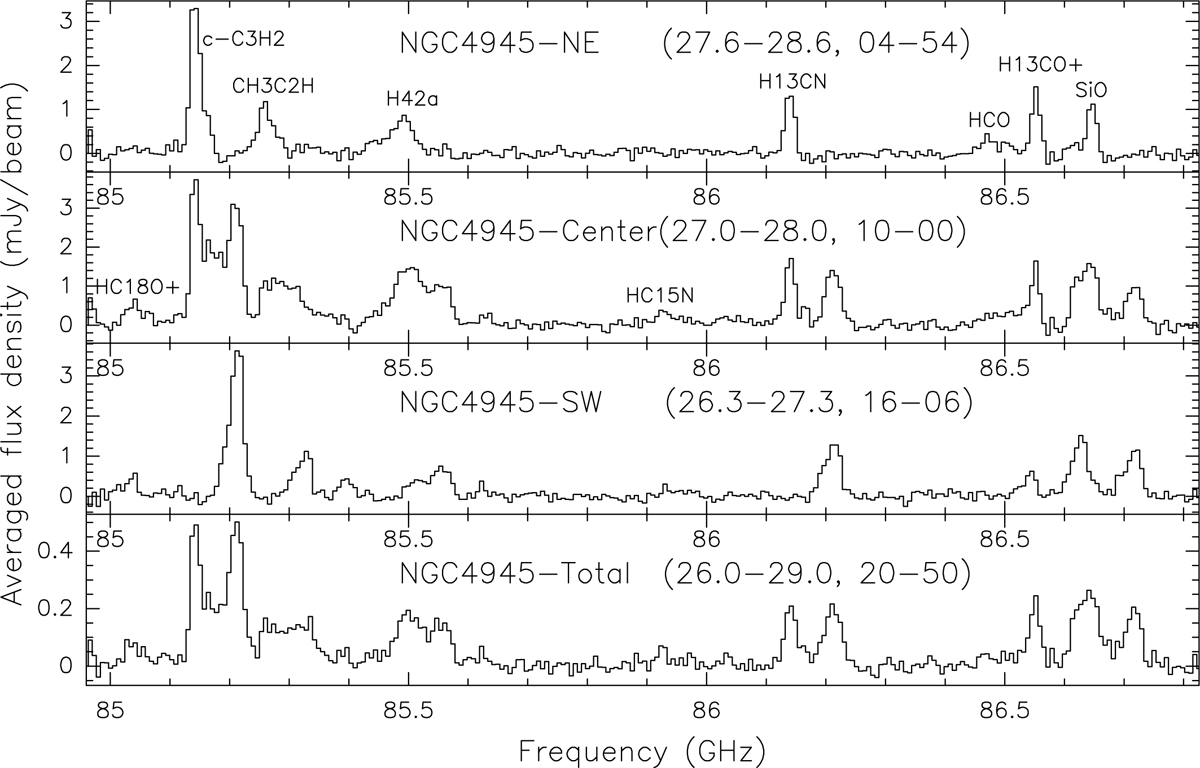
Spectra from the broad HC15N window with seven contiguous channels smoothed, yielding a channel spacing of ≈23 km s−1. The molecular species related to detected spectral features are given in the two top panels and are described in more detail in Table 1. For H42α, see Bendo et al. (2016). Because almost 2 GHz are covered, leading to a complex correlation between velocity and frequency, amplitudes are presented as a function of observed frequency. Lowest panel: spectrum from the central 0.25 arcmin2, similar to the spectra shown in Fig. 4. Three upper panels: spectra from smaller areas, visualized by dashed white lines in Fig. 2, and include (from top to bottom) regions to the northeast of the center, close to the nucleus, and to the southwest of the center. The four numbers in parenthesis on the right-hand side of each of these designations provide the eastern and western edge (in time seconds of right ascension) and the southern and northern edge (in arcseconds of declination) of the chosen area (compare with the moment 0 maps of Figs. 2 and 3). The ordinate represents unweighted average flux densities per beam size for all pixels in the given areas, such that the values for the largest region (lowest panel), encompassing most areas with weak (or even absent) emission, are smallest. Multiply by 40 ± 4 (upper three panels) and 250 ± 25 to obtain spatially integrated flux densities. The applied pixel size is 1″ × 1″.
Current usage metrics show cumulative count of Article Views (full-text article views including HTML views, PDF and ePub downloads, according to the available data) and Abstracts Views on Vision4Press platform.
Data correspond to usage on the plateform after 2015. The current usage metrics is available 48-96 hours after online publication and is updated daily on week days.
Initial download of the metrics may take a while.