| Issue |
A&A
Volume 608, December 2017
|
|
|---|---|---|
| Article Number | A134 | |
| Number of page(s) | 18 | |
| Section | Interstellar and circumstellar matter | |
| DOI | https://doi.org/10.1051/0004-6361/201730894 | |
| Published online | 14 December 2017 | |
1000 au exterior arcs connected to the protoplanetary disk around HL Tauri
1 European Southern Observatory (ESO), Karl-Schwarzschild-Str. 2, 85748 Garching, Germany
e-mail: hyen@eso.org
2 Department of Physics and Astronomy, Graduate School of Science and Engineering, Kagoshima University, 1-21-35 Korimoto, Kagoshima, 890-0065 Kagoshima, Japan
3 Academia Sinica Institute of Astronomy and Astrophysics, PO Box 23-141, 10617 Taipei, Taiwan
4 East Asian Observatory, 660 N. A’ohoku Place, University Park, Hilo, HI 96720, USA
5 Institute of Physics and CASA*, Faculty of Mathematics and Physics, University of Szczecin, Wielkopolska 15, 70-451 Szczecin, Poland
6 Faculty of Sustainability Studies, Hosei University, Chiyoda-ku, 102-8160 Tokyo, Japan
7 Division of Liberal Arts, Kogakuin University, 1-24-2 Nishi-Shinjuku, Shinjuku-ku, 163-8677 Tokyo, Japan
8 ALMA Project Office, National Astronomical Observatory of Japan, Osawa 2-21-1, Mitaka, 181-8588 Tokyo, Japan
9 Department of Physics, National Taiwan University, 10617 Taipei, Taiwan
Received: 30 March 2017
Accepted: 4 August 2017
Aims. The protoplanetary disk around HL Tau is the youngest candidate of planet formation known to date, and it is still embedded in a protostellar envelope with a size of thousands of au. In this work, we study the gas kinematics in the envelope and its possible influence on the embedded disk.
Methods. We present our new ALMA cycle 3 observational results of HL Tau in the 13CO (2–1) and C18O (2–1) emission at resolutions of 0.̋8 (110 au), and we compare the observed velocity pattern with models of different types of gas motion.
Results. The 13CO and C18O emission lines both show a central compact component with a size of 2″ (280 au) that traces the protoplanetary disk. The disk is clearly resolved and shows Keplerian motion, based on which, the protostellar mass of HL Tau is estimated to be 1.8 ± 0.3 M⊙, assuming the inclination angle of the disk to be 47° from the plane of the sky. The 13CO emission shows two arc structures with sizes of 1000–2000 au and masses of 3 × 10⁻³M⊙ connected to the central disk. One is blueshifted and stretches from the northeast to the northwest, and the other is redshifted and stretches from the southwest to the southeast. We find that simple kinematical models of infalling and (counter-)rotating flattened envelopes cannot fully explain the observed velocity patterns in the arc structures. The gas kinematics of the arc structures can be better explained with three-dimensional infalling or outflowing motions. Nevertheless, the observed velocity in the northwestern part of the blueshifted arc structure is ~60–70% higher than the expected free-fall velocity. We discuss two possible origins of the arc structures: (1) infalling flows externally compressed by an expanding shell driven by XZ Tau; and (2) outflowing gas clumps caused by gravitational instabilities in the protoplanetary disk around HL Tau.
Key words: protoplanetary disks / stars: formation / ISM: kinematics and dynamics
© ESO, 2017
1. Introduction
Observations in (sub-)millimeter continuum at spatial resolutions of a few au and high-contrast imaging in the infrared have revealed rings and gaps with widths of a few au to tens of au in several protoplanetary disks (Akiyama et al. 2015; Momose et al. 2015; Rapson et al. 2015; Isella et al. 2016; Andrews et al. 2016; Ginski et al. 2016; Konishi et al. 2016; Perrot et al. 2016; van der Plas et al. 2017). The presence of these gaps suggests decreases in surface density or changes in dust properties at the location of these gaps (Takahashi & Inutsuka 2014; Dipierro et al. 2015; Dong et al. 2015, 2016; Kanagawa et al. 2015, 2016; Tamayo et al. 2015; Zhang et al. 2015, 2016; Jin et al. 2016; Okuzumi et al. 2016; Dong & Fung 2017). Hints of decreases in gas density coincident with the dust continuum gaps have also been observed in protoplanetary disks (Yen et al. 2016; Isella et al. 2016); this is suggestive of actual deficits in material at these gaps. Theoretical studies show that embedded gas giant planets can carve such gaps in protoplanetary disks (e.g., Dong et al. 2015, 2016; Kanagawa et al. 2015, 2016; Dong & Fung 2017). Thus, these protoplanetary disks with rings and gaps are considered candidates of ongoing planet formation.
The protostar HL Tau (J2000 04h31m38.s43 +18d13m57.s2; ALMA Partnership et al. 2015) has a Class I–II spectral energy distribution (Men’shchikov et al. 1999) and is located in the Taurus star-forming region at a distance of 140 pc (Kenyon et al. 1994; Loinard 2013). A series of rings and gaps were observed in its protoplanetary disk in the (sub-)millimeter continuum emission with the Atacama Large Millimeter/Submillimeter Array (ALMA), making HL Tau the youngest candidate of planet formation known to date (ALMA Partnership et al. 2015; Akiyama et al. 2016). Direct imaging in the L′ band with the Large Binocular Telescope Interferometer did not find any point sources in the protoplanetary disk around HL Tau and placed an upper limit on the mass of possible planets of 10–15 Mjup (Testi et al. 2015). The protoplanetary disk around HL Tau has an inclination angle of 47° from the plane of the sky and a position angle (PA) of 138° (ALMA Partnership et al. 2015), and it is embedded in an elongated molecular cloud with a length of ~0.05 pc (Welch et al. 2000). Observations in the 13CO (1–0) emission at an angular resolution of 5″ with the Nobeyama Millimeter Array show a flattened envelope with signs of infalling and rotational motions on a scale of 2000 au around HL Tau (Hayashi et al. 1993). Later observations in the 13CO (1–0) emission with the Plateau de Bure interferometer (PdBI) and a combination of the BIMA and the NRAO 12 m telescope at an angular resolution of 3″–8″ reveal complex velocity structures on a scale of hundreds to thousands of au (Cabrit et al. 1996; Welch et al. 2000). Thus, the gas motions in the envelope around HL Tau are still not clear. HL Tau is also associated with a bipolar molecular outflow (Monin et al. 1996; Lumbreras & Zapata 2014; ALMA Partnership et al. 2015; Klaassen et al. 2016) and optical and infrared jets (Takami et al. 2007; Hayashi & Pyo 2009; Anglada et al. 2007; Movsessian et al. 2012). The jets associated with HL Tau are moving at tangential velocities of 60–160 km s-1 with an inclination angle of 40°–60° and a PA of 35°–47°, measured from the proper motion of the jets (Anglada et al. 2007; Movsessian et al. 2012). The jet axis is perpendicular to the protoplanetary disk. Therefore, different from other candidates of planet formation, HL Tau is still surrounded by an protostellar envelope and is likely in the active mass accretion phase.
Dynamical infall from protostellar envelopes onto protoplanetary disks can produce accretion shocks in the disks (e.g., Yorke & Bodenheimer 1999). This can change the chemical status of protoplanetary disks and possibly affect the subsequent chemical evolution of disks (e.g., Visser et al. 2009, 2011). Signs of accretion shocks have been observed in disks around Class 0 and I protostars, such as L1489 IRS (Yen et al. 2014), L1527 (Ohashi et al. 2014; Sakai et al. 2014a,b), and TMC-1A (Sakai et al. 2016). Changes in chemical compositions have also been observed in the transitional region between the infalling envelope and the central disk in L1527 (Sakai et al. 2014a,b) and IRAS 16293−2422 (Oya et al. 2016). In addition, as a protoplanetary disk continues to accrete mass from its surrounding envelope, it can become massive and gravitationally unstable (e.g., Machida et al. 2010; Vorobyov 2010). The gravitational instability can cause fragmentation and form gas clumps in disks, which can be the progenitors of planets (e.g., Vorobyov 2011; Zhu et al. 2012), and it can also trigger mass ejection from disks (e.g., Vorobyov 2016). These influences of protostellar envelopes on embedded protoplanetary disks are not well understood observationally.
These gaps and rings in the protoplanetary disk around HL Tau suggest that planet formation may occur when protoplanetary disks are still embedded in protostellar envelopes. To observationally investigate possible influences of protostellar envelopes on planet-forming disks, we have conducted ALMA observations in 13CO (2–1; 220.398684 GHz) and C18O (2–1; 219.560358 GHz) at an angular resolution of 0.̋8 (110 au) toward the candidate disk of planet formation around HL Tau. Our ALMA observations allow us to resolve the Keplerian rotation of the embedded protoplanetary disk and distinguish the gas motions in the surrounding envelope, and thus to study their relation. This paper is organized as follows: Sect. 2 describes the details of the observations. Section 3 presents the observational results in the 13CO and C18O emission. Section 4 presents our analysis on the disk rotation traced by the 13CO and C18O emission and on the kinematics of the surrounding structures connected to the disk observed in the 13CO emission. Section 5 discusses the origins of the observed structures and kinematics in the 13CO emission.
2. Observations
ALMA cycle-3 observations toward HL Tau were conducted on 22 March, 2016 with 40 antennas. HL Tau was observed with a hexagonal seven-pointing mosaic with Nyquist sampling, and the total integration time on HL Tau is 30 min. J0510+1800 with a flux of 2.38 Jy at 225.7 GHz was observed as bandpass and flux calibrator, and J0431+2037 with a flux of 65 mJy at 225.6 GHz as phase calibrator. The baseline length ranges from 14 m to 384 m, so the maximum recoverable scale of our observations is 12″ (1700 au). The typical absolute flux uncertainty of ALMA observations at 1 mm wavelength is 10%. The spectral setup of our ALMA observations contained five spectral windows. Two spectral windows, each with a bandwidth of 2 GHz, were assigned to the 1.3 mm continuum. One spectral window with a bandwidth of 468.8 MHz and a channel width of 122 kHz was set to the 13CO (2–1) line, one with a bandwidth of 234.4 MHz and a channel width of 244 kHz to the C18O (2–1) line, and one with a bandwidth of 234.4 MHz and a channel width of 488 kHz to the SO (56–45) line. The raw visibility data were calibrated using the standard reduction script for the cycle-3 data, which uses tasks in the Common Astronomy Software Applications (CASA; McMullin et al. 2007) of version 4.6, and without self-calibration. We additionally flagged the data in the spectral window of the 13CO line in field 4 at a time from 21:40:14 to 21:40:16 manually, because artificial stripes appear in images that are produced with uniform weighting. The image cubes of the 13CO (2–1) and C18O (2–1) lines were generated with uniform weighting and cleaned with the CASA task “clean” at a velocity resolution of 0.34 km s-1. The angular resolution and the noise level are 0.̋77 × 0.̋75 and 7 mJy Beam-1 per channel in the 13CO image, and 0.̋77 × 0.̋74 and 6.7 mJy Beam-1 per channel in the C18O image.
3. Results
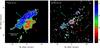 |
Fig. 1 Moment 0 maps (contours) overlaid on moment 1 maps (color; in units of km s-1 in the LSR frame) of the 13CO (2–1; left) and C18O (2–1; right) emission in HL Tau obtained with our ALMA observations. Crosses denote the position of HL Tau. Blue and red arrows show the directions of the blue- and redshifted outflows. Blue filled ellipses present the sizes of the synthesized beams. In the 13CO map, contour levels are 5%, 10%, 15%, 30%, 50%, and 80% of the peak intensity, where the 5% level corresponds to 4.5σ (1σ = 13.7 mJy Beam-1 km s-1). The contour levels in the C18O map are 5%, 15%, 30%, 60%, and 90% of the peak intensity, where the 5% level corresponds to 2σ (1σ = 11.6 mJy Beam-1 km s-1). |
Figure 1 presents the total integrated-intensity (moment 0) maps overlaid on the intensity-weighted mean velocity (moment 1) maps of the 13CO (2–1) and C18O (2–1) emission. The C18O emission primarily traces a compact component with an apparent size of ~2″ (280 au) around HL Tau, and it is oriented in the northwest–southeast direction with a PA of ~125°. This orientation is consistent with that of the protoplanetary disk around HL Tau observed with ALMA at an angular resolution of 0.̋03 within 15° (ALMA Partnership et al. 2015; Akiyama et al. 2015). The C18O central component exhibits a velocity gradient along its major axis, where the northwestern part is redshifted and the southeastern part is blueshifted. The direction of this velocity gradient is the same as the Keplerian rotation of the protoplanetary disk around HL Tau observed with ALMA in the HCO+ (1–0) and CO (1–0) emission at angular resolutions of 0.̋2–0.̋3 (Pinte et al. 2016). The 13CO emission also shows a similar central compact component, which is orientated and exhibits a velocity gradient in the northwest–southeast direction. In the 13CO emission, there are additional extended structures with sizes of ~1000–3000 au linking the central component. The extended structures stretch toward the northwest and the southeast, and their elongations are perpendicular to the directions of the molecular outflows and the optical and infrared jets (Monin et al. 1996; Anglada et al. 2007; Takami et al. 2007; Movsessian et al. 2007, 2012; Hayashi & Pyo 2009; Lumbreras & Zapata 2014; ALMA Partnership et al. 2015; Klaassen et al. 2016). A part of the extended structures is also detected in the C18O emission, which appears as clumpy components located northwest, southeast, and south of the central component. The extended structures exhibit an overall velocity gradient in the same direction as the molecular outflows associated with HL Tau (Monin et al. 1996; Lumbreras & Zapata 2014; ALMA Partnership et al. 2015; Klaassen et al. 2016). This velocity gradient on a 1000 au scale is also observed in the 13CO (1–0) emission at lower resolutions of 3″–8″ (Sargent & Beckwith 1987, 1991; Hayashi et al. 1993; Cabrit et al. 1996; Welch et al. 2000).
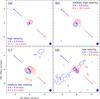 |
Fig. 2 Moment 0 maps of the C18O emission integrated over four different velocity ranges, high velocities (VLSR = 2.9–3.8 and 10.3–11.4 km s-1), medium-high velocities (VLSR = 3.8–4.8 and 9.2–10.3 km s-1), medium-low velocities (VLSR = 4.8–5.8 and 8.2–9.2 km s-1), and low velocities (VLSR = 5.8–7.1 and 7.1–8.2 km s-1). Blue and red contours present the blue- and redshifted emission, respectively. Blue and red arrows show the directions of the blue- and redshifted outflows. Crosses denote the position of HL Tau. Filled blue ellipses show the size of the synthesized beam. Contour levels are 5σ, 10σ, and 15σ in the high-velocity blueshifted map, are 5σ, 15σ, 30σ, 50σ, and 70σ in the high-velocity redshifted map, are 5σ, 15σ, 30σ, and 45σ in the medium-high-velocity maps, are 5σ, 10σ, 15σ, 25σ, 45σ, and 75σ in the medium-low-velocity maps, and are 5σ, 10σ, 15σ, 25σ, 45σ, and 75σ in the low-velocity maps. The noise level in the high-velocity redshifted map is 5.1 mJy Beam-1 km s-1, and the levels in the other maps are all 3.9 mJy Beam-1 km s-1. |
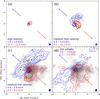 |
Fig. 3 Same as Fig. 2, but for the 13CO emission, and the high-velocity range for the 13CO emission is VLSR = 1.9–3.8 and 10.3–12.8 km s-1. Black and green dots delineate the ridges of the contour lines, showing the arc structures. The ridges of the contour lines were measured from the peak positions of the intensity profiles along the transverse directions of the arc structures. Green dots with labels A–H mark the positions of the extracted spectra show in Fig. 4. Gray scales in panels c and d present the moment 0 map of the CO (1–0) emission observed with ALMA, and the map is obtained from the data released by ALMA Partnership et al. (2015). Contour levels are 5σ, 15σ, and 30σ in the high-velocity blueshifted map, are 5σ, 15σ, 35σ, and 55σ in the high-velocity redshifted map, are 5σ, 15σ, 25σ, 45σ, and 75σ in the medium-high-velocity maps, are 5σ, 10σ, 15σ, 25σ, 35σ, 45σ, and 75σ in the medium-low-velocity maps, and are 5σ, 10σ, 15σ, 20σ, and 60σ in the low-velocity maps. The noise level in the high-velocity blue- and redshifted map is 5.8 and 7.1 mJy Beam-1 km s-1, respectively, and the levels in the other maps are all 4.1 mJy Beam-1 km s-1. Significant flux is missing in the velocity ranges of panels c and d, as shown in Figs. B.1 and B.2. The negative contours are not plotted in panels c and d for clarity. |
Figures 2 and 3 present the moment 0 maps of the C18O and 13CO emission integrated over the four different velocity ranges, respectively. The integrated velocity ranges are high velocities (VLSR = 2.9–3.8 and 10.3–11.4 km s-1 for C18O and VLSR = 1.9–3.8 and 10.3–12.8 km s-1 for 13CO), medium-high velocities (VLSR = 3.8–4.8 and 9.2–10.3 km s-1), medium-low velocities (VLSR = 4.8–5.8 and 8.2–9.2 km s-1), and low velocities (VLSR = 5.8–7.1 and 7.1–8.2 km s-1). The systemic velocity (Vsys) is measured to be VLSR = 7.04 km s-1 (Sect. 4.1). The high-velocity blue- and redshifted C18O components are compact with sizes of 0.̋3 ± 0.̋04 (42 ± 6 au) and 0.̋44 ± 0.̋02 (62 ± 3 au), and are located southeast and northwest of HL Tau with a distance of 0.̋5 ± 0.̋04 (70 ± 6 au), respectively. At the medium-high velocities, the sizes of the blue- and redshifted C18O components increase to 0.̋6–0.̋9 (80–130 au), and the distance between their peak positions and HL Tau increases to 0.̋6–0.̋7 (80–100 au). These results show that the C18O emission at higher velocities is located closer to HL Tau. Furthermore, the axis passing through the peak positions of the high-velocity blue- and redshifted components has a PA of 130° ± 3°, and the axis of the medium-high-velocity components is 133° ± 1°. Therefore, these components are well aligned along the major axis of the protoplanetary disk around HL Tau, whose PA is 138° (ALMA Partnership et al. 2015). At the medium-low and low velocities, both the C18O blue- and redshifted components are elongated along the disk minor axis. In addition, the low-velocity components are centered on the position of HL Tau. Hence, the velocity structures of the central C18O emission is consistent with the observational signatures of Keplerian rotation (e.g., Dutrey et al. 1994).
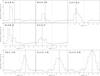 |
Fig. 4 Spectra of the 13CO emission along the arc structures. The positions A–H, where the spectra were extracted relative to HL Tau, are labeled in the upper left corners in the panels in units of arcseconds, and they are also labeled in Fig. 3. Vertical dotted lines denote the systemic velocity measured from the disk rotation. Vertical solid lines present the expected line-of-sight velocities computed from the model of the three-dimensional infalling and rotational motions (Sect. 4.3). |
In the high-velocity 13CO emission (Fig. 3a), the blue- and redshifted components are compact with sizes of 0.̋3–0.̋5 (50–70 au) and located close to HL Tau with a distance of 0.̋4 (60 au), similar to the high-velocity C18O emission. In addition, the axis passing through the peak positions of the high-velocity blue- and redshifted 13CO components is 135° ± 2°, so they are well aligned with the disk major axis. Thus, the high-velocity 13CO emission also exhibits the observational signatures of dominant rotational motion. The low-velocity blueshifted 13CO emission shows an extended and elongated structure in the northwest–southeast direction with a size of ~20″ (2800 au; Fig. 3d). This extended structure is also partially detected in the C18O emission (Fig. 2d). Similar structures are also observed in the CO (1–0) emission with ALMA (ALMA Partnership et al. 2015). These structures could be related to the large-scale ambient gas. Conversely, the low-velocity redshifted 13CO emission shows a bow-like structure with the apex located close to HL Tau, and its morphology is similar to the wall of the outflow cavity observed in the CO emission with SMA and ALMA (Lumbreras & Zapata 2014; ALMA Partnership et al. 2015; Klaassen et al. 2016). Hence, the low-velocity redshifted 13CO emission likely traces the cavity wall of the redshifted outflow.
At medium velocities (Figs. 3b and c), the 13CO emission exhibits extended arc structures, as delineated by the ridges of their contour lines (dotted curves in Fig. 3). Our method to measure the ridges of the contour lines is described in Appendix A. The entire velocity channel maps of the 13CO emission in the medium-velocity ranges are shown in Appendix B. The blue- and redshifted arc structures connect to the central component from the northeast and the southwest, and they stretch toward the northwest and the southeast, respectively. Figure 4 presents the spectra of the 13CO emission at several positions along the arc structures. The line width of the blueshifted arc structures is 0.7 km s-1, as seen at the offsets of A.( , 5′′) and B.(1.̋9, 3.̋3). At the offsets of D.(
 , 3′′) and E.(1.̋2, 2′′), there is a secondary component at VLSR ~ 5.8 km s-1 in the spectra, and it is likely associated with the large-scale ambient gas as seen in Fig. 3d. The broader line width at the offset of C.(3.̋7, 0.̋1) is most likely due to blending of the blueshifted arc structure and the large-scale ambient gas. The spectra in the redshifted arc structure all show broader line widths of 1.4–2.4 km s-1 than those in the blueshifted arc, as seen at the offsets of F.(0.̋7,
  ), G.(
 ,
,  ), and H.(
 ,
,  ). The redshifted arc structure is spatially coincident with the redshifted outflow observed at the low velocity (Fig. 3), and the two components are blended in the spectra. Thus, it is not straightforward to measure the line width of the redshifted arc structure. Nevertheless, the line width of the redshifted arc structure is most likely narrower than 1.4 km s-1 based on the spectrum at the offset of F.(0.̋7, ), where there is less contribution from the outflow.
The arc structures observed at medium-high velocities are located closer to HL Tau than those at medium-low velocities, showing that the inner part has a higher velocity than the outer part (Figs. 3b and c). Thus, there is a radial velocity gradient in each arc structure. In addition, the blue- and redshifted arc structures extend northwest and southeast, respectively. This forms an overall velocity gradient from the northwest to the southeast on a 1000 au scale. The overall velocity gradient in the northwest–southeast direction on a 1000 au scale has been observed in the 13CO (1–0) emission at lower resolutions of 3″–8″ (Sargent & Beckwith 1991; Hayashi et al. 1993; Cabrit et al. 1996; Welch et al. 2000). This was interpreted as Keplerian rotation around a protostar with a mass of 0.5–1 M⊙ by Sargent & Beckwith (1991) and as sub-Keplerian rotation in a disk-like structure by Hayashi et al. (1993). However, the ALMA observations show that the direction of this velocity gradient on a 1000 au scale is opposite to that of the disk rotation on a 100 au scale, where the northwestern part is redshifted and the southeastern part is blueshifted.
4. Analysis
4.1. Keplerian disk
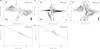 |
Fig. 5 Position–velocity diagrams along the disk major axis in the C18O emission (panel a) and the 13CO emission (panel c). Panel d: zoom-in of panel c. Blue and red data points show the measured peak positions in different velocity channels. Rotational profiles measured from the data points in panels a and d are shown in panels b and e. Green solid lines show the best-fit power-law functions of the rotational profiles. Contour levels are from 3σ in steps of 3σ in panel a, where 1σ is 6.7 mJy Beam-1, and the levels are from 3σ in steps of 5σ in panels c and d, where 1σ is 7 mJy Beam-1. In the P–V diagrams, vertical and horizontal dotted lines denote the systemic velocity of VLSR = 7.04 km s-1 and the stellar position, respectively, and gray rectangles in the bottom right corners show the angular and velocity resolutions. |
The C18O and 13CO emission shows observational signatures of rotation. To measure the rotational profiles in the C18O and 13CO emission, we followed the method described in Yen et al. (2013). We extracted position–velocity (P–V) diagrams along the disk major axis (PA = 138°) and measured the peak positions in given velocity channels (Figs. 5a, c, and d). The distances between the measured peak positions and HL Tau were adopted as rotational radii (Rrot), and the velocities at the velocity channels relative to the systemic velocity (| VLSR−Vsys |) were adopted as rotational velocities (Vrot). We then fit a power-law function to these data points,  (1)where R0 is the characteristic radius and was adopted to be 1″ (140 au), and f is the power-law index of the rotational profile. Thus, there are three free parameters in the fitting: Vrot(R0), f, and Vsys. This analysis was only applied to the C18O and 13CO emission in the high-velocity ranges (Figs. 2a and 3a), where there is no contamination from the extended structures. Furthermore, there is no velocity gradient in the P–V diagram along the disk minor axis at high velocities (Fig. 6), suggesting that the gas motion is dominated by the rotation with the least contamination from other motions in these velocity ranges. In contrast, at medium and low velocities, there is a clear velocity gradient along the disk minor axis in the P–V diagrams of the C18O and 13CO emission, which could be due to an infalling motion or outflow.
The rotational profile in the C18O emission is measured to be (2.44 ± 0.07) × (Rrot/R0)− 0.52 ± 0.04 km s-1 with Vsys = 7.04 ± 0.04 km s-1 (Fig. 5b). This rotational profile is consistent with Keplerian rotation (f = −0.5) within the uncertainty. Our measured Vsys is consistent with the Vsys estimated from the CN and HCN absorption observed with ALMA at a comparable angular resolution of 1″ (ALMA Partnership et al. 2015). A consistent rotational profile was measured in the 13CO emission, (2.36 ± 0.12) × (Rrot/R0)− 0.56 ± 0.06 km s-1 , with Vsys = 7.17 ± 0.03 km s-1, although the Vsys measured with the 13CO emission is higher than the Vsys measured with the C18O emission. When the Vsys is fixed at VLSR = 7.04 km s-1, the rotational profile in the 13CO emission is measured to be (2.47 ± 0.12) × (Rrot/R0)− 0.52 ± 0.05 km s-1 (Fig. 5e). Here the rotational velocity is not yet corrected for the inclination. Our results show that the C18O and 13CO emission lines in the high-velocity ranges trace the same gas motion.
The 13CO emission is optically thicker than the C18O emission and is expected to trace the upper layers of the disk, where the rotational velocity is lower than in the midplane at the same radius. Nevertheless, the rotational profiles measured with these two lines are consistent within the uncertainties, suggesting that the effect of the scale height on our measurements is negligible with our sensitivity and resolutions. In addition, we note that the measured Vsys with these two lines are different by 0.1 km s-1. The Vsys measured with the 13CO line is biased to a higher value because of the three data points at the highest redshifted velocities (>5 km s-1). These high-velocity data points are not detected in the C18O emission, which is likely due to the lower optical depth and thus fainter emission of the C18O line compared to the 13CO line. The three data points deviate from the overall rotational profile. Their origin is not clear, and their velocity structure is not resolved, meaning that the data points at different velocities show almost consistent radii. We have tested that when we removed these three data points from the analysis, the Vsys measured with the 13CO line is consistent with that with the C18O line within the uncertainty. Nevertheless, the overall rotational profile is not affected by these data points.
From the measured rotational profiles, the protostellar mass of HL Tau is estimated to be 1.8 M⊙, on the assumption that the inclination angle of the protoplanetary disk is 47° (ALMA Partnership et al. 2015). As discussed in Yen et al. (2013) and Aso et al. (2015), the method has a systematic error of 10−20% because of the limited resolutions and the possible contamination from other motions, so the uncertainty of our measured protostellar mass is estimated to be 0.3 M⊙. In addition, changing the inclination angle by ±5° results in a change in the measured protostellar mass by  M⊙. Our measured protostellar mass is consistent with 1.7 M⊙ estimated from the P–V diagrams in the HCO+ (1–0) and CO (1–0) emission observed with ALMA at a comparable angular resolution of ~1″ by Pinte et al. (2016).
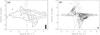 |
Fig. 6 Position–velocity diagrams along the disk minor axis in the C18O emission (panel a) and the 13CO emission (panel b). Contour levels are from 3σ in steps of 3σ in panel a and are from 3σ in steps of 5σ in panel b. Gray rectangles in the bottom right corners in the P–V diagrams show the angular and velocity resolutions. |
To estimate the disk mass, we fit a two-dimensional Gaussian function to the central C18O emission in the moment 0 map (Fig. 1). The total flux is measured to be 2.26 ± 0.22 Jy km s-1 with the deconvolved FWHM size of 1.̋87 ± 0.̋12 × 1.̋28 ± 0.̋08 (262 ± 17 au × 179 ± 11 au). The gas kinematic temperature in the protoplanetary disk around HL Tau was estimated to be 60 K at the outer radii of 60–100 au from the ALMA observations in the CO (1–0) emission (Yen et al. 2016). On the assumption of a local thermal equilibrium (LTE) condition and optically thin C18O emission, the mass traced by the C18O emission is estimated to be 3.5 × 10⁻³M⊙ with an excitation temperature of 60 K and a C18O abundance of 1.5 × 10⁻⁷ relative to H2 (Brittain et al. 2005; Smith et al. 2015). When the excitation temperature is assumed to be 100 K (Brittain et al. 2005), the estimated mass becomes 5 × 10⁻³M⊙. The gas mass in the protoplanetary disk around HL Tau estimated with the C18O emission is 0.2–0.3% of the protostellar mass and is comparable to the dust mass estimated with the continuum emission, (0.3–3) × 10-3M⊙ (D’Alessio et al. 1997; Men’shchikov et al. 1999; Kwon et al. 2011; Pinte et al. 2016; Carrasco-González et al. 2016). This could imply a low gas-to-dust mass ratio of <10. Such a low gas-to-dust mass ratio in the protoplanetary disk around HL Tau has been suggested by Pinte et al. (2016) by modeling the 2.9 mm, 1.3 mm, and 0.87 mm continuum data obtained with ALMA. On the other hand, observations have found that CO molecules can be depleted by two orders of magnitude in protoplanetary disks because of carbon depletion (e.g., Schwarz et al. 2016). If that is the case, the C18O abundance can be lower than the typical value in the ISM even when the temperature is higher than the CO sublimation temperature, and the disk mass estimated with the C18O emission in HL Tau would be higher, resulting in a higher gas-to-dust mass ratio. Moreover, the radiative transfer model suggests that the 1.3 mm continuum emission in the protoplanetary disk around HL Tau is optically thick, with τ ranging from 2 to 6, except at the radii of the gaps (Pinte et al. 2016). The gas mass of the disk estimated from our continuum-subtracted C18O flux can be biased to a lower value because of the continuum optical depth. Thus, our estimated disk gas mass should be considered as a lower limit because of the possible CO depletion and the effect of the continuum opacity.
4.2. Temperature, column density, and mass of the arc structures
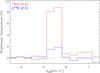 |
Fig. 7 Spectra of the C18O (blue histogram) and 13CO (red histogram) emission averaged over the area within a radius of 0.̋35 centered on the offset of ( |
In the medium-low velocity range, the C18O emission exhibits a blueshifted component located at ~7″ northwest of HL Tau (Fig. 2c). This C18O component is coincident with the northwestern intensity peak in the blueshifted arc structure in the 13CO emission in the same velocity range (Fig. 3). On the assumption that this C18O component and the coincident 13CO emission trace the same bulk of gas, we estimated the gas kinematic temperature and column density by comparing the C18O and 13CO brightness temperatures. Figure 7 presents the spectra of the C18O and 13CO emission averaged over the region within a radius of 0.̋35 centered on the northwestern C18O component. The averaged area is the same as the size of the synthesized beam. The spectra show that the C18O and 13CO emission lines are both detected in two velocity channels, corresponding to a line width of 0.68 km s-1. The mean brightness temperatures of the C18O and 13CO emission over the two velocity channels are measured to be TC18O = 1.7 ± 0.2 K and T13CO = 8.4 ± 0.2 K, respectively. The C18O (2–1) and 13CO (2–1) lines are thermalized at typical densities in protostellar sources on a 1000 au scale, where n(H2) > 104 cm-3 (e.g., Shirley et al. 2000). Thus, the excitation temperatures of these two lines are expected to be the same as the gas kinematic temperature. The excitation temperature (Tex) and their optical depths (τC18O and  ) can be derived from their line ratio as
 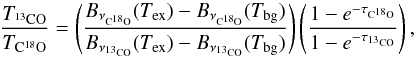 (2)where Bν is the Planck function at the frequency ν, νC18O and
  are the rest frequencies of C18O (2–1) and 13CO (2–1), and Tbg is the cosmic background temperature of 2.73 K. The ratio of τC18O to can be computed with a given Tex and a 13CO/C18O abundance ratio to solve the above equation. In our calculation, the 13CO/C18O abundance ratio was adopted to be 10, which was measured from infrared spectra of CO and its isotopologues in HL Tau (Brittain et al. 2005; Smith et al. 2015). This 13CO/C18O abundance ratio is higher than the typical ratio of 7 in the ISM and 5.5 in the solar system (Wilson & Rood 1994). With Eq. (2), Tex is derived to be 15 K, τC18O to be 0.18, and to be 1.78. Thus, the gas kinematic temperature at the northwestern peak in the arc structures is estimated to be 15 K. Assuming this component is in the disk plane, its deprojected radius is 7.̋6 (1060 au). The estimated gas kinematic temperature is consistent with the expected dust temperature at a distance of 1000 au from a star with a luminosity of 7.6 L⊙ (15 K; Beckwith et al. 1990; Hayashi et al. 1993), and it is lower than the gas temperature of ~60 K in the outer region (~60–100 AU) of the protoplanetary disk around HL Tau measured with the ALMA CO (1–0) observations (Yen et al. 2016). When a lower 13CO/C18O abundance ratio of 5.5 is adopted, the derived Tex, τC18O, and become 38 K, 0.05, and 0.3, respectively.
Except for the northwestern C18O component, no other C18O counterpart of the arc structures is clearly detected. Thus, to estimate the mass of the arc structures, we interpolated the temperature assuming it is a power-law profile, and the temperature is 15 K at a radius of 1000 au (this work) and 60 K at a radius of 100 au (Yen et al. 2016). The power-law index is derived to be −0.6. Then, we computed the optical depth of the 13CO emission pixel by pixel from its mean brightness temperature in the medium-velocity ranges on the assumption of a LTE condition. Our calculation shows that the 13CO emission is mostly optically thin to close to optically thick, with τ ranging from 0.3 to 1, except for the northwestern end of the blueshifted arc structure, where τ increases to 2–3. From Figs. 3b and c, the integrated fluxes of the blue- and redshifted arc structures are measured to be 866 Jy km s-1 over an area of 194 square arcsecond and 533 Jy km s-1 over an area of 110 square arcsecond, respectively. To exclude the contribution from the protoplanetary disk at medium velocities, the flux in the central region, where intense C18O emission is present (light blue contours in Fig. 8), was not integrated. The masses of the blue- and redshifted arc structures are estimated to be 2.9 × 10⁻³M⊙ and 2.8 × 10⁻³M⊙ on the assumption of the 13CO abundance of 1.5 × 10⁻⁶ relative to H2 (Brittain et al. 2005; Smith et al. 2015). The correction of the optical depth, τ/ (1−exp− τ), was performed pixel by pixel. The estimated mass of the arc structures is comparable to or lower than the mass of the protoplanetary disk estimated from the C18O emission (Sect. 4.1) and also from the continuum emission (0.003–0.3 M⊙; e.g., Pinte et al. 2016; Carrasco-González et al. 2016). In addition, it is approximately one-tenth of the total mass on a scale of 20″ (2800 au) around HL Tau measured with the Nobeyama Millimeter Array at an angular resolution of 5″ (0.03 M⊙; Hayashi et al. 1993) and with the IRAM 30 m telescope at an angular resolution of 22″ (0.06 M⊙; Cabrit et al. 1996). The interpolated temperature profile shows that the kinematic temperature is higher than 20 K, the CO sublimation temperature, at a radius smaller than 600 au. Hence, our mass estimation of the arc structures is likely not affected by CO frozen out onto dust grains, except for the northwestern end of the blueshifted arc structure, where the temperature is likely lower than 20 K.
4.3. Kinematics of arc structures
Figure 8 presents the moment 0 maps of the 13CO emission integrated over the medium-velocity ranges only and overlaid on the moment 1 map of the 13CO emission computed with the entire velocity range to emphasize the velocity pattern of the arc structures. The light blue contours show the moment 0 map of the C18O emission. The velocity features inside these C18O contours are dominated by the disk component, and they are therefore not discussed here. The arc structures exhibit a dominant velocity gradient along the disk minor axis from the northeast (blueshifted) to the southwest (redshifted). In addition, there is a smaller velocity gradient along the disk major axis, where the northwestern part is more blueshifted than the southeastern part. This is more clearly shown in the P–V digram along the major axis (Fig. 5c). The southeastern part is centered on the relative velocity of −1 km s-1, and the northwestern part is distributed at the relative velocity from −2.5 km s-1 to −1 km s-1 with respect to Vsys = −7 km s-1. To study these observed velocity structures of the arc structures, we computed model moment 1 maps of different types of gas motions and compared them with the observations.
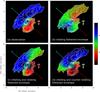 |
Fig. 8 White and light blue contours present the moment 0 map of the 13CO emission at the medium velocities and the C18O emission, respectively. Color scales present the moment 1 maps of panel a: the observed 13CO emission computed with the entire velocity range, same as Fig. 1 left; panel b: Keplerian rotating envelope model; panel c: infalling and rotating envelope model; and panel d: infalling and counter-rotating envelope model in units of km s-1 in the LSR frame. Blue and red arrows show the directions of the blue- and redshifted outflows. Crosses denote the position of HL Tau. Contour levels are 5%, 10%, 15%, 20%, 35%, 70%, and 90% of the peak intensity in the 13CO map, and are 20%, 50%, and 80% of the peak intensity in the C18O map. The peak intensities are 0.78 and 0.41 Jy Beam-1 km s-1, corresponding to 94σ and 52σ, in the 13CO and C18O maps, respectively. |
4.3.1. Keplerian rotation model
Figure 8b presents the model moment 1 map assuming that the arc structures follow Keplerian rotation around HL Tau with a protostellar mass of 1.8 M⊙. We assume that the arc structures are in the disk plane with an inclination angle of 47° and a PA of 138°, the same as the central protoplanetary disk. The model moment 1 map shows a clear velocity gradient along the disk major axis, where the northwestern part is redshifted and the southeastern part is blueshifted, and there is no velocity gradient along the disk minor axis. In our observations, the northwestern part of the arc structures is blueshifted, and the velocity pattern is not symmetric with respect to the disk minor axis. In addition, a velocity gradient along the disk minor axis is clearly observed. These features are inconsistent with the expectation from a dominant rotational motion, and thus the motion of the arc structures is not pure rotation around HL Tau.
4.3.2. Infall and rotation model
The arc structures exhibit a clear velocity gradient along the disk minor axis (northeast–southwest direction), which was interpreted as infalling and rotational motions in a disk-like structure by Hayashi et al. (1993). To compare our observations with this interpretation, we computed models of an infalling and rotating geometrically thin envelope with our measured protostellar mass and specific angular momentum (see Appendix C.1). The moment 1 map of this model shows a clear velocity gradient along the disk minor axis similar to the observations (Fig. 8c), suggesting that the observed velocity gradient along the disk minor axis can be caused by infalling and rotational motions. However, in the model moment 1 map, the velocity in the northwestern region is close to the systemic velocity because the velocity of the infalling motion in the disk plane projected onto the line of sight approaches zero near the disk major axis. In addition, the rotational motion induces redshifted emission in the northwest, as demonstrated in Fig. 8b. As a result, there is no blueshifted velocity in the northwest in the model moment 1 map. This is inconsistent with the observations that show clear blueshifted emission in the northwest. The infalling and rotational motions in the disk plane therefore cannot fully explain the gas motions of the arc structures.
4.3.3. Infall and counter-rotation model
Alternatively, when the arc structures are infalling and rotating in a counter direction with respect to the disk rotation, this counter rotation can induce blueshifted emission toward the northwest and redshifted emission toward the southeast. To compare this scenario with the observations, we computed models of an infalling and counter-rotating geometrically thin envelope (see Appendix C.2). The moment 1 map of this model shows that the counter rotation indeed induces blueshifted emission in the northwest, similar to the observations (Fig. 8d). However, the velocity of the eastern part of the arc structures in the model moment 1 map is close to the systemic velocity and even becomes redshifted. The reason is that the counter-rotation induces redshifted emission in the southeast and compensates for blueshifted emission induced by the infalling motion. This feature is different from the observations, where the eastern part of the arc structures is clearly blueshifted. Therefore, the gas motions of the arc structures cannot be fully explained either with our model of the infalling and counter-rotational motions following a simple rotational profile.
 |
Fig. 9 Panel a: model moment 1 map (color) that best matches the observations, assuming the gas kinematics traced by the 13CO emission is the three-dimensional infalling and rotational motions as described by Eqs. (C.4)–(C.7). Panel b: residual moment 1 map (color) after subtracting the model moment 1 map, panel a from the observed moment 1 map, Fig. 8a. Panel c: ratio of the residuals to the expected relative velocity from the model. The color scale shows the percentages. White and light blue contours present the observed moment 0 maps of the 13CO emission at the medium velocities and the C18O emission, the same as those in Fig. 8. Blue and red arrows show the directions of the blue- and redshifted outflows. Crosses denote the position of HL Tau. |
4.3.4. Three-dimensional infall and rotation model
We then considered three-dimensional infalling motion because infalling gas above the disk plane can have a non-zero line-of-sight velocity (Vlos) along the disk major axis after projection, different from infalling motion with the geometrically thin approximation. In this model, we adopted the velocity profiles of three-dimensional infalling and rotational motions from Ulrich (1976) and Mendoza et al. (2004). To take all the possible orientations of the arc structures in the three-dimensional space into account, we assumed that the arc structures are composed of an assemble of infalling and rotating particles, and each particle can be located anywhere along the line of sight. In this case, all the possible angles between the velocity vectors and a given line of sight were computed. For each pixel, we searched for the model VLSR that best matched the observations. The details of the model calculations are described in Appendix C.3.
The model moment 1 map indeed shows similar velocity features to the observations, suggesting that the kinematics of the arc structures can be explained with the three-dimensional infalling and rotational motions, where the blue- and redshifted arc structures are located behind and in front of the disk plane, respectively. Figure 9b presents the residuals after subtracting the model from the observed moment 1 map. The residual map shows that the observed velocity of the redshifted arc structure and the inner and eastern parts of the blueshifted arc structure can be reproduced with the model. However, the observed velocity in the northwestern part of the blueshifted arc structure is clearly more strongly blueshifted than the model. The blueshifted velocity excess is as high as 0.8 km s-1, significantly higher than the velocity resolution of 0.34 km s-1. In other words, the northwestern part of the blueshifted arc structure has a relative velocity higher than the expected free-fall velocity. We note that this velocity excess is the difference between the observed and model VLSR and is not yet corrected for the projection. Figure 9c shows the ratio of the residuals to the expected relative velocity (i.e., Vlos in Eq. (C.7)) from the model. Considering the projection, the observed velocity excess is estimated to be ~60–70% of the expected free-fall velocity, which is significantly higher than the uncertainty in the protostellar mass. As all the possible angles between the velocity vector and the line of sight were considered in our model calculation, the deviation between the observed velocity and the expected free-fall velocity is not due to the orientation of the arc structures in the three-dimensional space. This result suggests that the gravity of HL Tau is insufficient to accelerate the infalling gas to the observed velocity. Therefore, the kinematics of the whole arc structures cannot simply be interpreted as infalling flows toward the disk with the conventional model.
4.3.5. Effects of missing flux on the observed velocity
We note that our ALMA observations suffer from missing flux, which may bias our observed mean velocity. HL Tau has been observed with the IRAM 30 m telescope in the 13CO (2–1) and (1–0) emission (Monin et al. 1996; Cabrit et al. 1996). The systemic velocity of the large-scale ambient gas on a scale of 2′ (17 000 au) around HL Tau is estimated to be VLSR = 6.3–6.6 km s-1, which is 0.4–0.7 km s-1 more blueshifted than the systemic velocity of HL Tau estimated from the disk rotation. We convolved our 13CO image with the angular resolution of the IRAM 30 m observations in the 13CO (2–1) emission, 11.̋4, and compared the observed brightness temperature at the position of HL Tau. In the blueshifted velocity range, the missing flux is ~40% at VLSR = 4.6 km s-1 and increases to 80% at VLSR = 5.6 km s-1. The missing flux is the highest and more than 95% at the systemic velocity of the ambient gas, VLSR = 6.3–6.5 km s-1. At the systemic velocity of the protoplanetary disk around HL Tau, VLSR = 7 km s-1, the missing flux is also more than 95%. In contrast, in the redshifted velocity range, there is almost no missing flux at VLSR> 8.4 km s-1. If the large-scale ambient gas is optically thick at the low velocities of VLSR ~ 5–7 km s-1, our ALMA observations cannot detect the 13CO emission (if any) originating from the arc structures at these low velocities and would resolve out the optically thick surface of the large-scale ambient gas. Missing the emission at these low velocities can bias the observed mean velocity in the blueshifted arc structure to be more blueshifted. In Fig. 4 we denote the model velocity of the three-dimensional infalling and rotational motions at these positions. If the arc structures indeed follow the free-falling and rotational motions and show the higher velocity because of the missing flux, the actual spectra without the missing flux should be centered on this expected velocity from the model. This would imply that the actual line width of the blueshifted arc structure is 2 km s-1. On the other hand, there is less missing flux in the redshifted velocity range. The line width of the redshifted arc structure is narrower than 1.4 km s-1 at the offset of F.(0.̋7, ), where it is less strongly blended with the low-velocity outflow. Thus, the line width of the blueshifted arc structure is not expected to be as wide as 2 km s-1, assuming that the blue- and redshifted arc structures have the same origin and similar physical conditions. The high observed mean velocity in the northwestern part of the blueshifted arc structure is probably not purely caused by the missing flux. Nevertheless, adding short-spacing data to fully recover the structures at low velocities with a high angular resolution is essential to examine this possibility.
5. Discussion
Our ALMA observations reveal the arc structures in the 13CO emission that are connected to the protoplanetary disk around HL Tau (Figs. 3b and c). The overall velocity features of the arc structures can be explained with three-dimensional infalling and rotational motions (Fig. 9a). However, the observed relative velocity in the northwestern part of the blueshifted arc structure is higher than the expectation from the free-fall motion, and the deviation is as large as 0.8 km s-1, corresponding to ~60–70% of the expected free-fall velocity (Fig. 9). Thus, its kinematics cannot be fully explained with the conventional model of infalling and rotational motions (e.g., Ulrich 1976). This suggests that the gravity of HL Tau is insufficient to accelerate the infalling gas to the observed relative velocity. If the observed arc structures are indeed infalling toward the protoplanetary disk around HL Tau, a force in addition to the gravity of HL Tau is required to drive the infalling motion.
The 13CO (1–0) map with a size of 6′ toward HL Tau obtained by combining BIMA and NRAO 12m data shows a shell with a size of 2′× 1.́5 (~11 000 au in radius) centered on XZ Tau that is located 25″ east of HL Tau (Welch et al. 2000). This large-scale shell is interpreted as an expanding bubble with an expanding velocity of 1.2 km s-1 based on its velocity structures observed in the 13CO (1–0) emission, and the expansion is suggested to be driven by XZ Tau (Welch et al. 2000). XZ Tau is a binary system and classified as a classical T Tauri star. Observations with the Hubble Space Telescope reveal several concentric elongated bubbles on a 10″ scale around XZ Tau, suggesting that XZ Tau has episodically ejected wide-angle outflows (Krist et al. 1999, 2008). The molecular outflows in XZ Tau have been observed in the CO (1–0) emission on a 10″ scale with ALMA, and the observed velocity features also hint at wide-angle expansion (Zapata et al. 2015). HL Tau is located at the wall of the large-scale expanding shell. Thus, the protostellar envelope around HL Tau can be compressed by the expansion. The single-dish observations indeed show that the systemic velocity of the large-scale ambient gas is different from that of HL Tau (Monin et al. 1996; Cabrit et al. 1996). This suggests that the current protostellar envelope around HL Tau could have relative motion with respect to HL Tau, possibly due to the compression by the expanding shell. The dynamical timescale of the expansion can be estimated as the radius of the expanding shell (11 000 au) over the expanding velocity (1.2 km s-1) to be 4 × 10⁴ yr. This is shorter than the typical lifetime of the Class 0 and I stage (105 yr; Enoch et al. 2009). Thus, initially HL Tau could form out of a protostellar envelope having a Vsys of 7 km s-1, as we measured from the disk rotation (Sect. 4.1). Later, the protostellar envelope could be compressed by the expanding shell driven by XZ Tau and have motions relative to HL Tau, resulting in a different Vsys, and the outer envelope material could collapse toward HL Tau with a non-zero initial velocity. In this case, the infalling velocity can be higher than the expected free-fall velocity derived from the protostellar mass of HL Tau. The difference in the observed relative velocity and the expected free-fall velocity in the northwestern part of the arc structures is ≲0.8 km s-1. This is comparable to the difference in the systemic velocities between HL Tau and the large-scale ambient gas, 0.4–0.7 km s-1, and is lower than the expanding velocity of the shell, 1.2 km s-1. Therefore, the scenario of the infalling envelope externally compressed by the expanding shell is able to explain the observed high velocity of the blueshifted arc structure, and the arc structures are infalling toward the protoplanetary disk around HL Tau.
The morphologies of the arc structures observed in HL Tau are much more strongly bent than the expected trajectories of material that is free-falling with a specific angular momentum of 1.9 × 10⁻³ km s-1 pc, corresponding to a centrifugal radius of 100 au, toward HL Tau (see Fig. 2 in Tobin et al. 2012). Thus, the arc morphologies are probably not caused by the trajectory of the infalling material, unless the infalling material initially posses a much higher specific angular momentum than the central protoplanetary disk around HL Tau and loses its angular momentum through mechanisms such as magnetic braking within a 1000 au scale, making its velocity vector closer to the radial direction afterward. This is different from the case in the other Class I protostar L1489, where the morphologies and velocity structures of the infalling flows can be described with the conventional model of free-fall motion with a constant angular momentum (Yen et al. 2014). On the other hand, asymmetric arc structures are often present in numerical simulations of infalling envelopes. In magnetohydrodynamic (MHD) simulations including the effect of magnetic flux being decoupled from material accreted onto stars, the magnetic flux can accumulate and form regions with high magnetic pressure non-isotropically. These high-pressure regions can resist infalling material. Then infalling material flows along the boundary of the high-pressure region and can appear like arc structures (e.g., Fig. 6 in Zhao et al. 2011, and Fig. 6 in Krasnopolsky et al. 2012). In addition, in the MHD simulations, where the magnetic field and the rotational axis are misaligned, the flattened structures that are formed by mass accumulation perpendicular to the magnetic field direction can be twisted by the rotation. The twisted flattened structures can be seen as arcs or spirals after projection with certain inclination angles (e.g., Fig. 1 in Joos et al. 2012). Nevertheless, the magnetic field tends to slow down infall and rotation (e.g., Li et al. 2011). The observed arc structures with the velocity higher than the expected free-fall velocity cannot be explained by simply including the magnetic field effects. Asymmetric arc structures also form in the simulations incorporating turbulence, where the density distribution of an infalling envelope is perturbed by turbulence and can exhibit arc structures (e.g., Fig. 2 in Li et al. 2014). It is also possible that the morphologies of the arc structures are simply related to the initial density distribution and velocity structures of the infalling material, which are shaped by the expanding bubble driven by XZ Tau.
If the observed arc structures are indeed infalling toward the protoplanetary disk around HL Tau, the infalling timescale of the arc structures that are fully accreted onto the protoplanetary disk can be estimated as r/Vr. With Vr and r derived from the best-match model velocity field (Fig. 9a) and ignoring the additional acceleration caused by the external compression for simplicity, the mass-weighted mean infalling timescale is estimated to be ~2600 yr. The mass of the arc structures is estimated to be 5.7 × 10⁻³M⊙ (Sect. 4.2). Then, the mass infalling rate onto the protoplanetary disk around HL Tau is estimated to be 5.7 × 10⁻³/ 2600 = 2.2 × 10⁻⁶M⊙ yr-1. We note that the mass of the arc structures is only approximately 10% of the total gas mass observed on a scale of a few thousand au around HL Tau. The mass accretion rate onto HL Tau can be estimated as LbolR∗/GM∗, where R∗ is the stellar radius of HL Tau. With Lbol = 3.5–15L⊙ (Robitaille et al. 2007), M∗ = 1.8M⊙, and R∗ = 5R⊙ (Palla & Stahler 1991), the mass accretion rate is estimated to be (0.3–1.4) × 10-6M⊙ yr-1, assuming the bolometric luminosity of HL Tau fully originates from the gravitational energy released by the accretion. These mass infalling and accretion rates are significantly higher than those in solar-mass T Tauri stars, which have mass accretion rates of 10-7–10-9M⊙ yr-1 (Beltrán & de Wit 2016) and are comparable to those of Class 0 and I protostars (e.g., Yen et al. 2017). The estimated mass infalling rate onto the disk is comparable to or possibly higher than the estimated mass accretion rate onto HL Tau. Hence, the disk mass could gradually increase, and the disk around HL Tau may become gravitationally unstable because of the continuous mass infall from the envelope (Hennebelle et al. 2017; Tomida et al. 2017).
Alternatively, the arc structures observed in HL Tau can be outflowing rather than infalling. The arc structures show a velocity gradient along the disk minor axis, where the northeastern part is blueshifted and the southwestern part is redshifted. The direction of this velocity gradient is the same as that of the outflow in the CO lines observed with SMA and ALMA (Lumbreras & Zapata 2014; ALMA Partnership et al. 2015; Klaassen et al. 2016). If the blue- and redshifted arc structures are located in front of and behind the disk plane, respectively, the observed velocity gradient can be explained with outflowing motion. The elongations of the arc structures are perpendicular to the outflow direction. The opening angle of the CO outflow is measured to be 60°–90° (Klaassen et al. 2016), and the infrared image also shows a V-shaped morphology with an opening angle of 60° on a scale of 3″ (Takami et al. 2007). The opening angle of the outflow is not as wide as the extension of the arc structures. In addition, the inner part of the arc structures has a higher velocity than the outer part. This velocity structure is different from the structure typically observed in molecular outflows, which shows higher velocities in outer parts (Shu et al. 1991, 2000; Lee et al. 2000). Thus, if the arc structures are indeed moving away from HL Tau, their outflowing motions are probably not due to the jets or wind launched by the central star-disk system. Finally, hydrodynamical simulations show that if a circumstellar disk is sufficiently massive and becomes gravitationally unstable, the disk can form several arc structures and/or fragment into gas clumps (e.g., Figs. 2 and 3 in Vorobyov 2016, Fig. 2 in Tomida et al. 2017, and Fig. 3 in Hennebelle et al. 2017). Arc structures similar to those in the simulations have been observed on scales of 500–1000 au around young stellar objects that are undergoing accretion outbursts with coronagraphic polarimetric imaging in the near-infrared (Liu et al. 2016). In the simulations, some of these gas clumps can be ejected away via their multi-body interaction, and the ejected gas clumps and the central disk are linked with arc structures (Vorobyov 2016). The ejected gas clumps can have velocities of a few times their escape velocities, and they have masses of tens of Jupiter mass, resulting in a high mass loss rate in a short period (0.1–0.2 M⊙ in 0.1 Myr; Vorobyov 2016). If the observed arc structures are gas clumps ejected by the protoplanetary disk around HL Tau due to the gravitational instability in the disk, it could explain the observed relative velocity, which is higher than the expected free-fall velocity. In addition, the mass of the observed arc structures is comparable to those of the ejected gas clumps in the simulations.
The analysis of the millimeter and submillimeter continuum emission in the protoplanetary disk around HL Tau observed with ALMA at angular resolutions of 0.̋03–0.̋07 (5–10 au) indeed suggests that the disk can be gravitationally unstable at a radius larger than ~50 au, and the gravitational instability is proposed as a possible mechanism to form hypothetical bodies that open gaps in the disk (Akiyama et al. 2016). Nevertheless, the analysis of the gravitational instability in the protoplanetary disk around HL Tau depends on the assumed gas-to-dust mass ratio, which was adopted to be 100. With a gas-to-dust mass ratio of 100, the disk mass was estimated to be ~0.13 M⊙ (Kwon et al. 2011), which is 7% of the protostellar mass. This implies that the C18O abundance is 40 times lower than the typical ISM value based on the ratio between our estimated disk mass from the C18O emission and the disk mass of 0.13 M⊙ estimated from the continuum emission. A CO abundance lower than the ISM value by two orders of magnitude has been observed in the protoplanetary disk around TW Hya (Schwarz et al. 2016), and possibly also in several other disks (e.g., Ansdell et al. 2016). Therefore it is possible that the observed arc structures are formed by the gravitational instability in the protoplanetary disk and are moving away from HL Tau. In this case, the formation of the arc structures and the gaps in the protoplanetary disk around HL Tau could be linked.
6. Summary
We performed imaging and analyses on our ALMA cycle-3 data of the 13CO (2–1) and C18O (2–1) emission in the planet formation candidate HL Tau. The aim was to probe the gas kinematics in the protostellar envelope surrounding the protoplanetary disk and to investigate the interaction between the envelope and the disk. Our main results are summarized below.
-
1.
The C18O emission primarily traces a compact component with asize of 2″× 1.̋5(280 au × 210 au) aroundHL Tau. The 13CO emission also shows a similarcentral component. The central components are oriented alongthe major axis of the protoplanetary disk and exhibit dominantvelocity gradients along the disk major axis.
-
2.
Two arc structures on a scale of 1000–2000 au connected to the central component are observed in the 13CO emission. The blueshifted arc structure stretches from the northeast to the northwest, and the redshifted arc from the southwest to the southeast. The arc structures show overall velocity gradients along both the disk major and minor axes. The direction of the velocity gradient along the minor axis is consistent with the outflow and the infalling motion, and the velocity along the major axis is opposite to the rotational direction of the protoplanetary disk. The mass of the arc structures is estimated to be 5.7 × 10⁻³M⊙.
-
3.
The rotational profile of the central component is measured to be (2.44 ± 0.07) × (Rrot/R0)− 0.52 ± 0.04 km s-1 in the C18O emission and (2.47 ± 0.12) × (Rrot/R0)− 0.52 ± 0.05 km s-1 in the 13CO emission, and the systemic velocity is measured to be VLSR = 7.04 ± 0.04 km s-1. This rotational profile is consistent with Keplerian rotation (f = −0.5) within the uncertainty, suggesting that this central component traces the protoplanetary disk around HL Tau. The protostellar mass of HL Tau is estimated to be 1.8 ± 0.3 M⊙ on the assumption that the inclination angle of the protoplanetary disk is 47°. The gas mass of the disk is estimated to be 3.5 × 10⁻³M⊙ with the ISM C18O abundance. This is comparable to the dust mass of the disk, (0.3–3) × 10-3M⊙, estimated in previous studies of the continuum emission, suggesting a low gas-to-dust mass ratio of <10 or a low C18O abundance of <10-8 in the protoplanetary disk around HL Tau.
-
4.
Comparison between the moment 1 maps of the arc structures observed in the 13CO emission with the models of different gas motions suggests that the kinematics of the arc structures cannot be fully explained with the infalling and (counter-)rotational motions in the flattened envelope around HL Tau. The overall velocity structures can be better explained with the three-dimensional infalling and rotational motions, where the blue- and redshifted arc structures are located behind and in front of the disk plane, respectively. However, the observed mean velocity in the northwest part of the blueshifted arc structure is more blueshifted than the expectation from the model, suggesting that the observed velocity is higher than the expected free-fall velocity. The velocity excess is as high as 0.8 km s-1 along the line of sight, corresponding to ~60–70% of the expected free-fall velocity.
-
5.
If the arc structures are indeed infalling flows toward the protoplanetary disk around HL Tau, its infalling velocity higher than the expected free-fall velocity can be explained with the external compression. HL Tau is located at the edge of an expanding shell driven by a nearby T Tauri star, XZ Tau. The systemic velocity of the ambient gas on a scale of 0.1 pc is VLSR = 6.3–6.6 km s-1, which is more strongly blueshifted than the velocity of the central disk. Thus, the protostellar envelope could have relative motion with respect to HL Tau because of the external compression by the expanding shell, resulting in the higher infalling velocity. In this scenario, the mass infalling rate onto the protoplanetary disk is estimated to be 2.5 × 10⁻⁶M⊙ yr-1, comparable to or higher than the mass accretion rate onto HL Tau, (0.3–1.4) × 10-6M⊙ yr-1. Thus, the protoplanetary disk around HL Tau could gradually increase its mass.
-
6.
Alternatively, the motions of the arc structures can be outflowing instead of infalling, if the blue- and redshifted arc structures are located in front of and behind the disk plane. The previous ALMA observations in the (sub-)millimeter continuum emission toward the protoplanetary disk around HL Tau suggest that the outer part (r> 50 au) of the disk can be gravitational unstable. The instability can cause a protoplanetary disk to form arc structures and gas clumps with masses of tens of Jupiter mass. Some of the gas clumps can be ejected via multi-body interaction and move away from the disk at velocities of a few times their escaping velocities, and the ejected gas clumps and the disk are connected with arc structures. Thus, the outflowing motion driven by the instability could explain the high velocity in the northwestern part of the blueshifted arc structure.
Acknowledgments
This paper makes use of the following ALMA data: ADS/JAO.ALMA#2015.1.00551.S. ALMA is a partnership of ESO (representing its member states), NSF (USA) and NINS (Japan), together with NRC (Canada), NSC and ASIAA (Taiwan), and KASI (Republic of Korea), in cooperation with the Republic of Chile. The Joint ALMA Observatory is operated by ESO, auI/NRAO and NAOJ. We thank all the ALMA staff supporting this work. We acknowledge Bo Zhao for fruitful discussion on formation of arc structures in numerical simulations. S.T. acknowledges a grant from the Ministry of Science and Technology (MOST) of Taiwan (MOST 102-2119-M-001-012-MY3), and JSPS KAKENHI Grant Number JP16H07086, in support of this work. N.H. is supported by the grant from MOST (MoST 105-2112-M-001-026). S.M. acknowledges a grant from MOST (MoST 103-2112-M-001-032-MY3). K.D.K was supported by the Polish National Science Centre MAESTRO grant DEC- 2012/06/A/ST9/00276.
References
- Akiyama, E., Muto, T., Kusakabe, N., et al. 2015, ApJ, 802, L17 [NASA ADS] [CrossRef] [Google Scholar]
- Akiyama, E., Hasegawa, Y., Hayashi, M., & Iguchi, S. 2016, ApJ, 818, 158 [NASA ADS] [CrossRef] [Google Scholar]
- ALMA Partnership, Brogan, C. L., Pérez, L. M., et al. 2015, ApJ, 808, L3 [NASA ADS] [CrossRef] [Google Scholar]
- Andrews, S. M., Wilner, D. J., Zhu, Z., et al. 2016, ApJ, 820, L40 [NASA ADS] [CrossRef] [Google Scholar]
- Anglada, G., López, R., Estalella, R., et al. 2007, AJ, 133, 2799 [NASA ADS] [CrossRef] [Google Scholar]
- Ansdell, M., Williams, J. P., van der Marel, N., et al. 2016, ApJ, 828, 46 [Google Scholar]
- Aso, Y., Ohashi, N., Saigo, K., et al. 2015, ApJ, 812, 27 [NASA ADS] [CrossRef] [Google Scholar]
- Beckwith, S. V. W., Sargent, A. I., Chini, R. S., & Guesten, R. 1990, AJ, 99, 924 [NASA ADS] [CrossRef] [Google Scholar]
- Beltrán, M. T., & de Wit, W. J. 2016, A&ARv, 24, 6 [NASA ADS] [CrossRef] [Google Scholar]
- Brittain, S. D., Rettig, T. W., Simon, T., & Kulesa, C. 2005, ApJ, 626, 283 [NASA ADS] [CrossRef] [Google Scholar]
- Cabrit, S., Guilloteau, S., Andre, P., et al. 1996, A&A, 305, 527 [NASA ADS] [Google Scholar]
- Carrasco-González, C., Henning, T., Chandler, C. J., et al. 2016, ApJ, 821, L16 [NASA ADS] [CrossRef] [Google Scholar]
- D’Alessio, P., Calvet, N., & Hartmann, L. 1997, ApJ, 474, 397 [NASA ADS] [CrossRef] [MathSciNet] [Google Scholar]
- Dipierro, G., Price, D., Laibe, G., et al. 2015, MNRAS, 453, L73 [NASA ADS] [CrossRef] [Google Scholar]
- Dong, R., & Fung, J. 2017, ApJ, 835, 146 [NASA ADS] [CrossRef] [Google Scholar]
- Dong, R., Fung, J., & Chiang, E. 2016, ApJ, 826, 75 [NASA ADS] [CrossRef] [Google Scholar]
- Dong, R., Zhu, Z., & Whitney, B. 2015, ApJ, 809, 93 [NASA ADS] [CrossRef] [Google Scholar]
- Dutrey, A., Guilloteau, S., & Simon, M. 1994, A&A, 286, 149 [NASA ADS] [Google Scholar]
- Enoch, M. L., Evans, N. J., II, Sargent, A. I., & Glenn, J. 2009, ApJ, 692, 973 [NASA ADS] [CrossRef] [Google Scholar]
- Ginski, C., Stolker, T., Pinilla, P., et al. 2016, A&A, 595, A112 [NASA ADS] [CrossRef] [EDP Sciences] [Google Scholar]
- Hayashi, M., & Pyo, T.-S. 2009, ApJ, 694, 582 [NASA ADS] [CrossRef] [Google Scholar]
- Hayashi, M., Ohashi, N., & Miyama, S. M. 1993, ApJ, 418, L71 [NASA ADS] [CrossRef] [Google Scholar]
- Hennebelle, P., Lesur, G., & Fromang, S. 2017, A&A, 599, A86 [NASA ADS] [CrossRef] [EDP Sciences] [Google Scholar]
- Isella, A., Guidi, G., Testi, L., et al. 2016, Phys. Rev. Lett., 117, 251101 [NASA ADS] [CrossRef] [Google Scholar]
- Jin, S., Li, S., Isella, A., Li, H., & Ji, J. 2016, ApJ, 818, 76 [NASA ADS] [CrossRef] [Google Scholar]
- Joos, M., Hennebelle, P., & Ciardi, A. 2012, A&A, 543, A128 [NASA ADS] [CrossRef] [EDP Sciences] [Google Scholar]
- Kanagawa, K. D., Muto, T., Tanaka, H., et al. 2015, ApJ, 806, L15 [NASA ADS] [CrossRef] [Google Scholar]
- Kanagawa, K. D., Muto, T., Tanaka, H., et al. 2016, PASJ, 68, 43 [NASA ADS] [Google Scholar]
- Kenyon, S. J., Dobrzycka, D., & Hartmann, L. 1994, AJ, 108, 1872 [NASA ADS] [CrossRef] [Google Scholar]
- Klaassen, P. D., Mottram, J. C., Maud, L. T., & Juhasz, A. 2016, MNRAS, 460, 627 [NASA ADS] [CrossRef] [Google Scholar]
- Konishi, M., Grady, C. A., Schneider, G., et al. 2016, ApJ, 818, L23 [NASA ADS] [CrossRef] [Google Scholar]
- Krasnopolsky, R., Li, Z.-Y., Shang, H., & Zhao, B. 2012, ApJ, 757, 77 [CrossRef] [Google Scholar]
- Krist, J. E., Stapelfeldt, K. R., Burrows, C. J., et al. 1999, ApJ, 515, L35 [NASA ADS] [CrossRef] [Google Scholar]
- Krist, J. E., Stapelfeldt, K. R., Hester, J. J., et al. 2008, AJ, 136, 1980 [NASA ADS] [CrossRef] [Google Scholar]
- Kwon, W., Looney, L. W., & Mundy, L. G. 2011, ApJ, 741, 3 [NASA ADS] [CrossRef] [Google Scholar]
- Lee, C.-F., Mundy, L. G., Reipurth, B., Ostriker, E. C., & Stone, J. M. 2000, ApJ, 542, 925 [NASA ADS] [CrossRef] [Google Scholar]
- Li, Z.-Y., Krasnopolsky, R., & Shang, H. 2011, ApJ, 738, 180 [NASA ADS] [CrossRef] [Google Scholar]
- Li, Z.-Y., Krasnopolsky, R., Shang, H., & Zhao, B. 2014, ApJ, 793, 130 [NASA ADS] [CrossRef] [Google Scholar]
- Liu, H. B., Takami, M., Kudo, T., et al. 2016, Sci. Adv., 2, e1500875 [Google Scholar]
- Loinard, L. 2013, in Advancing the Physics of Cosmic Distances, IAU Symp., 289, 36 [NASA ADS] [Google Scholar]
- Lumbreras, A. M., & Zapata, L. A. 2014, AJ, 147, 72 [NASA ADS] [CrossRef] [Google Scholar]
- Machida, M. N., Inutsuka, S.-I., & Matsumoto, T. 2010, ApJ, 724, 1006 [NASA ADS] [CrossRef] [Google Scholar]
- Men’shchikov, A. B., Henning, T., & Fischer, O. 1999, ApJ, 519, 257 [NASA ADS] [CrossRef] [Google Scholar]
- McMullin, J. P., Waters, B., Schiebel, D., et al. 2007, Astronomical Data Analysis Software and Systems XVI, eds. R. A. Shaw, F. Hill, & D. J. Bell (San Francisco, CA: ASP), ASP Conf. Ser., 376, 127 [Google Scholar]
- Mendoza, S., Cantó, J., & Raga, A. C. 2004, Rev. Mex. Astron. Astrofis., 40, 147 [NASA ADS] [Google Scholar]
- Momose, M., Morita, A., Fukagawa, M., et al. 2015, PASJ, 67, 83 [NASA ADS] [CrossRef] [Google Scholar]
- Monin, J.-L., Pudritz, R. E., & Lazareff, B. 1996, A&A, 305, 572 [NASA ADS] [Google Scholar]
- Movsessian, T. A., Magakian, T. Y., Bally, J., et al. 2007, A&A, 470, 605 [NASA ADS] [CrossRef] [EDP Sciences] [Google Scholar]
- Movsessian, T. A., Magakian, T. Y., & Moiseev, A. V. 2012, A&A, 541, A16 [NASA ADS] [CrossRef] [EDP Sciences] [Google Scholar]
- Ohashi, N., Saigo, K., Aso, Y., et al. 2014, ApJ, 796, 131 [NASA ADS] [CrossRef] [Google Scholar]
- Okuzumi, S., Momose, M., Sirono, S.-I., Kobayashi, H., & Tanaka, H. 2016, ApJ, 821, 82 [NASA ADS] [CrossRef] [Google Scholar]
- Oya, Y., Sakai, N., López-Sepulcre, A., et al. 2016, ApJ, 824, 88 [NASA ADS] [CrossRef] [Google Scholar]
- Palla, F., & Stahler, S. W. 1991, ApJ, 375, 288 [NASA ADS] [CrossRef] [Google Scholar]
- Perrot, C., Boccaletti, A., Pantin, E., et al. 2016, A&A, 590, L7 [NASA ADS] [CrossRef] [EDP Sciences] [Google Scholar]
- Pinte, C., Dent, W. R. F., Ménard, F., et al. 2016, ApJ, 816, 25 [NASA ADS] [CrossRef] [Google Scholar]
- Rapson, V. A., Kastner, J. H., Millar-Blanchaer, M. A., & Dong, R. 2015, ApJ, 815, L26 [NASA ADS] [CrossRef] [Google Scholar]
- Robitaille, T. P., Whitney, B. A., Indebetouw, R., & Wood, K. 2007, ApJS, 169, 328 [NASA ADS] [CrossRef] [Google Scholar]
- Sakai, N., Oya, Y., Sakai, T., et al. 2014a, ApJ, 791, L38 [NASA ADS] [CrossRef] [Google Scholar]
- Sakai, N., Sakai, T., Hirota, T., et al. 2014b, Nature, 507, 78 [NASA ADS] [CrossRef] [Google Scholar]
- Sakai, N., Oya, Y., López-Sepulcre, A., et al. 2016, ApJ, 820, L34 [NASA ADS] [CrossRef] [Google Scholar]
- Sargent, A. I., & Beckwith, S. 1987, ApJ, 323, 294 [NASA ADS] [CrossRef] [Google Scholar]
- Sargent, A. I., & Beckwith, S. V. W. 1991, ApJ, 382, L31 [NASA ADS] [CrossRef] [Google Scholar]
- Schwarz, K. R., Bergin, E. A., Cleeves, L. I., et al. 2016, ApJ, 823, 91 [NASA ADS] [CrossRef] [Google Scholar]
- Shirley, Y. L., Evans, N. J., II, Rawlings, J. M. C., & Gregersen, E. M. 2000, ApJS, 131, 249 [NASA ADS] [CrossRef] [Google Scholar]
- Shu, F. H., Ruden, S. P., Lada, C. J., & Lizano, S. 1991, ApJ, 370, L31 [NASA ADS] [CrossRef] [Google Scholar]
- Shu, F. H., Najita, J. R., Shang, H., & Li, Z.-Y. 2000, Protostars and Planets IV (Tucson: University of Arizona Press), 789 [Google Scholar]
- Smith, R. L., Pontoppidan, K. M., Young, E. D., & Morris, M. R. 2015, ApJ, 813, 120 [NASA ADS] [CrossRef] [Google Scholar]
- Takahashi, S. Z., & Inutsuka, S.-I. 2014, ApJ, 794, 55 [NASA ADS] [CrossRef] [Google Scholar]
- Takami, M., Beck, T. L., Pyo, T.-S., McGregor, P., & Davis, C. 2007, ApJ, 670, L33 [NASA ADS] [CrossRef] [Google Scholar]
- Tamayo, D., Triaud, A. H. M. J., Menou, K., & Rein, H. 2015, ApJ, 805, 100 [NASA ADS] [CrossRef] [Google Scholar]
- Testi, L., Skemer, A., Henning, T., et al. 2015, ApJ, 812, L38 [NASA ADS] [CrossRef] [Google Scholar]
- Tobin, J. J., Hartmann, L., Bergin, E., et al. 2012, ApJ, 748, 16 [Google Scholar]
- Tomida, K., Machida, M. N., Hosokawa, T., Sakurai, Y., & Lin, C. H. 2017, ApJ, 835, L11 [NASA ADS] [CrossRef] [Google Scholar]
- Ulrich, R. K. 1976, ApJ, 210, 377 [NASA ADS] [CrossRef] [Google Scholar]
- van der Plas, G., Wright, C. M., Ménard, F., et al. 2017, A&A, 597, A32 [NASA ADS] [CrossRef] [EDP Sciences] [Google Scholar]
- Visser, R., van Dishoeck, E. F., Doty, S. D., & Dullemond, C. P. 2009, A&A, 495, 881 [NASA ADS] [CrossRef] [EDP Sciences] [Google Scholar]
- Visser, R., Doty, S. D., & van Dishoeck, E. F. 2011, A&A, 534, A132 [NASA ADS] [CrossRef] [EDP Sciences] [Google Scholar]
- Vorobyov, E. I. 2010, ApJ, 723, 1294 [NASA ADS] [CrossRef] [Google Scholar]
- Vorobyov, E. I. 2011, ApJ, 729, 146 [NASA ADS] [CrossRef] [Google Scholar]
- Vorobyov, E. I. 2016, A&A, 590, A115 [NASA ADS] [CrossRef] [EDP Sciences] [Google Scholar]
- Welch, W. J., Hartmann, L., Helfer, T., & Briceño, C. 2000, ApJ, 540, 362 [NASA ADS] [CrossRef] [Google Scholar]
- Wilson, T. L., & Rood, R. 1994, ARA&A, 32, 191 [NASA ADS] [CrossRef] [Google Scholar]
- Yen, H.-W., Takakuwa, S., Ohashi, N., & Ho, P. T. P. 2013, ApJ, 772, 22 [NASA ADS] [CrossRef] [Google Scholar]
- Yen, H.-W., Takakuwa, S., Ohashi, N., et al. 2014, ApJ, 793, 1 [NASA ADS] [CrossRef] [Google Scholar]
- Yen, H.-W., Liu, H. B., Gu, P.-G., et al. 2016, ApJ, 820, L25 [NASA ADS] [CrossRef] [Google Scholar]
- Yen, H.-W., Koch, P. M., Takakuwa, S., et al. 2017, ApJ, 834, 178 [NASA ADS] [CrossRef] [Google Scholar]
- Yorke, H. W., & Bodenheimer, P. 1999, ApJ, 525, 330 [NASA ADS] [CrossRef] [Google Scholar]
- Zapata, L. A., Galván-Madrid, R., Carrasco-González, C., et al. 2015, ApJ, 811, L4 [NASA ADS] [CrossRef] [Google Scholar]
- Zhang, K., Blake, G. A., & Bergin, E. A. 2015, ApJ, 806, L7 [NASA ADS] [CrossRef] [Google Scholar]
- Zhang, K., Bergin, E. A., Blake, G. A., et al. 2016, ApJ, 818, L16 [NASA ADS] [CrossRef] [Google Scholar]
- Zhao, B., Li, Z.-Y., Nakamura, F., Krasnopolsky, R., & Shang, H. 2011, ApJ, 742, 10 [NASA ADS] [CrossRef] [Google Scholar]
- Zhu, Z., Hartmann, L., Nelson, R. P., & Gammie, C. F. 2012, ApJ, 746, 110 [NASA ADS] [CrossRef] [Google Scholar]
Appendix A: Measuring ridges of contour lines
The ridges of the contour lines were measured as follows. First we set a center, approximately the center of the curvature of the arc structures. Then we extracted a series of intensity profiles along the lines passing through that center in steps of PA of every 10°–20°. For each intensity profile, we fit a Gaussian profile to measure the peak position. These peak positions denote the ridges of the contour lines shown in Fig. 3. The selected center for the arc structures at the blueshifted medium-high velocity is (, 0.̋5); at the redshifted medium-high velocity, the center is (1.̋0, ); and at the redshifted medium-low velocity the center is (0.̋5, ). The arc structure at the blueshifted medium-low velocity is more extended, and two centers were selected at ( ,
,  ) and (
 ,
,  ) to extract the intensity profiles to cover the whole structure. We tested and confirm that the derived ridges are not sensitive to the choice of the centers.
Appendix B: Velocity channel maps of the 13CO emission
Figures B.1 and B.2 present the entire velocity channel maps of the 13CO emission at medium velocities, where the arc structures are observed, and at low velocities, where the extended structures are observed.
 |
Fig. B.1 Velocity channel maps of the 13CO emission in the blueshifted (a) and redshifted (b) medium-velocity ranges. Contour levels are 5σ, 10σ, 20σ, and 40σ, where 1σ is 7 mJy Beam-1. Color scales are in units of Jy Beam-1. Crosses denote the position of HL Tau. Filled ellipses present the size of the synthesized beam. The LSR velocity in units of km s-1 of each channel is labeled in the upper left corner in each panel. |
Appendix C: Kinematical models for the arc structures
Appendix C.1: Infall and rotation model
To compute this model, we adopt the geometrically thin approximation and assume that the arc structures are free-falling toward HL Tau and rotating with a constant specific angular momentum of 1.9 × 10⁻³ km s-1 pc, the same as that at the outer disk radius. The model velocity profiles are adopted to be 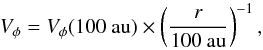 (C.1)
(C.1)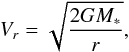 (C.2)where Vφ and Vr are the azimuthal and radial velocities, G is the gravitational constant, M∗ is the measured protostellar mass of HL Tau (1.8 M⊙), and Vφ(100 au) is 3.9 km s-1 from the measured rotational profile (Sect. 4.1).
Appendix C.2: Infall and counter-rotation model
In this model, we also adopt the geometrically thin approximation, and we assume that the arc structures are free-falling toward HL Tau and rotating in the counter direction with respect to the disk rotation. The observed relative velocity in the northwestern part of the blueshifted arc structure is ~1.5 km s-1 at a projected radius of 7″ (~1000 au; Fig. 7). When we attribute this relative velocity to the counter-rotation, it corresponds to a rotational velocity of 2.1 km s-1 after correcting the inclination angle with the geometrically thin approximation, and this is higher than the expected free-fall velocity at a radius of 1000 au, which is 1.8 km s-1. Thus, the arc structures are expected to be rotationally supported if the angular momentum is conserved. If the arc structures are indeed infalling and rotating in the counter direction, their angular momentum has to be dissipated as they fall toward the center. To mimic the angular momentum dissiplation, we assume the model velocity profile of the counter rotation to be 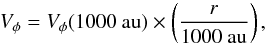 (C.3)where Vφ(1000 au) = 2.1 km s-1. The model velocity profile of the infalling motion is the same as Eq. (C.2).
Appendix C.3: Three-dimensional infall and rotation model
The model velocity profiles of three-dimensional infalling and rotational motions were adopted from Ulrich (1976) and Mendoza et al. (2004) as 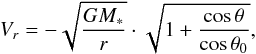 (C.4)
(C.4) (C.5)
(C.5) (C.6)where θ is the angle between the radius of infalling gas and the polar axis, θ0 is the initial θ of infalling gas, and Vθ is the velocity along the θ direction. This model describes material free-falling toward a point mass with zero total energy and a conserved angular momentum. The Vlos of three-dimensional infalling and rotational motions after projection can be computed as
  (C.7)where φ is the azimuthal angle. The inclination angle and the rotational axis of the three-dimensional model are adopted to be the same as those of the protoplanetary disk around HL Tau.
Along a given line of sight, the infalling gas located closer to the disk plane has a higher infalling velocity because of the smaller distance to the star, while its velocity vector is almost on the disk major axis and is perpendicular to the line of sight. The two effects compensate for each other and result in a low | Vlos |. On the other hand, the infalling gas located farther away from the disk plane has a lower infalling velocity and a velocity vector more parallel to the line of sight. That also results in a low | Vlos |. Hence, there is a maximum | Vlos | induced by the infalling and rotational motions along a given light of sight, where the distance of the infalling gas to the disk plane and the angle between its velocity vector and the line of sight are moderate. To generate the model moment 1 map of the three-dimensional infalling and rotational motions, we assume that the arc structures are composed of an assemble of infalling and rotating particles, and each particle can be located anywhere along the line of sight. Then, for a given pixel in the model map, we compute all the possible Vlos of these infalling and rotating particles along the line of sight with Eq. (C.7). When the Vlos + Vsys (= VLSR) of a particle matches the observed velocity at the same position, its Vlos + Vsys is assigned to that pixel in the model moment 1 map. When none of the computed Vlos + Vsys can match the observed velocity, the Vlos + Vsys of the particle with the maximum | Vlos | along the line of sight is assigned to that pixel. In our calculation, Vsys is adopted to be 7.04 km s-1, the same as the velocity of the central protoplanetary disk. With this process, we generate a model moment 1 map of the three-dimensional infalling and rotational motions that best matches the observations (Fig. 9a).
All Figures
|
Fig. 1 Moment 0 maps (contours) overlaid on moment 1 maps (color; in units of km s-1 in the LSR frame) of the 13CO (2–1; left) and C18O (2–1; right) emission in HL Tau obtained with our ALMA observations. Crosses denote the position of HL Tau. Blue and red arrows show the directions of the blue- and redshifted outflows. Blue filled ellipses present the sizes of the synthesized beams. In the 13CO map, contour levels are 5%, 10%, 15%, 30%, 50%, and 80% of the peak intensity, where the 5% level corresponds to 4.5σ (1σ = 13.7 mJy Beam-1 km s-1). The contour levels in the C18O map are 5%, 15%, 30%, 60%, and 90% of the peak intensity, where the 5% level corresponds to 2σ (1σ = 11.6 mJy Beam-1 km s-1). |
| In the text | |
|
Fig. 2 Moment 0 maps of the C18O emission integrated over four different velocity ranges, high velocities (VLSR = 2.9–3.8 and 10.3–11.4 km s-1), medium-high velocities (VLSR = 3.8–4.8 and 9.2–10.3 km s-1), medium-low velocities (VLSR = 4.8–5.8 and 8.2–9.2 km s-1), and low velocities (VLSR = 5.8–7.1 and 7.1–8.2 km s-1). Blue and red contours present the blue- and redshifted emission, respectively. Blue and red arrows show the directions of the blue- and redshifted outflows. Crosses denote the position of HL Tau. Filled blue ellipses show the size of the synthesized beam. Contour levels are 5σ, 10σ, and 15σ in the high-velocity blueshifted map, are 5σ, 15σ, 30σ, 50σ, and 70σ in the high-velocity redshifted map, are 5σ, 15σ, 30σ, and 45σ in the medium-high-velocity maps, are 5σ, 10σ, 15σ, 25σ, 45σ, and 75σ in the medium-low-velocity maps, and are 5σ, 10σ, 15σ, 25σ, 45σ, and 75σ in the low-velocity maps. The noise level in the high-velocity redshifted map is 5.1 mJy Beam-1 km s-1, and the levels in the other maps are all 3.9 mJy Beam-1 km s-1. |
| In the text | |
|
Fig. 3 Same as Fig. 2, but for the 13CO emission, and the high-velocity range for the 13CO emission is VLSR = 1.9–3.8 and 10.3–12.8 km s-1. Black and green dots delineate the ridges of the contour lines, showing the arc structures. The ridges of the contour lines were measured from the peak positions of the intensity profiles along the transverse directions of the arc structures. Green dots with labels A–H mark the positions of the extracted spectra show in Fig. 4. Gray scales in panels c and d present the moment 0 map of the CO (1–0) emission observed with ALMA, and the map is obtained from the data released by ALMA Partnership et al. (2015). Contour levels are 5σ, 15σ, and 30σ in the high-velocity blueshifted map, are 5σ, 15σ, 35σ, and 55σ in the high-velocity redshifted map, are 5σ, 15σ, 25σ, 45σ, and 75σ in the medium-high-velocity maps, are 5σ, 10σ, 15σ, 25σ, 35σ, 45σ, and 75σ in the medium-low-velocity maps, and are 5σ, 10σ, 15σ, 20σ, and 60σ in the low-velocity maps. The noise level in the high-velocity blue- and redshifted map is 5.8 and 7.1 mJy Beam-1 km s-1, respectively, and the levels in the other maps are all 4.1 mJy Beam-1 km s-1. Significant flux is missing in the velocity ranges of panels c and d, as shown in Figs. B.1 and B.2. The negative contours are not plotted in panels c and d for clarity. |
| In the text | |
|
Fig. 4 Spectra of the 13CO emission along the arc structures. The positions A–H, where the spectra were extracted relative to HL Tau, are labeled in the upper left corners in the panels in units of arcseconds, and they are also labeled in Fig. 3. Vertical dotted lines denote the systemic velocity measured from the disk rotation. Vertical solid lines present the expected line-of-sight velocities computed from the model of the three-dimensional infalling and rotational motions (Sect. 4.3). |
| In the text | |
|
Fig. 5 Position–velocity diagrams along the disk major axis in the C18O emission (panel a) and the 13CO emission (panel c). Panel d: zoom-in of panel c. Blue and red data points show the measured peak positions in different velocity channels. Rotational profiles measured from the data points in panels a and d are shown in panels b and e. Green solid lines show the best-fit power-law functions of the rotational profiles. Contour levels are from 3σ in steps of 3σ in panel a, where 1σ is 6.7 mJy Beam-1, and the levels are from 3σ in steps of 5σ in panels c and d, where 1σ is 7 mJy Beam-1. In the P–V diagrams, vertical and horizontal dotted lines denote the systemic velocity of VLSR = 7.04 km s-1 and the stellar position, respectively, and gray rectangles in the bottom right corners show the angular and velocity resolutions. |
| In the text | |
|
Fig. 6 Position–velocity diagrams along the disk minor axis in the C18O emission (panel a) and the 13CO emission (panel b). Contour levels are from 3σ in steps of 3σ in panel a and are from 3σ in steps of 5σ in panel b. Gray rectangles in the bottom right corners in the P–V diagrams show the angular and velocity resolutions. |
| In the text | |
|
Fig. 7 Spectra of the C18O (blue histogram) and 13CO (red histogram) emission averaged over the area within a radius of 0.̋35 centered on the offset of ( |
| In the text | |
|
Fig. 8 White and light blue contours present the moment 0 map of the 13CO emission at the medium velocities and the C18O emission, respectively. Color scales present the moment 1 maps of panel a: the observed 13CO emission computed with the entire velocity range, same as Fig. 1 left; panel b: Keplerian rotating envelope model; panel c: infalling and rotating envelope model; and panel d: infalling and counter-rotating envelope model in units of km s-1 in the LSR frame. Blue and red arrows show the directions of the blue- and redshifted outflows. Crosses denote the position of HL Tau. Contour levels are 5%, 10%, 15%, 20%, 35%, 70%, and 90% of the peak intensity in the 13CO map, and are 20%, 50%, and 80% of the peak intensity in the C18O map. The peak intensities are 0.78 and 0.41 Jy Beam-1 km s-1, corresponding to 94σ and 52σ, in the 13CO and C18O maps, respectively. |
| In the text | |
|
Fig. 9 Panel a: model moment 1 map (color) that best matches the observations, assuming the gas kinematics traced by the 13CO emission is the three-dimensional infalling and rotational motions as described by Eqs. (C.4)–(C.7). Panel b: residual moment 1 map (color) after subtracting the model moment 1 map, panel a from the observed moment 1 map, Fig. 8a. Panel c: ratio of the residuals to the expected relative velocity from the model. The color scale shows the percentages. White and light blue contours present the observed moment 0 maps of the 13CO emission at the medium velocities and the C18O emission, the same as those in Fig. 8. Blue and red arrows show the directions of the blue- and redshifted outflows. Crosses denote the position of HL Tau. |
| In the text | |
|
Fig. B.1 Velocity channel maps of the 13CO emission in the blueshifted (a) and redshifted (b) medium-velocity ranges. Contour levels are 5σ, 10σ, 20σ, and 40σ, where 1σ is 7 mJy Beam-1. Color scales are in units of Jy Beam-1. Crosses denote the position of HL Tau. Filled ellipses present the size of the synthesized beam. The LSR velocity in units of km s-1 of each channel is labeled in the upper left corner in each panel. |
| In the text | |
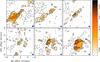 |
Fig. B.2 Same as Fig. B.1, but for the low-velocity range. |
| In the text | |
Current usage metrics show cumulative count of Article Views (full-text article views including HTML views, PDF and ePub downloads, according to the available data) and Abstracts Views on Vision4Press platform.
Data correspond to usage on the plateform after 2015. The current usage metrics is available 48-96 hours after online publication and is updated daily on week days.
Initial download of the metrics may take a while.