Fig. 4
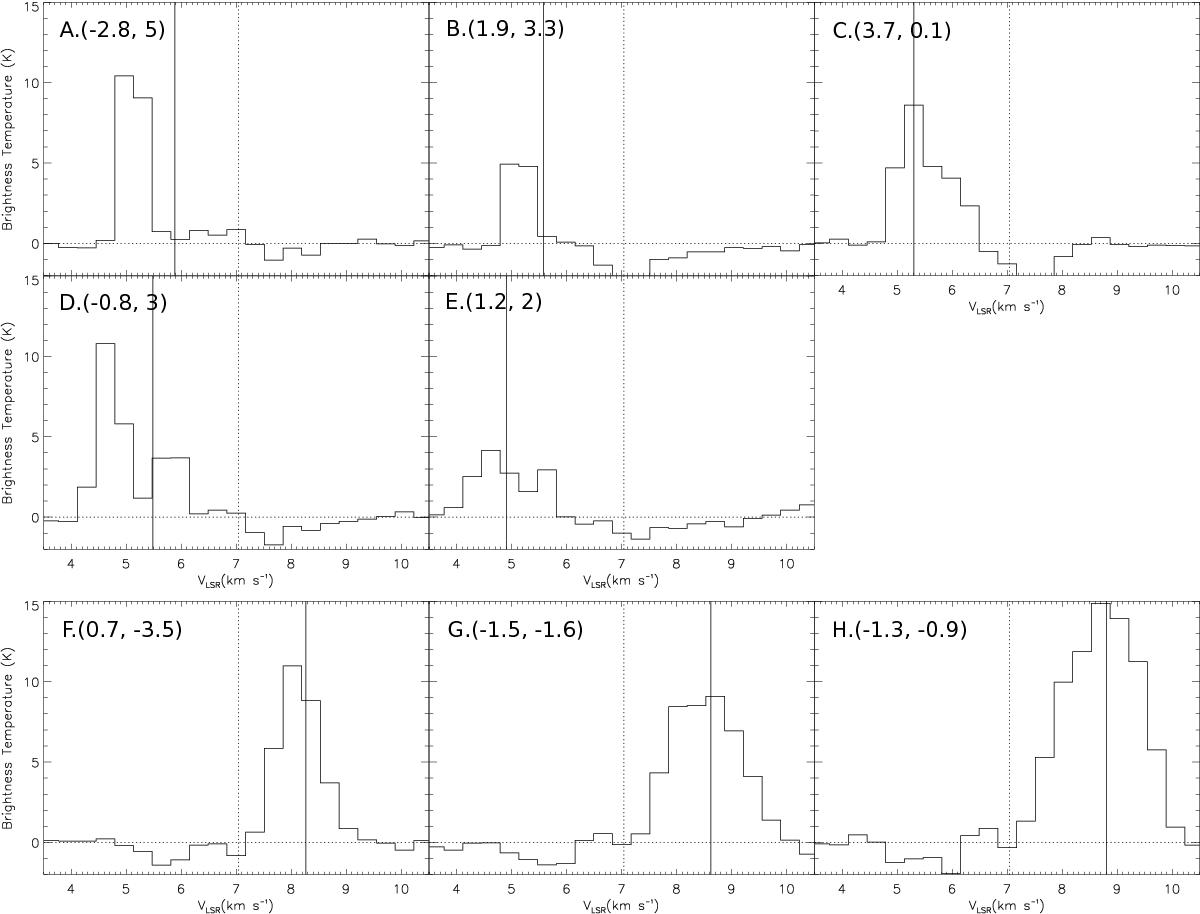
Spectra of the 13CO emission along the arc structures. The positions A–H, where the spectra were extracted relative to HL Tau, are labeled in the upper left corners in the panels in units of arcseconds, and they are also labeled in Fig. 3. Vertical dotted lines denote the systemic velocity measured from the disk rotation. Vertical solid lines present the expected line-of-sight velocities computed from the model of the three-dimensional infalling and rotational motions (Sect. 4.3).
Current usage metrics show cumulative count of Article Views (full-text article views including HTML views, PDF and ePub downloads, according to the available data) and Abstracts Views on Vision4Press platform.
Data correspond to usage on the plateform after 2015. The current usage metrics is available 48-96 hours after online publication and is updated daily on week days.
Initial download of the metrics may take a while.