Fig. 9
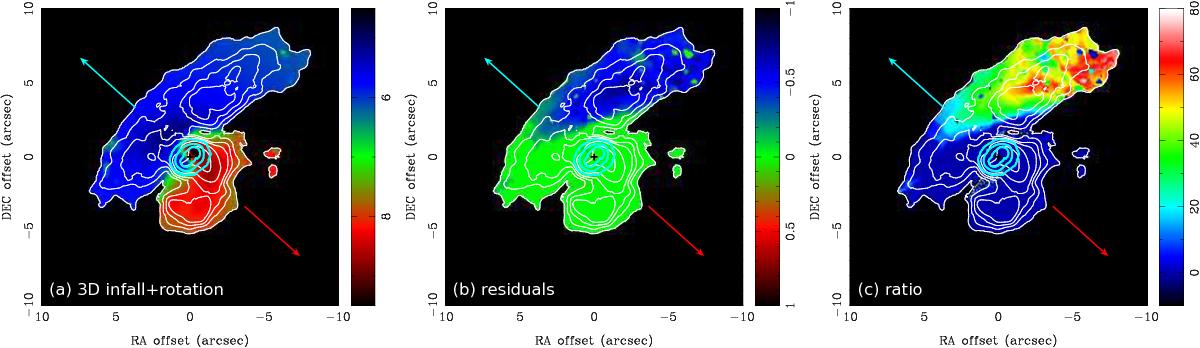
Panel a: model moment 1 map (color) that best matches the observations, assuming the gas kinematics traced by the 13CO emission is the three-dimensional infalling and rotational motions as described by Eqs. (C.4)–(C.7). Panel b: residual moment 1 map (color) after subtracting the model moment 1 map, panel a from the observed moment 1 map, Fig. 8a. Panel c: ratio of the residuals to the expected relative velocity from the model. The color scale shows the percentages. White and light blue contours present the observed moment 0 maps of the 13CO emission at the medium velocities and the C18O emission, the same as those in Fig. 8. Blue and red arrows show the directions of the blue- and redshifted outflows. Crosses denote the position of HL Tau.
Current usage metrics show cumulative count of Article Views (full-text article views including HTML views, PDF and ePub downloads, according to the available data) and Abstracts Views on Vision4Press platform.
Data correspond to usage on the plateform after 2015. The current usage metrics is available 48-96 hours after online publication and is updated daily on week days.
Initial download of the metrics may take a while.