Fig. 8
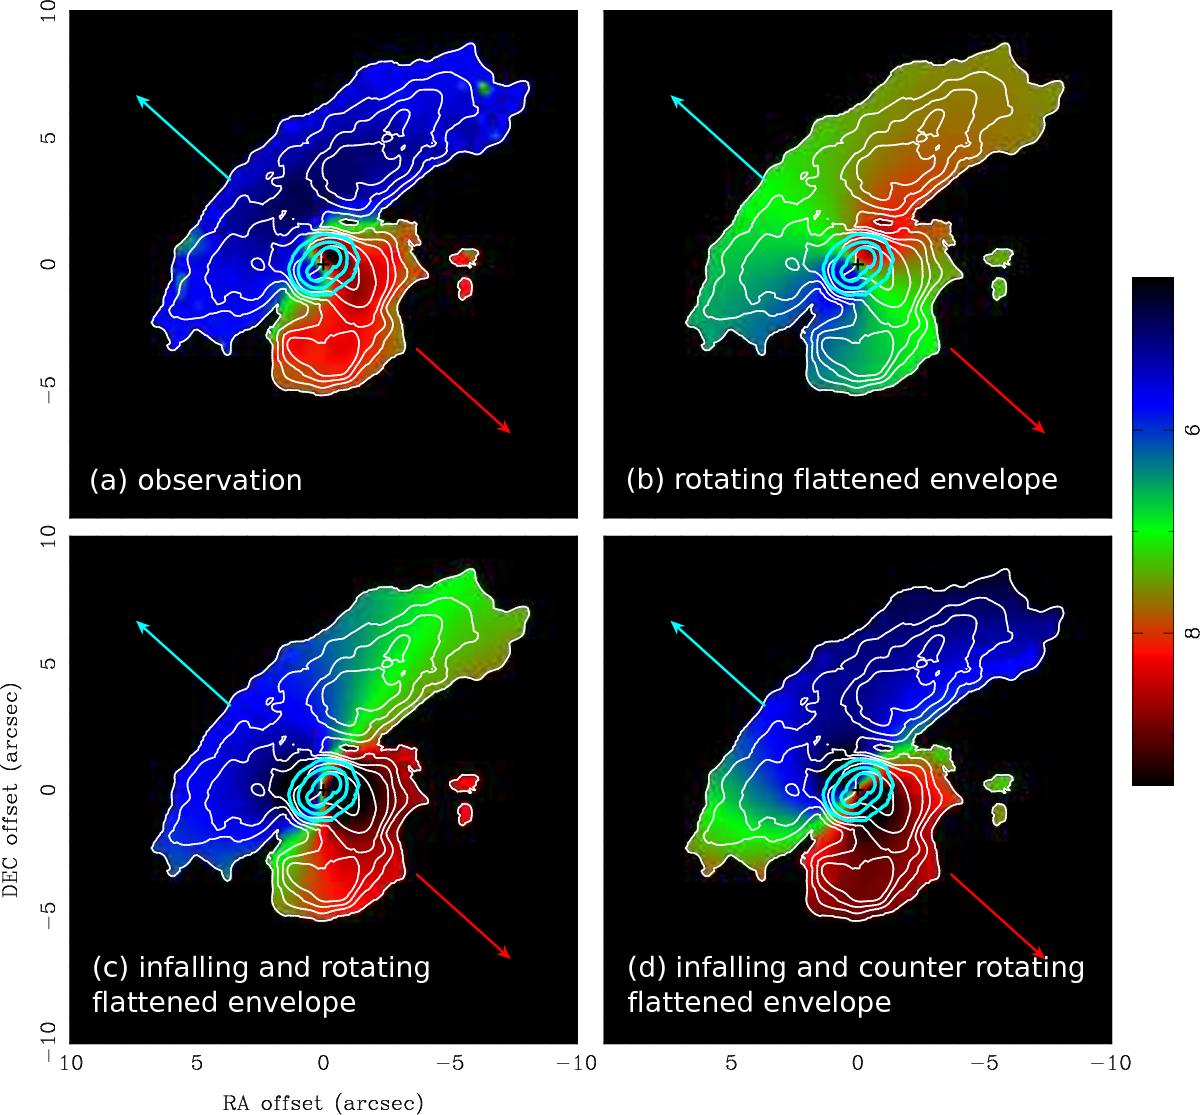
White and light blue contours present the moment 0 map of the 13CO emission at the medium velocities and the C18O emission, respectively. Color scales present the moment 1 maps of panel a: the observed 13CO emission computed with the entire velocity range, same as Fig. 1 left; panel b: Keplerian rotating envelope model; panel c: infalling and rotating envelope model; and panel d: infalling and counter-rotating envelope model in units of km s-1 in the LSR frame. Blue and red arrows show the directions of the blue- and redshifted outflows. Crosses denote the position of HL Tau. Contour levels are 5%, 10%, 15%, 20%, 35%, 70%, and 90% of the peak intensity in the 13CO map, and are 20%, 50%, and 80% of the peak intensity in the C18O map. The peak intensities are 0.78 and 0.41 Jy Beam-1 km s-1, corresponding to 94σ and 52σ, in the 13CO and C18O maps, respectively.
Current usage metrics show cumulative count of Article Views (full-text article views including HTML views, PDF and ePub downloads, according to the available data) and Abstracts Views on Vision4Press platform.
Data correspond to usage on the plateform after 2015. The current usage metrics is available 48-96 hours after online publication and is updated daily on week days.
Initial download of the metrics may take a while.