Fig. 2
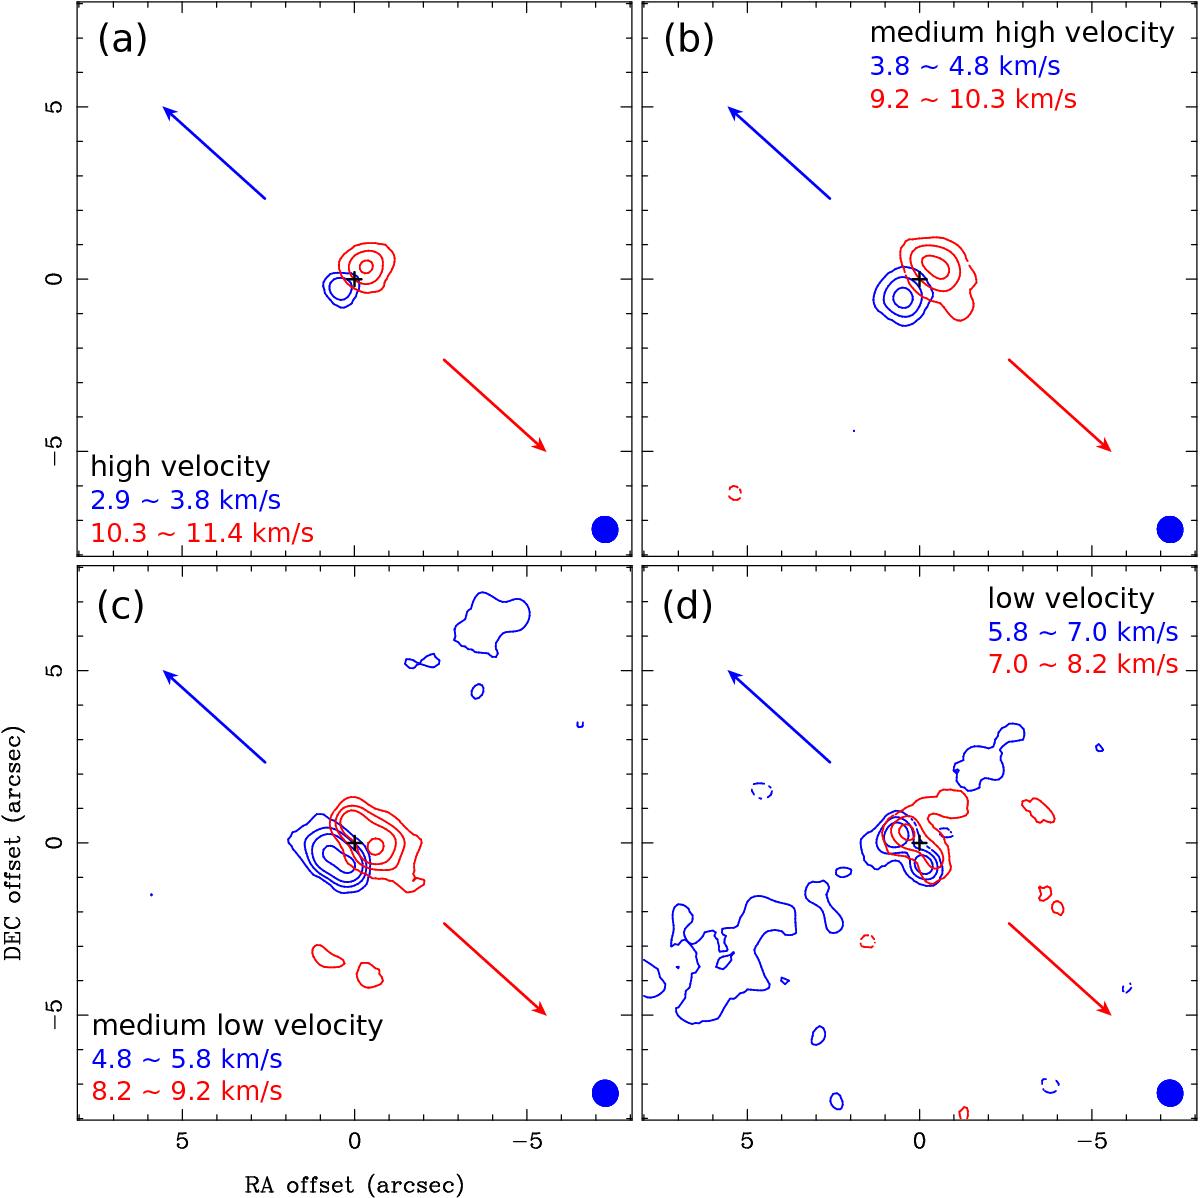
Moment 0 maps of the C18O emission integrated over four different velocity ranges, high velocities (VLSR = 2.9–3.8 and 10.3–11.4 km s-1), medium-high velocities (VLSR = 3.8–4.8 and 9.2–10.3 km s-1), medium-low velocities (VLSR = 4.8–5.8 and 8.2–9.2 km s-1), and low velocities (VLSR = 5.8–7.1 and 7.1–8.2 km s-1). Blue and red contours present the blue- and redshifted emission, respectively. Blue and red arrows show the directions of the blue- and redshifted outflows. Crosses denote the position of HL Tau. Filled blue ellipses show the size of the synthesized beam. Contour levels are 5σ, 10σ, and 15σ in the high-velocity blueshifted map, are 5σ, 15σ, 30σ, 50σ, and 70σ in the high-velocity redshifted map, are 5σ, 15σ, 30σ, and 45σ in the medium-high-velocity maps, are 5σ, 10σ, 15σ, 25σ, 45σ, and 75σ in the medium-low-velocity maps, and are 5σ, 10σ, 15σ, 25σ, 45σ, and 75σ in the low-velocity maps. The noise level in the high-velocity redshifted map is 5.1 mJy Beam-1 km s-1, and the levels in the other maps are all 3.9 mJy Beam-1 km s-1.
Current usage metrics show cumulative count of Article Views (full-text article views including HTML views, PDF and ePub downloads, according to the available data) and Abstracts Views on Vision4Press platform.
Data correspond to usage on the plateform after 2015. The current usage metrics is available 48-96 hours after online publication and is updated daily on week days.
Initial download of the metrics may take a while.