Free Access
Fig. 7
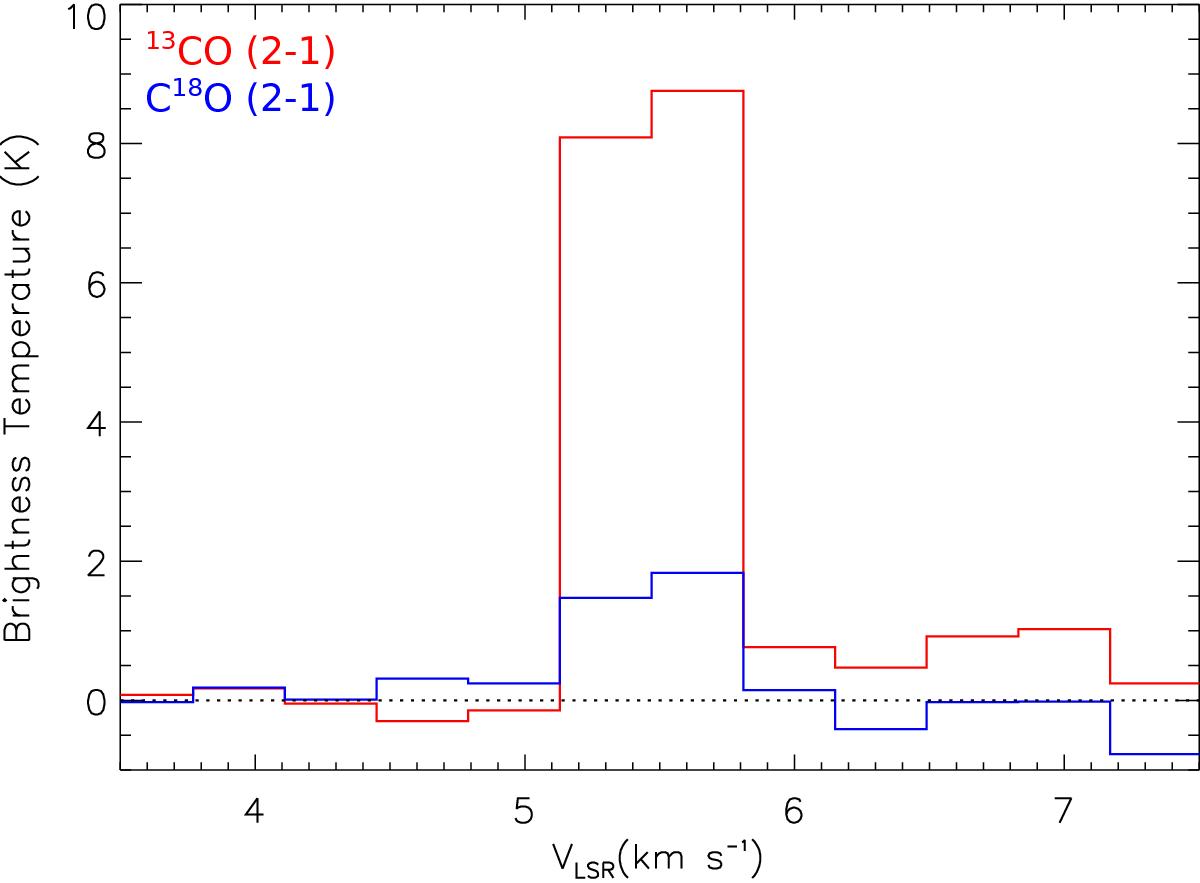
Spectra of the C18O (blue histogram) and 13CO (red histogram) emission averaged over the area within a radius of 0.̋35 centered on the offset of (![]() , 6.̋5), that is, the northwestern C18O component at the medium-low velocity in Fig. 2c. The averaged area corresponds to the area of the synthesized beam.
, 6.̋5), that is, the northwestern C18O component at the medium-low velocity in Fig. 2c. The averaged area corresponds to the area of the synthesized beam.
Current usage metrics show cumulative count of Article Views (full-text article views including HTML views, PDF and ePub downloads, according to the available data) and Abstracts Views on Vision4Press platform.
Data correspond to usage on the plateform after 2015. The current usage metrics is available 48-96 hours after online publication and is updated daily on week days.
Initial download of the metrics may take a while.