Fig. 1
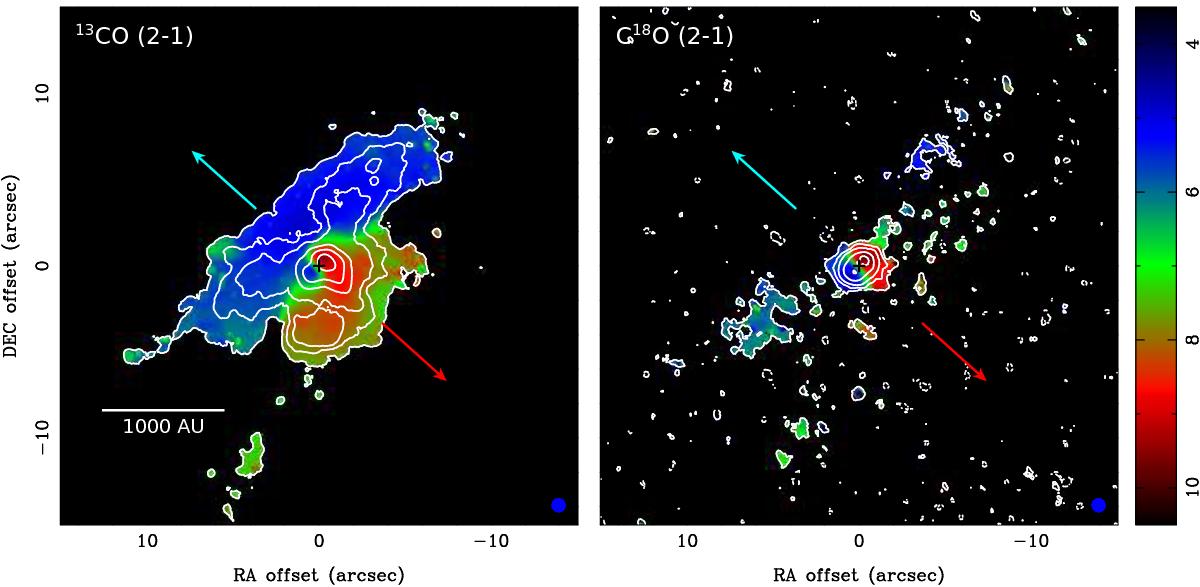
Moment 0 maps (contours) overlaid on moment 1 maps (color; in units of km s-1 in the LSR frame) of the 13CO (2–1; left) and C18O (2–1; right) emission in HL Tau obtained with our ALMA observations. Crosses denote the position of HL Tau. Blue and red arrows show the directions of the blue- and redshifted outflows. Blue filled ellipses present the sizes of the synthesized beams. In the 13CO map, contour levels are 5%, 10%, 15%, 30%, 50%, and 80% of the peak intensity, where the 5% level corresponds to 4.5σ (1σ = 13.7 mJy Beam-1 km s-1). The contour levels in the C18O map are 5%, 15%, 30%, 60%, and 90% of the peak intensity, where the 5% level corresponds to 2σ (1σ = 11.6 mJy Beam-1 km s-1).
Current usage metrics show cumulative count of Article Views (full-text article views including HTML views, PDF and ePub downloads, according to the available data) and Abstracts Views on Vision4Press platform.
Data correspond to usage on the plateform after 2015. The current usage metrics is available 48-96 hours after online publication and is updated daily on week days.
Initial download of the metrics may take a while.