Fig. 3
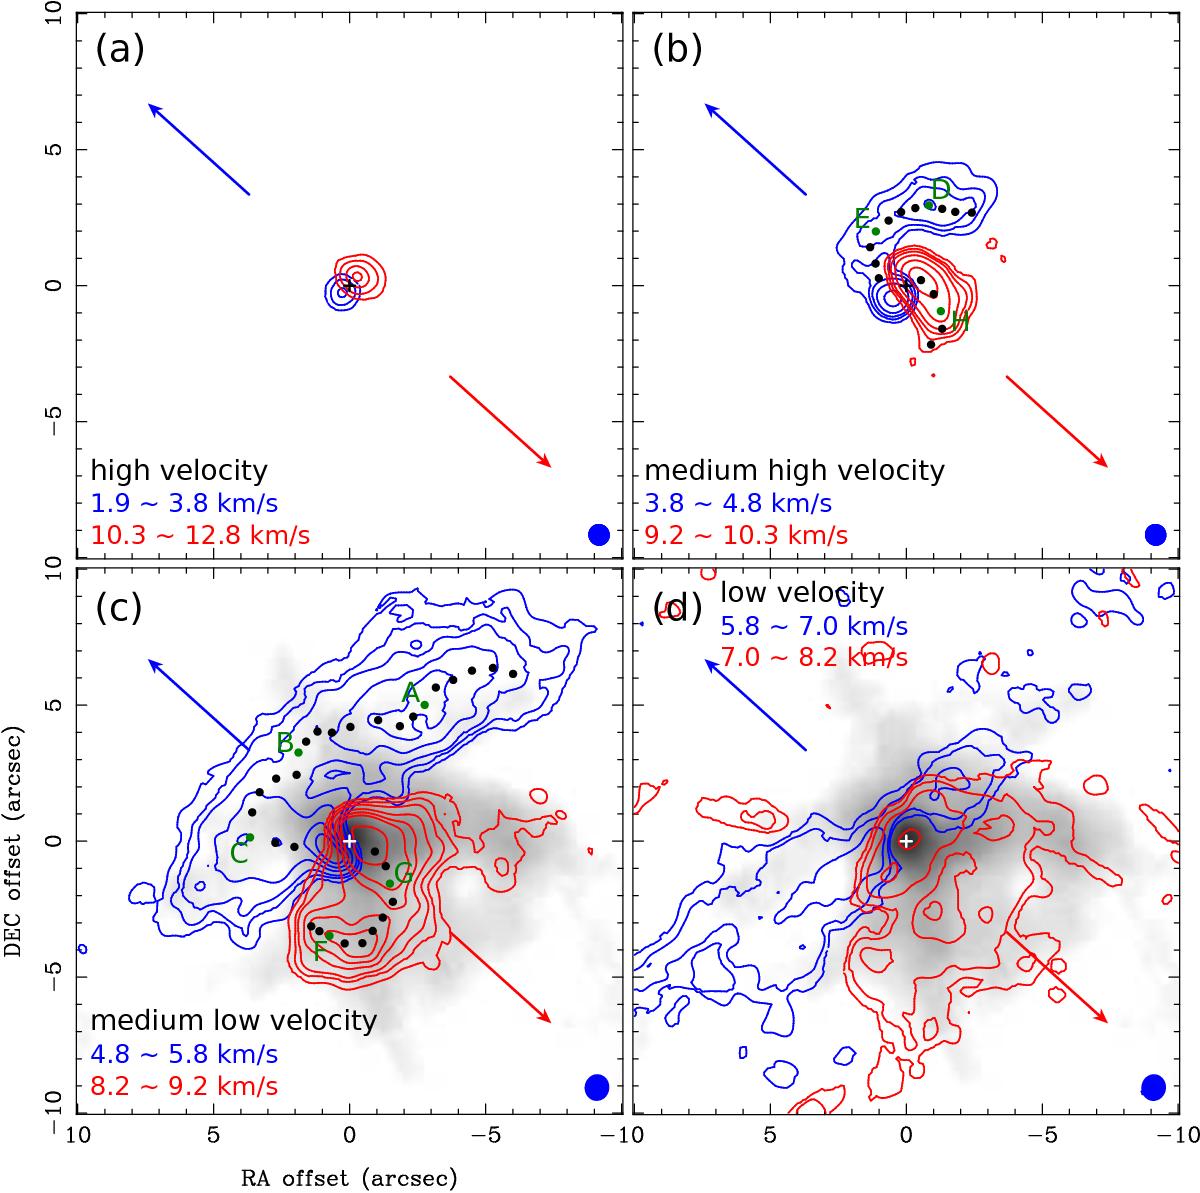
Same as Fig. 2, but for the 13CO emission, and the high-velocity range for the 13CO emission is VLSR = 1.9–3.8 and 10.3–12.8 km s-1. Black and green dots delineate the ridges of the contour lines, showing the arc structures. The ridges of the contour lines were measured from the peak positions of the intensity profiles along the transverse directions of the arc structures. Green dots with labels A–H mark the positions of the extracted spectra show in Fig. 4. Gray scales in panels c and d present the moment 0 map of the CO (1–0) emission observed with ALMA, and the map is obtained from the data released by ALMA Partnership et al. (2015). Contour levels are 5σ, 15σ, and 30σ in the high-velocity blueshifted map, are 5σ, 15σ, 35σ, and 55σ in the high-velocity redshifted map, are 5σ, 15σ, 25σ, 45σ, and 75σ in the medium-high-velocity maps, are 5σ, 10σ, 15σ, 25σ, 35σ, 45σ, and 75σ in the medium-low-velocity maps, and are 5σ, 10σ, 15σ, 20σ, and 60σ in the low-velocity maps. The noise level in the high-velocity blue- and redshifted map is 5.8 and 7.1 mJy Beam-1 km s-1, respectively, and the levels in the other maps are all 4.1 mJy Beam-1 km s-1. Significant flux is missing in the velocity ranges of panels c and d, as shown in Figs. B.1 and B.2. The negative contours are not plotted in panels c and d for clarity.
Current usage metrics show cumulative count of Article Views (full-text article views including HTML views, PDF and ePub downloads, according to the available data) and Abstracts Views on Vision4Press platform.
Data correspond to usage on the plateform after 2015. The current usage metrics is available 48-96 hours after online publication and is updated daily on week days.
Initial download of the metrics may take a while.